
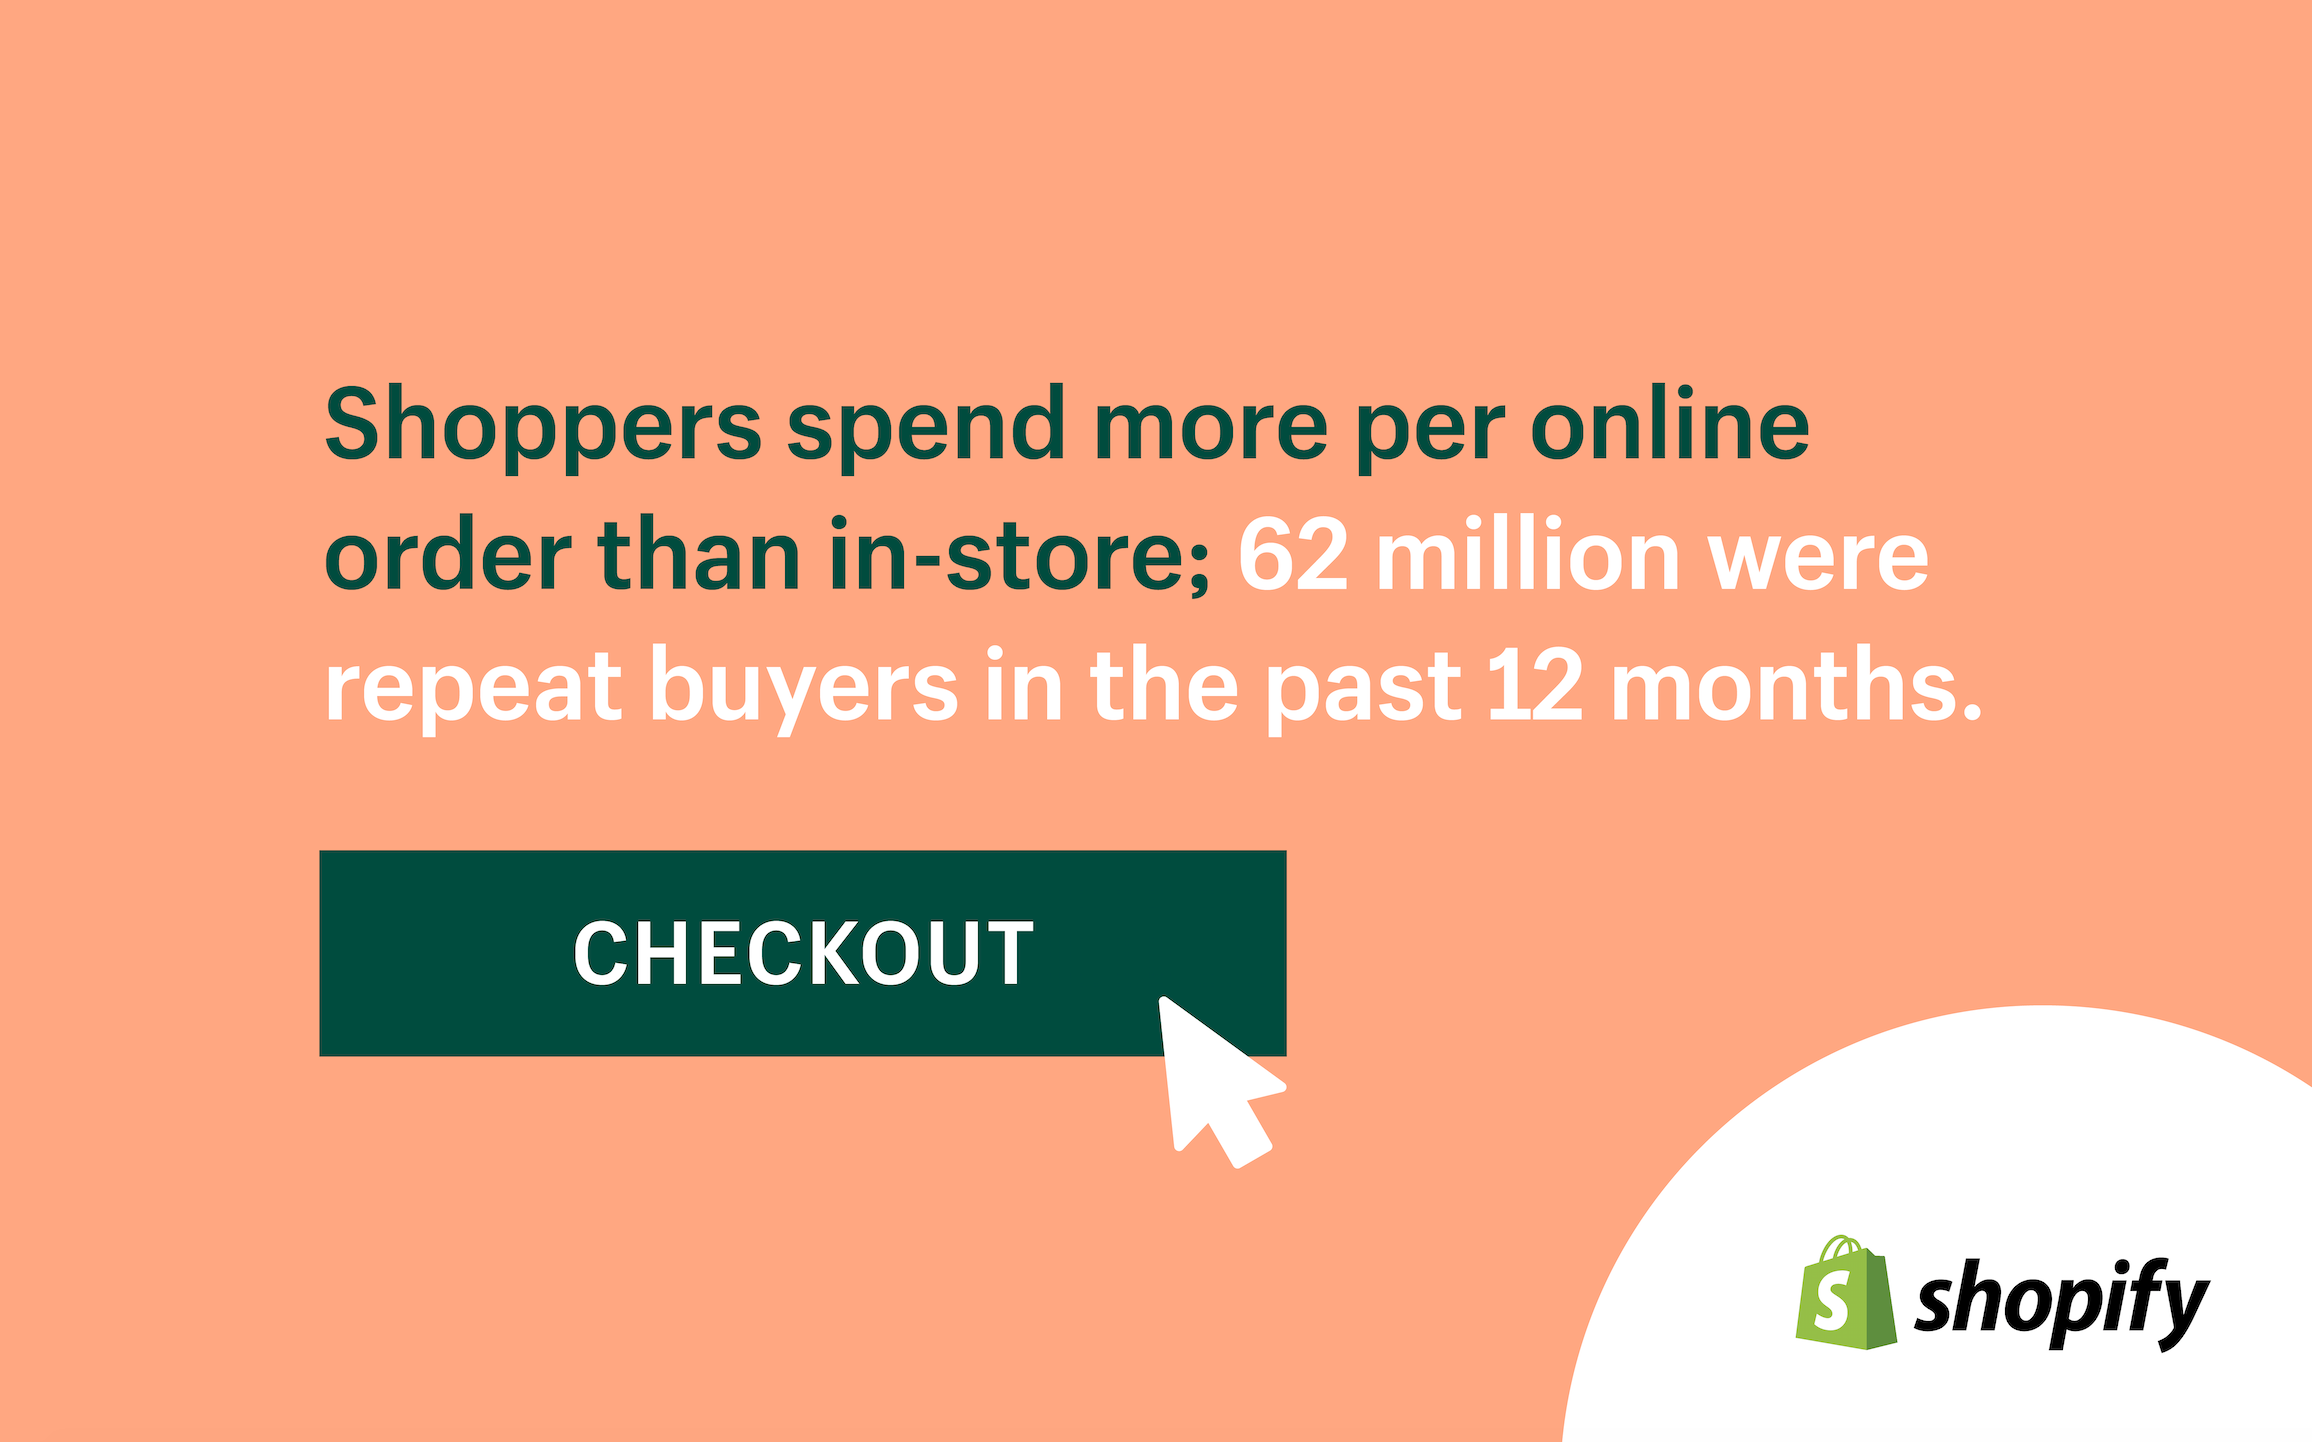
Shoppers spend more per online order than in-store; 62 million were repeat buyers in last 12 months
Today, we released our first global State of Commerce report* with insights on what's driving direct-to-consumer (DTC) commerce and buying behavior. Over the last year, the retail industry has experienced tremendous disruption, and within this changed retail landscape, customers and merchants have found new opportunities to buy and sell goods.
In our new State of Commerce report, we reveal key findings including:
- It’s a battle for brand loyalty, but the winners see more repeat buyers: Over 62 million buyers around the world have bought from the same Shopify store twice, with buyers purchasing 3.8 times on average from the same store.
- Shoppers love a good excuse to buy, especially holidays, but sales drop off in February: November is the most popular shopping month worldwide, while February is the least active and January rings up the largest year-over-year growth outside of the holiday season.
- Americans shop most frequently, Germans the fastest, and Japanese shoppers are the biggest spenders: Consumers in the US buy nearly twice as much (6 items) as any other country (2-3 items); buyers in Germany make the fastest online shopping decisions, making a purchase in less than 18 minutes; while Japanese consumers spend the most per transaction, around $142 USD on average, compared to the US at around $81 USD.
- Mobile, tablet or desktop? Geography impacts how buyers purchase: Consumers in Brazil choose mobile over desktop, while buyers in Denmark, Ireland, Malaysia, Morocco, the Netherlands, New Zealand, Singapore and Vietnam purchase on tablets more than mobile. However, buyers in the US, Australia, Canada, China and the UK purchase in equal volume across tablets, desktop and mobile.
- Social media drives discovery but it’s not where most shoppers buy: Online storefronts represent over 80% of sales, followed by point of sale (POS).
For all the insights from Shopify’s State of Commerce report, download it below.
Shopify's State of Commerce Report - June 5, 2019.pdf*This report is based on a subsection of global sales data on Shopify from April 2018 to April 2019; An online global survey of 3,832 Shopify merchants in March 2019; and quantitative and qualitative research on consumers in Canada and the United States in December 2018, including interviews and an online survey of 2,653 consumers.