The Role of Medicaid in Rural America
| Appendix Table 1: Nonelderly Population by Geographic Area, 2015 | |||
| % in Rural Areas | % in Urban Areas | % in Other Areas | |
| United States | 19% | 20% | 60% |
| Alabama | 34% | 0% | 66% |
| Alaska | 59% | 0% | 41% |
| Arizona | 17% | 0% | 83% |
| Arkansas | 51% | 0% | 49% |
| California | 3% | 10% | 86% |
| Colorado | 19% | 13% | 68% |
| Connecticut | 0% | 51% | 49% |
| Delaware | 0% | 0% | 100% |
| DC | 0% | 100% | 0% |
| Florida | 5% | 4% | 91% |
| Georgia | 22% | 37% | 40% |
| Hawaii | 18% | 0% | 70% |
| Idaho | 52% | 0% | 48% |
| Illinois | 15% | 54% | 31% |
| Indiana | 30% | 15% | 56% |
| Iowa | 52% | 0% | 48% |
| Kansas | 46% | 0% | 54% |
| Kentucky | 49% | 17% | 34% |
| Louisiana | 33% | 0% | 67% |
| Maine | 45% | 0% | 55% |
| Maryland | 4% | 11% | 85% |
| Massachusetts | 1% | 46% | 53% |
| Michigan | 21% | 18% | 61% |
| Minnesota | 34% | 33% | 33% |
| Mississippi | 60% | 0% | 40% |
| Missouri | 35% | 22% | 43% |
| Montana | 100% | 0% | 0% |
| Nebraska | 44% | 0% | 56% |
| Nevada | 9% | 0% | 91% |
| New Hampshire | 25% | 0% | 75% |
| New Jersey | 0% | 43% | 57% |
| New Mexico | 67% | 0% | 33% |
| New York | 10% | 51% | 39% |
| North Carolina | 22% | 11% | 67% |
| North Dakota | 100% | 0% | 0% |
| Ohio | 20% | 29% | 51% |
| Oklahoma | 47% | 0% | 53% |
| Oregon | 32% | 0% | 68% |
| Pennsylvania | 12% | 33% | 55% |
| Rhode Island | 0% | 0% | 100% |
| South Carolina | 24% | 0% | 76% |
| South Dakota | 78% | 0% | 22% |
| Tennessee | 30% | 0% | 70% |
| Texas | 15% | 34% | 51% |
| Utah | 24% | 0% | 76% |
| Vermont | 73% | 0% | 27% |
| Virginia | 23% | 34% | 43% |
| Washington | 16% | 0% | 84% |
| West Virginia | 46% | 0% | 54% |
| Wisconsin | 33% | 17% | 49% |
| Wyoming | 100% | 0% | 0% |
| NOTES: Includes nonelderly individuals ages 0-64. Totals may not sum to 100% due to rounding. Totals for Hawaii do not sum to 100% because FIPS county codes 15005 and 15009 are not assigned an IRR; population in geographic area is N/A.
SOURCE: Kaiser Family Foundation analysis based on the 2015 American Community Survey 1-Year Estimates. |
|||
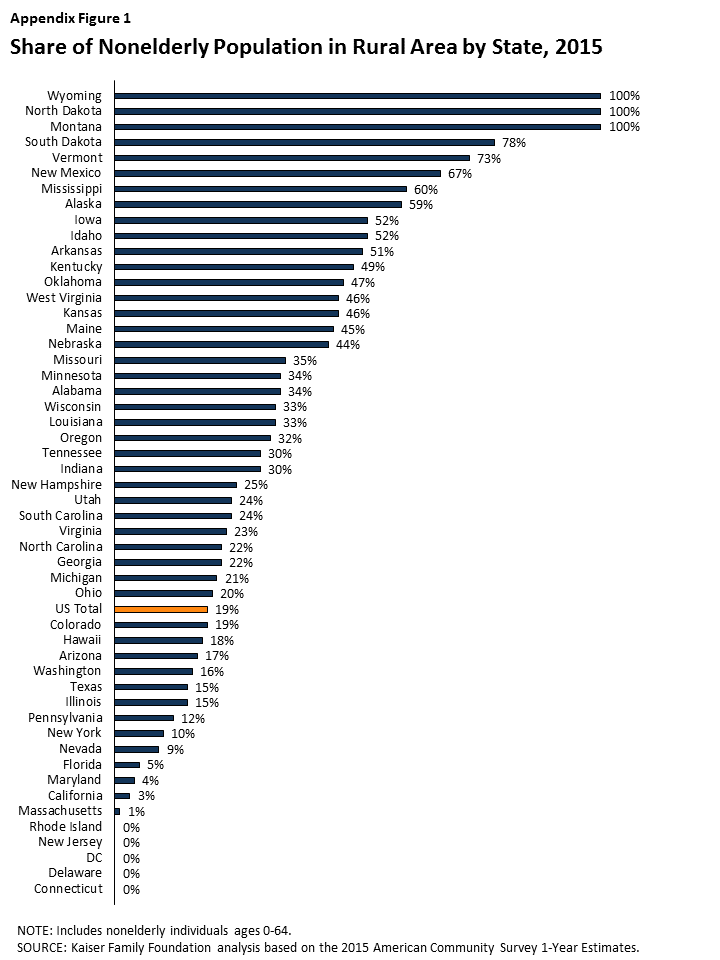
Appendix Figure 1: Share of Nonelderly Population in Rural Area by State, 2015
| Appendix Table 2: Demographics by Geographic Area, 2015 | |||
| Rural | Urban | Other | |
| Mean Index of Relative Rurality, 2010 | 0.51 | 0.13 | 0.34 |
| Nonelderly (0-64) | |||
| Age | 30% | 28% | 29% |
| 0-18 | 30% | 28% | 29% |
| 19-34 | 24% | 28% | 26% |
| 35-54 | 30% | 31% | 31% |
| 55-64 | 17% | 14% | 15% |
| Sex | |||
| Male | 50% | 49% | 50% |
| Female | 50% | 51% | 50% |
| Race/Ethnicity | |||
| Non-Hispanic White | 76% | 45% | 58% |
| Non-Hispanic Black | 8% | 21% | 11% |
| Hispanic | 10% | 22% | 21% |
| Non-Hispanic Other Race | 5% | 12% | 9% |
| Citizenship | |||
| Citizen | 96% | 79% | 86% |
| Naturalized Citizen | 1% | 9% | 6% |
| Non-Citizen | 3% | 12% | 8% |
| Poverty | |||
| <100% FPL | 18% | 16% | 15% |
| 100-199% FPL | 20% | 17% | 17% |
| 200-399% FPL | 32% | 26% | 29% |
| 400% FPL | 28% | 40% | 38% |
| Census Region | |||
| Northeast | 8% | 35% | 14% |
| Midwest | 31% | 26% | 16% |
| South | 42% | 31% | 38% |
| West | 19% | 7% | 31% |
| Nonelderly Adults (19-64) | |||
| Education | |||
| Less than High School | 11% | 12% | 11% |
| High School Diploma or GED | 34% | 23% | 25% |
| Some College | 36% | 28% | 34% |
| Bachelor’s Degree or Higher | 19% | 37% | 30% |
| Work Status | |||
| Working | 70% | 74% | 73% |
| Unemployed | 4% | 5% | 5% |
| Not in Labor Force | 26% | 21% | 22% |
| Disability | |||
| With Disability | 14% | 9% | 10% |
| Without Disability | 86% | 91% | 90% |
| NOTES: People of Hispanic origin may be of any race but are categorized as Hispanic for this analysis; all other racial groups are non-Hispanic. Disability includes limitation in vision, hearing, mobility, cognitive functioning, self-care, and/or independent living.
SOURCE: Kaiser Family Foundation analysis of the 2015 American Community Survey 1-Year Estimates. |
|||
| Appendix Table 3: Health Coverage Among the Nonelderly Population by Geographic Area, 2015 | ||||||||||||||
| Medicaid | Other Public | Private | Uninsured | |||||||||||
| Rural | Urban | Other | Rural | Urban | Other | Rural | Urban | Other | Rural | Urban | Other | |||
| United States | 24% | 22% | 21% | 4% | 2% | 3% | 61% | 64% | 66% | 12% | 11% | 10% | ||
| Implemented Medicaid Expansion- Democratic/Independent Governor | ||||||||||||||
| California | 37% | 21% | 28% | 3% | 1% | 3% | 49% | 69% | 60% | 11% | 9% | 10% | ||
| Colorado | 26% | 23% | 18% | 4% | 2% | 5% | 57% | 62% | 70% | 12% | 13% | 8% | ||
| Connecticut | N/A | 21% | 20% | N/A | 1% | 2% | N/A | 69% | 73% | N/A | 9% | 5% | ||
| Delaware | N/A | N/A | 23% | N/A | N/A | 3% | N/A | N/A | 67% | N/A | N/A | 6% | ||
| DC | N/A | 26% | N/A | N/A | 2% | N/A | N/A | 68% | N/A | N/A | 4% | N/A | ||
| Hawaii | 28% | N/A | 15% | 3% | N/A | 12% | 64% | N/A | 69% | 5% | N/A | 4% | ||
| Louisiana | 25% | N/A | 23% | 4% | N/A | 4% | 55% | N/A | 60% | 16% | N/A | 13% | ||
| Minnesota | 22% | 21% | 15% | 2% | 1% | 1% | 70% | 72% | 79% | 5% | 6% | 4% | ||
| Montana | 17% | N/A | N/A | 4% | N/A | N/A | 66% | N/A | N/A | 14% | N/A | N/A | ||
| New York | 26% | 31% | 21% | 4% | 1% | 2% | 63% | 58% | 71% | 7% | 10% | 6% | ||
| Oregon | 31% | N/A | 24% | 3% | N/A | 2% | 56% | N/A | 66% | 9% | N/A | 8% | ||
| Pennsylvania | 22% | 22% | 18% | 3% | 2% | 2% | 67% | 69% | 73% | 8% | 8% | 7% | ||
| Rhode Island | N/A | N/A | 24% | N/A | N/A | 2% | N/A | N/A | 68% | N/A | N/A | 6% | ||
| Washington | 30% | N/A | 21% | 4% | N/A | 4% | 56% | N/A | 68% | 10% | N/A | 7% | ||
| West Virginia | 32% | N/A | 28% | 4% | N/A | 4% | 57% | N/A | 62% | 7% | N/A | 6% | ||
| Alaska | 19% | N/A | 20% | 8% | N/A | 9% | 55% | N/A | 60% | 19% | N/A | 11% | ||
| Implemented Medicaid Expansion- Republican Governor | ||||||||||||||
| Arizona | 32% | N/A | 22% | 5% | N/A | 3% | 48% | N/A | 62% | 15% | N/A | 13% | ||
| Arkansas | 33% | N/A | 23% | 4% | N/A | 4% | 52% | N/A | 62% | 11% | N/A | 11% | ||
| Illinois | 25% | 22% | 20% | 2% | 2% | 2% | 67% | 67% | 71% | 6% | 10% | 6% | ||
| Indiana | 17% | 26% | 17% | 3% | 3% | 3% | 69% | 58% | 70% | 11% | 14% | 11% | ||
| Iowa | 20% | N/A | 18% | 2% | N/A | 2% | 72% | N/A | 74% | 6% | N/A | 6% | ||
| Kentucky | 32% | 24% | 23% | 6% | 2% | 4% | 54% | 67% | 67% | 8% | 6% | 7% | ||
| Maryland | 25% | 34% | 16% | 3% | 3% | 4% | 66% | 53% | 73% | 6% | 9% | 7% | ||
| Massachusetts | 24% | 21% | 28% | 1% | 1% | 2% | 71% | 75% | 67% | 4% | 3% | 3% | ||
| Michigan | 25% | 37% | 21% | 3% | 2% | 2% | 64% | 53% | 71% | 8% | 8% | 6% | ||
| Nevada | 21% | N/A | 20% | 3% | N/A | 4% | 65% | N/A | 62% | 11% | N/A | 14% | ||
| New Hampshire | 17% | N/A | 12% | 3% | N/A | 3% | 69% | N/A | 78% | 11% | N/A | 7% | ||
| New Jersey | N/A | 19% | 18% | N/A | 1% | 2% | N/A | 68% | 72% | N/A | 13% | 8% | ||
| New Mexico | 36% | N/A | 32% | 4% | N/A | 5% | 47% | N/A | 52% | 13% | N/A | 11% | ||
| North Dakota | 11% | N/A | N/A | 4% | N/A | N/A | 76% | N/A | N/A | 9% | N/A | N/A | ||
| Ohio | 24% | 24% | 22% | 3% | 2% | 3% | 65% | 66% | 68% | 8% | 8% | 7% | ||
| Vermont | 29% | N/A | 21% | 2% | N/A | 2% | 63% | N/A | 74% | 6% | N/A | 4% | ||
| Has Not Implemented Medicaid Expansion- Democratic Governor | ||||||||||||||
| North Carolina | 24% | 16% | 19% | 5% | 2% | 6% | 56% | 69% | 63% | 15% | 13% | 12% | ||
| Virginia | 17% | 12% | 11% | 5% | 8% | 9% | 66% | 69% | 71% | 12% | 11% | 9% | ||
| Has Not Implemented Medicaid Expansion- Republican Governor | ||||||||||||||
| Alabama | 24% | N/A | 20% | 5% | N/A | 4% | 58% | N/A | 64% | 13% | N/A | 12% | ||
| Florida | 27% | 17% | 20% | 5% | 4% | 4% | 50% | 64% | 60% | 18% | 14% | 16% | ||
| Georgia | 24% | 16% | 17% | 5% | 2% | 6% | 53% | 66% | 62% | 18% | 16% | 14% | ||
| Idaho | 19% | N/A | 17% | 3% | N/A | 3% | 64% | N/A | 68% | 14% | N/A | 12% | ||
| Kansas | 14% | N/A | 14% | 6% | N/A | 2% | 69% | N/A | 73% | 10% | N/A | 11% | ||
| Maine | 25% | N/A | 16% | 4% | N/A | 3% | 59% | N/A | 71% | 12% | N/A | 9% | ||
| Mississippi | 29% | N/A | 23% | 4% | N/A | 6% | 52% | N/A | 57% | 15% | N/A | 14% | ||
| Missouri | 19% | 15% | 13% | 7% | 2% | 3% | 60% | 74% | 73% | 14% | 9% | 10% | ||
| Nebraska | 13% | N/A | 13% | 2% | N/A | 4% | 74% | N/A | 75% | 10% | N/A | 8% | ||
| Oklahoma | 21% | N/A | 17% | 5% | N/A | 5% | 57% | N/A | 63% | 17% | N/A | 15% | ||
| South Carolina | 27% | N/A | 19% | 5% | N/A | 5% | 55% | N/A | 64% | 13% | N/A | 12% | ||
| South Dakota | 15% | N/A | 12% | 5% | N/A | 2% | 66% | N/A | 75% | 14% | N/A | 11% | ||
| Tennessee | 26% | N/A | 19% | 5% | N/A | 4% | 57% | N/A | 64% | 12% | N/A | 12% | ||
| Texas | 19% | 20% | 16% | 4% | 2% | 4% | 57% | 58% | 62% | 21% | 21% | 17% | ||
| Utah | 13% | N/A | 11% | 2% | N/A | 2% | 71% | N/A | 76% | 14% | N/A | 11% | ||
| Wisconsin | 18% | 30% | 14% | 2% | 2% | 2% | 73% | 60% | 78% | 7% | 9% | 6% | ||
| Wyoming | 12% | N/A | N/A | 4% | N/A | N/A | 71% | N/A | N/A | 12% | N/A | N/A | ||
| NOTES: Includes nonelderly individuals ages 0-64. Totals may not sum to 100% due to rounding. Other Public includes Medicare, military, and Veterans Administration coverage. MT and LA adopted Medicaid expansion in 2016. N/A indicates lack of geographic area in state.
SOURCE: Kaiser Family Foundation analysis based on the 2015 American Community Survey 1-Year Estimates. |
||||||||||||||