Contents
- Abstract
- Introduction
- Defining agritourism
- Surveys used to collect a sample of local data
- Key terms
- Comparing agritourism and other marketing channel farm sales
- Maintaining good relationships between agritourism farms and other rural landowners
- Summary
- Appendix: An example of how agritourism may be expanded
- Notes

Abstract
By researching agritourism’s economic effects on Oregon farms and our communities, this study explores how agritourism can diversify farming businesses. We reviewed existing agritourism data and supplemented our analysis with two surveys and knowledge from industry experts, producer associations and the authors. This report was created for Oregon partners and organizations interested in agritourism. It should not be used to make precise estimates for other study areas without gathering the descriptive data referenced above.
Our estimates suggest:
- Agritourism is very diverse, and many farmers provide several agritourism products and services, which range from selling food at farm stands to on-farm lodging. Agritourism consumers are primarily people living within 50 miles of the farms. However, approximately a third of consumers come from more than 50 miles away for day (19%) and overnight visits (15%) to the area.
- Approximately 4,000 of the total number of 18,679 farms in the Willamette Valley may be engaged in agritourism.
- Producers that diversify with agritourism may increase their sales and financial resilience, potentially spreading almost half of their gross and net revenues between the wholesale and agritourism portions of their operations.
- When the economic effects of agritourism sales (Table 9), day visitor spending (Table 11), and overnight visitor spending (Table 13) are totaled, the direct sales exceed $985 million and the value-added (sales minus outside inputs similar to GDP) exceed $572 million.
- The employment impact, including full- and part-time jobs, is near 11,000 jobs — calculated from the combined total of agritourism employment (Table 9), day visitor employment (Table 11), and overnight visitor employment effect (Table 13).
- Depending on whether the median of survey responses or the adjusted average of survey responses is used for estimating the number of agritourism visits there may be between 3.7 million and 13.7 million visits annually. Agritourism is a way that both urban and rural residents can engage with farming and rural activities in the Willamette Valley.
Agritourism lacks a common definition and data. Most of the data required for agritourism does not need to be based on experiments or trials. Instead, Oregon’s agritourism needs a foundation of descriptive data, including an inventory of agritourism farms by county, a summary profile of those farms’ production and enterprise budgets, consumer research that identifies products and services that customers purchase from agritourism farms and other vendors as part of their trips to agritourism farms, and an inventory of each county’s agritourism-related regulations. If you have questions about this study or plan to undertake a similar study, we would be glad to visit with you about what we learned.
Introduction
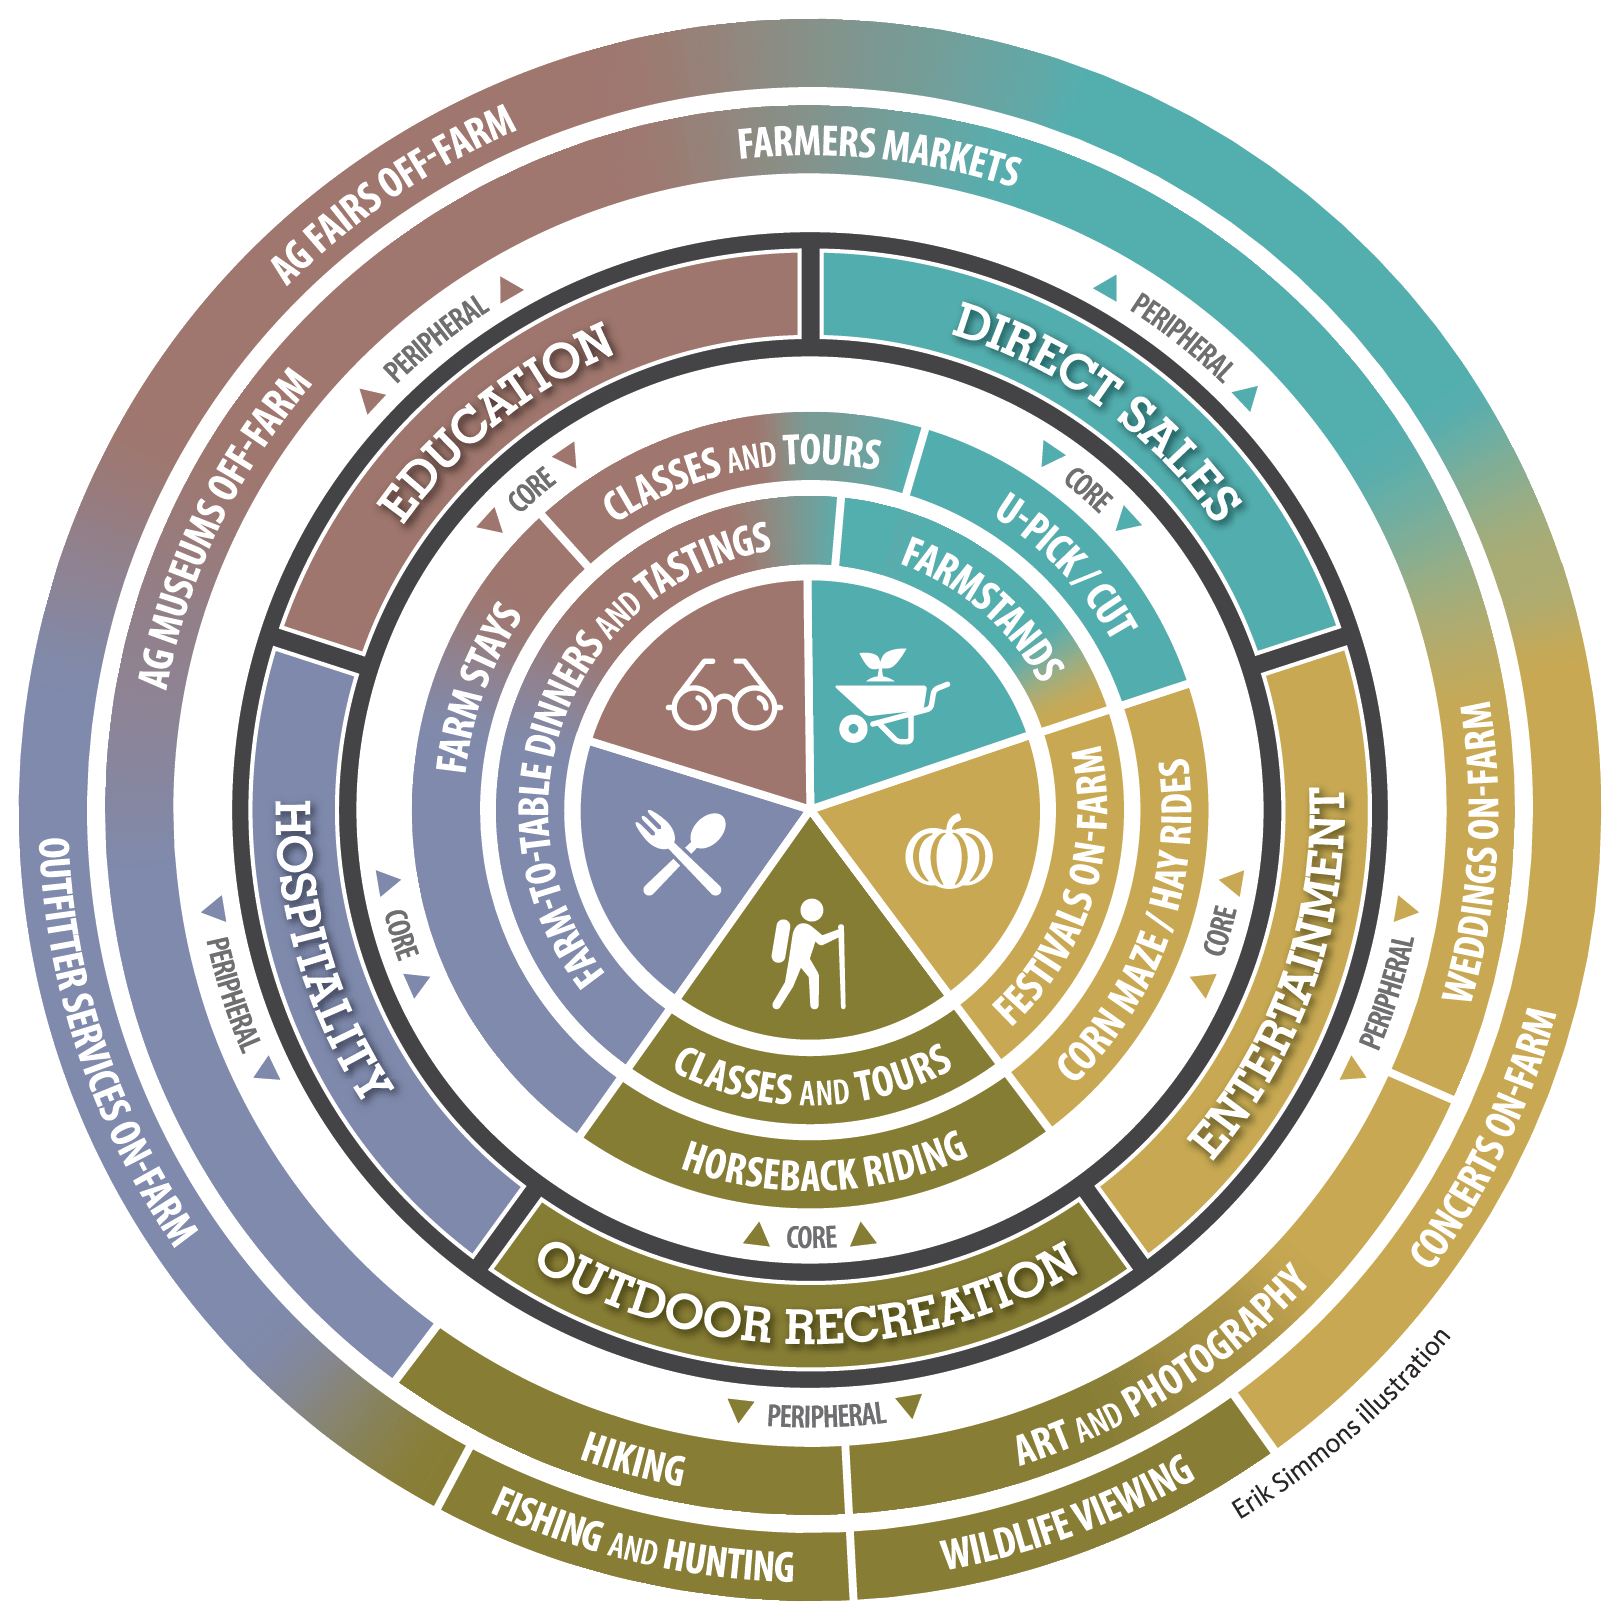
Agricultural commodity markets are typically characterized by many individual farms producing similar outputs. The competitive nature of agricultural production makes it difficult for producers to charge prices that allow them to sustain long-run profits. Producers may benefit from diversifying their revenue sources to differentiate themselves and boost their bottom lines.1 One potential opportunity for farmers to address these challenges is through various forms of agritourism, a term encompassing a broad suite of activities. For this study, we used a 2021 national agritourism survey, in which Oregon participated, to inform our agritourism framework. It includes farm-direct sales, education, entertainment, outdoor recreation and hospitality.2
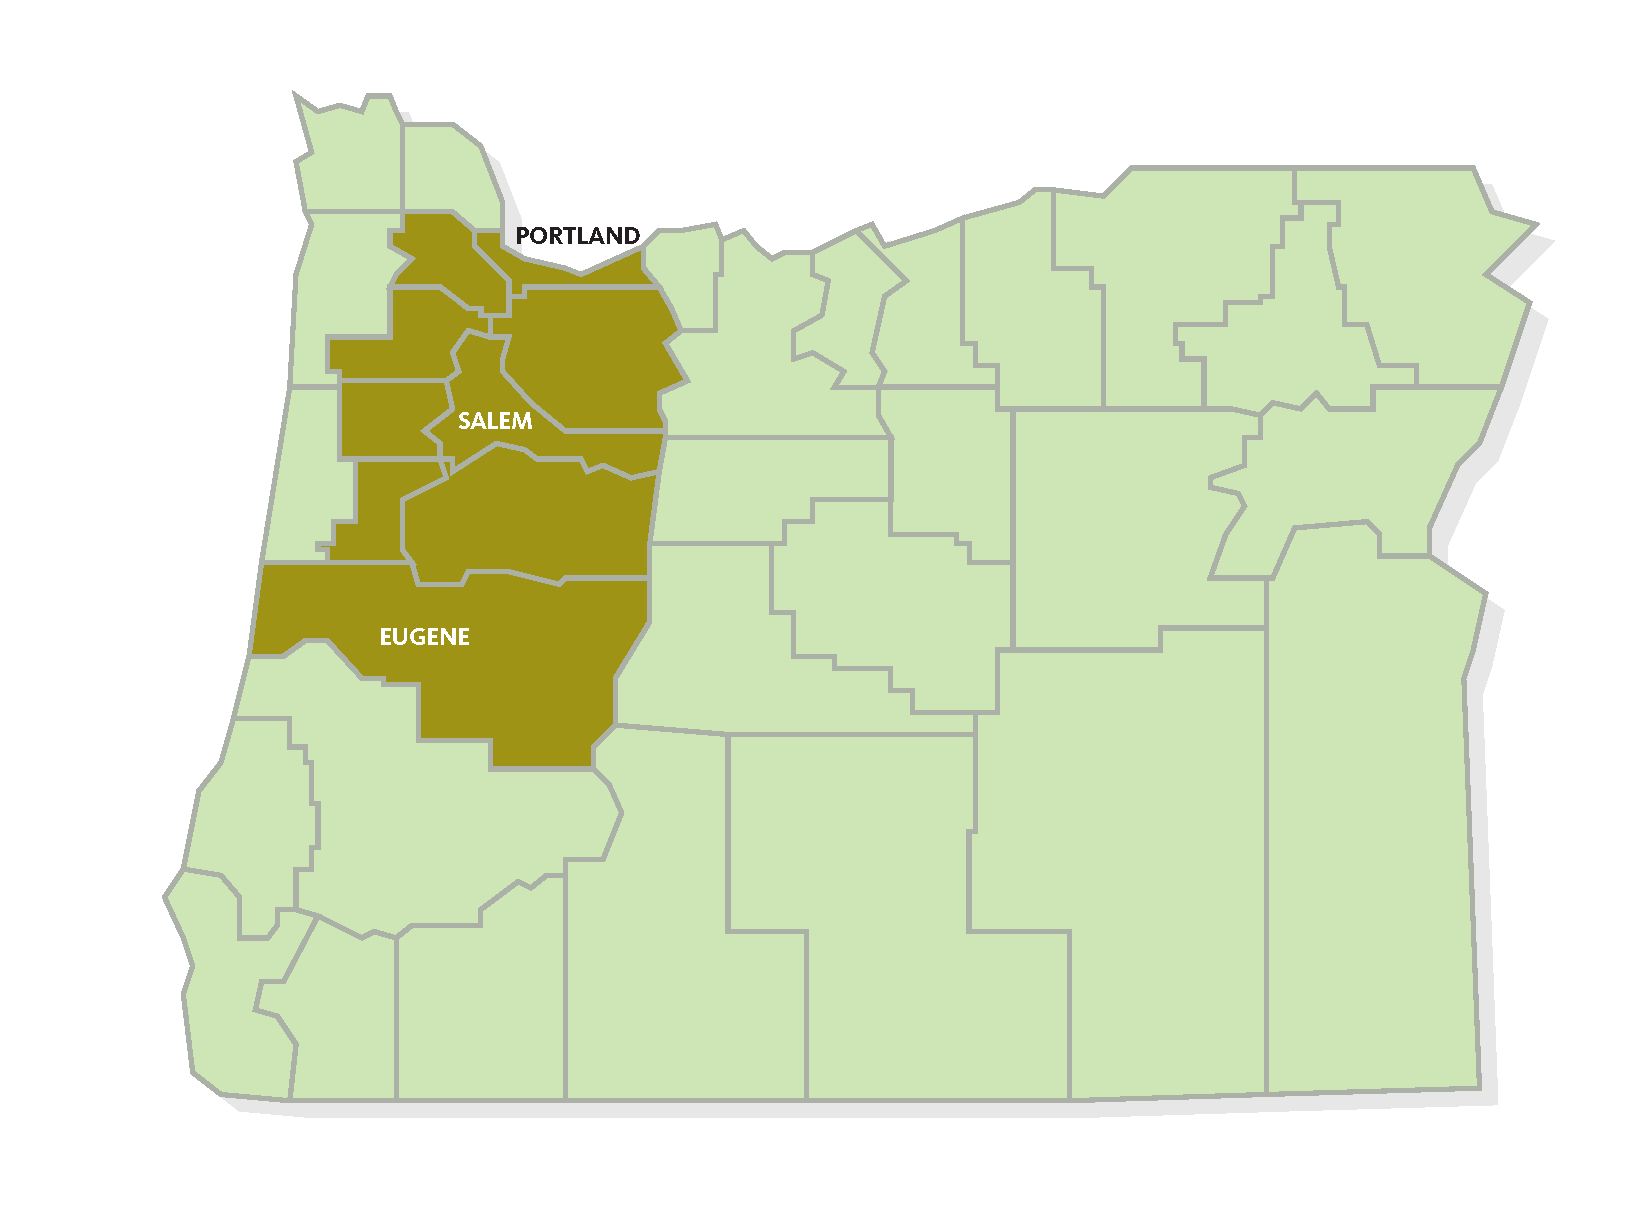
This report details an economic study of agritourism in the Willamette Valley region of Oregon, which includes the following nine counties: Benton, Clackamas, Lane, Linn, Marion, Multnomah, Polk, Yamhill and Washington. While vineyards and wineries are a major contributor to agritourism in the Willamette Valley, these agritourism activities are already well established and widely adopted3. For this reason, our study focuses on all other types of operations and their agritourism products and services in the Willamette Valley. Original survey data collected for the study sheds light on the importance of agritourism and highlights the diverse offerings across the region. Using economic input-output analysis informed by the survey results and the 2017 Census of Agriculture for Oregon, this report estimates the economic effects of agritourism for farmers and local communities in the Willamette Valley. Our findings provide policy-relevant insights into the role that agritourism could play in shaping the character and economic well-being of farmers and rural communities in the years to come.
Defining agritourism
Agritourism refers to how farmers generate income, as noted above, by directly selling goods to customers visiting the farm. This includes farm-direct sales of unprocessed and farm processed agricultural products, and services to consumers in education, entertainment, outdoor recreation, and hospitality. Throughout much of agriculture’s history, this is how farmers marketed traditional agricultural products. The advent, development and widespread adoption of refrigeration brought about a significant change in the industry.4 As a result, wholesale trade, processing and retail trade gradually claimed a larger portion of the food dollar, while direct sales from farmers to consumers declined significantly, becoming more of an exception than the norm. This shift in marketing practices led to a growing disconnect between producers and their customer base, as consumers became gradually more distanced from farming — and more broadly — the rural lifestyle. As a consequence, the ability of consumers to personally visit a farm has transformed into a special experience akin to tourism. Over time, agritourism as a concept has grown to encompass a wide range of services and experiences, including on-farm meals and events, farm stands, lodging, hunting/fishing, food tasting, pumpkin patches and “u-pick” opportunities.
Over the past century, Oregon’s population has become increasingly urbanized, with fewer and fewer people living on farms. Remaining producers have a greater ability to give people an authentic farm experience through agritourism.5 In many ways, this makes agricultural producers similar to the owners of nonfarm businesses, which throughout modern history, have adapted to new market circumstances by changing and diversifying their products and services. A large proportion of farming families already diversify their business revenue streams through off-farm earnings that support farm household finances, which is a particularly important source of income for smaller farms.6 Agritourism could introduce a new stream of on-farm income that decreases the reliance of farming families on off-farm income.
Farms have also become more specialized, relying on scientific advances (such as in machinery and seed technology) and the resulting increases in productivity to maintain revenues. Scale economies in agricultural production, among other factors, mean that larger farms have a greater advantage in using technological advances and making necessary investments in equipment, land and other farm inputs.7 As a result, agricultural production for many commodities has become increasingly consolidated.8, 9, 10 For example, consider our study area of the Willamette Valley. Since 1950, there has been a clear increase in large (500+ acres) farm acreage coinciding with a decline in mid-sized (100-499 acres) farm acreage. Specifically, mid-sized farm acreage declined by 74% between 1950 and 2017, while large farm acreage increased by 30%.11 At roughly 850,000 acres in total, large farms now account for more than half of all farmland in the Willamette Valley.
Smaller farms typically lack the scale associated with modern large-scale commodity production, making diversification of revenue streams like off-farm income more important. Agritourism has a similar potential to diversify a producer’s on-farm revenue streams. While agritourism may provide benefits to farms of all sizes, its potential to produce a more robust farm revenue stream may be more beneficial and appealing to small and mid-sized producers.12
The additional revenue from agritourism may also bolster the resilience of farming operations and the communities that rely upon them to prevent the conversion of farmland to nonfarm uses, such as residential housing. Resilience is the ability to bounce back quickly from a shock, such as an unanticipated drop in wholesale prices, the cancellation of a processor contract or a severe weather event. Diversification in farming operations and other types of business often allows the farmer to bounce back from a shock in one area by offsetting losses with gains in another area.
According to the 2017 USDA National Resources Inventory, Oregon lost about 242,000 acres of cropland, pastureland and rangeland to development between 1982 and 2017.13 This occurred despite the protections afforded to Oregon’s agricultural landowners through the establishment of exclusive farm use zoning in the 1960s and the implementation of urban growth boundaries brought about by a 1973 law.14 Earnings from farm-related activities will rarely be sufficient to offset the lucrative financial returns that could be gained from development. However, by bolstering farm-related income, agritourism could increase the likelihood of producers retaining farmland in its current use and creating a more viable farm succession strategy. Agritourism may also strengthen urban-rural connections and foster social support for maintaining a healthy agricultural sector in Oregon.
Our report provides new insight into how different types of agritourism may add resilience to farm operations in the Willamette Valley. However, we acknowledge several caveats. Much more work is necessary to develop a commonly accepted definition of agritourism, an inventory by county of the different types of agritourism farms and services, and a better profile of consumer tastes and preferences related to agritourism.
Although many consider agritourism a positive development for the region, there are competing views. Of particular concern is whether certain agritourism activities, such as lodging, food service and events, are appropriate to be carried out on a farm and whether they run counter to the original intent of Oregon’s farmland protection policy framework. Indeed, the number of non-exempt uses of Exclusive Farm Use (EFU) zoned land has increased significantly over the past several decades15. While there are potentially legitimate concerns raised about land use conflicts in rural areas, our goal is not to promote agritourism as an industry or suggest that any particular farm should adopt any specific agritourism practices. Rather, we aim to provide economic and other information that may shape and inform both current and future policy debates around agritourism.
Surveys used to collect a sample of local data
Due to the varying definitions of agritourism and because agritourism operations connect into many economic sectors, we collected local data to supplement the modeling program and Census of Agriculture data. Localized agritourism data does not exist in a central location. To overcome this gap in data availability, we conducted an agritourism inventory with publicly available sources. Then, we surveyed and interviewed farmers in the study area that currently offer on-farm activities and direct sales.
To begin an inventory of farms offering agritourism, we performed online searches for different types of agritourism activities in the study area and found those operations actively advertising on search engines, websites and social media. We also requested contacts of known agritourism operations from other agriculture-focused OSU Extension colleagues and community partners. Even though the inventory process was as comprehensive as possible, we could not feasibly collect contact information for all agritourism operators in the study area nor did we expect all collected contact information to be accurate.
We developed and distributed an electronic survey administered through Qualtrics with input from an informal advisory group. We used a “snowball” method of sampling for the electronic survey, whereby an initial group of producers were sent the survey link and asked to respond. Additionally, the same survey link was distributed digitally through partner organizations’ communication channels and outreach from OSU Extension Service, community partners including agritourism and farmer networks, local and regional tourism, economic development and agriculture producer organizations. The survey accepted responses for approximately one month, from the first week of February 2023 to the first week of March 2023.
The survey captured the following input data needed for the economic impact analysis modeling:
- Estimated number of visitors
- Estimated percentage of visitors who are local and repeat customers, visitors that have traveled more than 50 miles for a day trip, and those traveling more than 50 miles and are likely spending the night in the area
- Approximate amount of spending for both local and traveling visitors
- Estimated percentages for gross revenue from agritourism
- Approximate agritourism costs for labor and the number of additional employees hired for the agritourism enterprise
- Estimated percentage of total nonlabor agritourism costs calculated from spending on suppliers from the Willamette Valley, other parts of Oregon and outside of Oregon
- Estimated percentage of the operation’s net revenue (or profit) from agritourism used for annual on-farm production expenses, on-farm capital/land investments, reinvestment in agritourism enterprises and nonfarm purposes
In addition, the survey collected basic farm demographic information, such as location and acreage, and other farm business characteristics, including number of years engaged in agritourism, primary agritourism product or service, seasonality of operating hours, and motivations for starting agritourism alongside farm production.
We received 152 usable online survey responses that included partial and full responses and conducted 10 phone interviews from farms currently offering various types of agritourism in the study area for a total of 162 responses. Of these responses, 140 were complete enough to use for the economic analysis, and all responses were used to characterize agritourism operations. A survey response rate is not available due to the distribution method.
The different number (n) of respondents in the tables represent respondents whose responses were incomplete or did not fit the requested format.
Characteristics of agritourism operations
The 162 respondents are operating agritourism businesses distributed across the nine counties in our Willamette Valley study area (Table 1).
| County | Number of farms | % of total operations |
|---|---|---|
| Clackamas | 34 | 21 |
| Marion | 28 | 17 |
| Lane | 22 | 14 |
| Yamhill | 21 | 13 |
| Benton | 20 | 12 |
| Polk | 15 | 9 |
| Washington | 9 | 6 |
| Linn | 8 | 5 |
| Multnomah | 5 | 3 |
n=162
Most of the farms are small to mid-sized acreages, which is consistent with the size of farms in the Willamette Valley region. Notably, 7% are 200-499 acres and 6% are over 500 acres (Table 2).
Table 2. Farms by acreage size
- 1–9 acres, 17% of total operations
- 10–20 acres, 22% of total operations
- 21–79 acres, 33% of total operations
- 80–199 acres, 15% of total operations
- 200–499 acres, 7% of total operations
- 500+ acres, 6% of total operations
n=162
More than half of the respondents indicated that agritourism has been part of their farm business for at least 10 years (Table 3). 15% of respondents indicated that they have operated an agritourism enterprise since 2020.
Table 3. Number of years farms have engaged in agritourism
- 50+ years offering agritourism, 5% of responses
- 30–49 years offering agritourism, 11%
- 20–29 years offering agritourism, 16%
- 10–19 years offering agritourism, 20%
- 4–9 years offering agritourism, 33%
- 1–3 years offering agritourism, 15%
n=151
Table 4 provides information about the primary agritourism service or product that farmers in the study area operate. Nearly one-third of respondents reported having a farm stand or farm store as the primary agritourism activity. Other common primary activities included “u-pick/u-cut” operations, vineyards/wineries and nurseries. While data from the vineyards/wineries were not included in the economic analysis, some respondents reported vineyards/wineries as their primary form of agritourism. Respondents who chose “Other” indicated activities, such as weddings, photography settings and farm camps, as their primary agritourism service.
Table 4. Primary agritourism service or product
- Farm stand or farm story, 29% of farms
- "U-pick" or "u-cut," 14%
- Vineyard/winery, 10%
- Nursery, 9%
- Educational farm tours, 7%
- On-farm lodging, 7%
- Classes, demonstrations or workshops, 5%
- Other, 5%
- Open farm days, 4%
- Private events, 4%
- Festivals, 2%
- Brewery/cidery, 2%
- Farm-to-table dinners, 1%
- Outdoor recreation, 1%
n=161
Why start agritourism?
We asked producers an open-ended question about their motivation(s) for starting an agritourism enterprise on their farm or ranch. Responses were coded into topic patterns using NVivo software. Producers’ top motivation was additional income that supports the economic sustainability of the farm business. Other motivations spoke to increased social connections with consumers and building community support. These motivations included creating a sense of community, educating visitors about farming, and the joy of sharing their farm and products with others. (Table 5).
Table 5. Ranked motivations for starting an agritourism Enterprise
- Increased income
- Creating sense of community
- Educating visitors about farming
- Joy of sharing their farm products and farm with others
Surprising results of agritourism
The survey also posed an open-ended question allowing respondents to share what they have found most surprising about operating an agritourism business. The coded responses to this question showed three equally surprising factors: (1) agritourism provides learning opportunities for urban visitors, (2) Oregon laws and zoning are not conducive to agritourism, and (3) producers are surprised by how much the public enjoys the rural experience (Table 6). A recent study showed that visiting farms improves adults’ attitudes toward local foods and children gain agriculture literacy after engaging in an agritourism experience (Barbieri et al., 2023).
Table 6. Documented surprises from on-farm agritourism
- Provides learning opportunities for urban dwellers
- Laws and zoning are not conducive for agritourism
- How much the public enjoys the rural experience
Methods used to estimate the economic effects of agritourism
When President George Washington began writing letters to personally gather data about agriculture in 1791 and the United States conducted the first Census of Agriculture in 184016, there was no need to distinguish direct sales to consumers from sales to distributors or processors. Direct sales were the typical form of marketing. As agriculture became more commercialized, the Census of Agriculture started gathering data on direct sales. In the 1974 Census of Agriculture, new questions were added on the different sources of farm-related income and expenses.17 The 1978 Census of Agriculture then added an explicit question about direct sales to consumers.18 While the 2002 Census of Agriculture asked about recreational services, a question containing the term agritourism did not appear until 2007, which defined agritourism as wine tours, hay rides, hunting, fishing and other activities.19 Similar questions appeared in the 2012 and 2017 questionnaires.
We estimated the economic impacts of agritourism in the Willamette Valley using IMPLAN, an economic modeling software program that measures how various projects or policy changes contribute to economic activity (sales, value-added or gross domestic product and jobs) in a specific region, which can range in size from the nation to a ZIP code. The IMPLAN model relies on input-output analysis, which considers the interdependencies between different sectors of an economy. By modeling all economic activity in a defined geographic region, IMPLAN can measure how the activity attributable to a certain project will ripple throughout the entire economy. The IMPLAN model itself is based on various data inputs, which we supplemented and adjusted using data from our original agritourism survey and publicly available data from the 2017 Census of Agriculture. Our analysis is based on our input data and parameters combined with IMPLAN’s most current data set from 2021.
Agritourism data from the most recent (2017) Census of Agriculture is informative but not precise enough to provide the necessary data to estimate the local economic impacts of agritourism for the Willamette Valley. For this reason, we conducted the original agritourism surveys described above to collect the following data:
- Agritourism farm counts
- Type(s) of agritourism practices used
- Farm production for agritourism operations
- Gross revenue and net revenue (profit) for both the agritourism sales and those sales from other marketing channels
- Marketing practices
- Annual visitor counts
To the extent possible, we relied on our data sources and other published studies to generate the input data for the economic impact analysis. However, definitional inconsistencies and limited data availability posed challenges for certain measurements. In a few instances, we consulted with commodity association representatives and used our best judgment to inform the input parameter values.
Economic impact estimates based on IMPLAN or other similar input-output models have received increased skepticism in recent years.20 These types of studies sometimes pursue a “wow” factor to attract support from policymakers, producing results that may sacrifice credibility. To avoid overstating the economic impacts of agritourism, we were conservative in our calculations.
For example, in one of our data challenges, we could not determine if farmers selling unprocessed food directly to consumers also sold value-added products, such as processed food, to consumers. Furthermore, we could not determine if these producers provided agritourism-related services, such as tours or hunting leases.
The complexity of distinguishing farms’ income sources complicated our final tally of agritourism farms in the Willamette Valley. The 2017 Census of Agriculture provided estimates for the number of farms involved in both direct unprocessed food sales and those selling value-added products. To avoid double counting, we only included farms exclusively selling unprocessed food directly to consumers. This assumes that most farms selling processed or value-added food were also selling unprocessed food. However, there is the possibility that some farms selling value-added food do not sell unprocessed food. Therefore, relying solely on the number of farms selling unprocessed foods may underestimate the total number of farms participating in direct sales and agritourism activities.
Since the direct-to-consumer sales information in the 2017 Agricultural Census does not distinguish between on-farm and off-farm sales, we likely offset some of our previously stated undercount of farms engaging in direct sales. Surveys completed for this study along with the 2021 survey by Stewart et al.21 indicated that most of the direct-to-consumer sales derive from on-farm sales. While direct-to-consumer sales, both on-farm and off-farm direct sales, capture more of the food dollar by allowing the farmer to sell at or closer to the retail price, our best data source to validate this came from direct-to-consumer sales in the 2017 Agricultural Census. Even if this includes some off-farm direct sales, we believe those sales are consistent with capturing more of the food dollar. We did not include any sales in direct-to-retail markets and to institutions or food hubs, which predominate off-farm sales aside from wholesale or processor marketing channels.
Agritourism sales often substitute local production for imports typically sold by food stores, thereby preventing leakage of dollars to outside the region. However, agritourism may displace some labor (in food stores, for example) by shifting sales activity to farms. The displacement effect is likely small. Due to limitations with IMPLAN and available data, our estimates do not account for any displacement effects due to agritourism. We have also not accounted for government or other organizations’ spending to support agritourism. That spending could have a positive or negative impact on local economic activity, depending on whether the value of dollars spent on agritourism outweighs the value gained by spending for alternative purposes.
Survey respondents estimated the total number of annual agritourism visitors they received. These annual visitation counts were categorized as visitors who are local, from more than 50 miles away on a day visit, and from more than 50 miles away on an overnight visit. The annual number of visitors in our survey responses ranged from six to 250,000. The median number of visitors was 800. To extrapolate the survey responses to all farms selling directly to consumers, we removed four responses from farms reporting 100,000 or more visitors because they would have substantially increased the average number that was applied to all farms selling directly to consumers. Using the median instead of an adjusted mean would likely undercount the number of visitors, so we used an adjusted mean for farms selling food directly to consumers, which was 3,709 visitors per year. For the other categories of sales, we gathered data from the surveys, producer associations and OSU Extension specialists to estimate the average number of visits.
In estimating the impacts of agritourism, we had to make assumptions about site visit attribution, or the extent to which consumers visited an area because they wanted to purchase an agritourism product or service. While agritourism may be the primary purpose of some trips, if someone stops at an agritourism farm on their way to visit family, for example, then agritourism is incidental to the trip, not its primary purpose. Similarly, sporting events and other local attractions can be a primary reason for a trip that involves some agritourism activity along the way. We based our agritourism visit attribution estimates on a study for the Hatfield Marine Science Center on the Oregon Coast.22 We assumed 40% attribution for day visitors and 20% attribution for overnight visitors not staying at farms. For overnight visitors staying at farms, we used a 100% attribution value.
Our economic impact analysis is based on the 4,033 farms we estimate to be participating in agritourism-related direct sales to consumers. As mentioned, we did not include a separate category for farms selling value-added food in this number of farms estimate, and we did not have a way to determine the number of farms selling only off-farm. We included the value-added (such as jams) sales dollars because they are in addition to the unprocessed food (such as berries) dollars. There are 18,679 farms in the Willamette Valley.
Using the full set of input data, we constructed agritourism sales, and income and employment profiles for our study area. These profiles formed the basis for the following two categories of agritourism economic effects that we estimated:
- Impacts on agritourism farm operation and revenue, including how agritourism revenue is re-spent within the local economy.
- Impacts on local and regional business revenue, including how revenue is re-spent within the regional economy, by attracting visitors from more than 50 miles away to the community for day and overnight visits.
To generate our farm sales and visitor impacts, we used IMPLAN’s detailed model with 546 business sectors, when we understood how many sales to apply to each detailed sector. For example, in crop production, we estimated the sales at 40% vegetables and melons, 40% fruit, 10% tree nuts and 10% other crops. When we were unable to estimate the percentage of sales for each detailed sector, we used a coarser three-digit North American Industrial Classification System (NAICS) aggregation of 88 sectors. One example of using the three-digit model can be found in visitor impact estimates for meat and egg sales direct to consumers and prepared food. As noted above, conducting on-farm consumer surveys in the future would be very valuable to make these estimates, allowing the detailed model to be used for all the impacts.
All estimates are presented in inflation-adjusted 2023 dollars. The sidebar contains a glossary of key terms used in our presentation of results. Our estimates can be easily adjusted because the IMPLAN model is linear and scalable. For example, if you believe that we have overestimated by 100%, divide by two, or if you believe we have underestimated by 50%, multiply by two.
Economic footprint of agritourism
Agritourism industry
This section presents the direct effects of agritourism sales, which measure how they supplement total farm sales. By running the agritourism direct sales through the IMPLAN input-output model, we estimated agritourism’s backward linkages in the supply chain through various layers of re-spending. We referred to impacts involving the re-spending of agritourism-related farm income as indirect effects. We then estimated how agritourism operators, their employees and their suppliers’ owners and employees spent their income from agritourism-related production. These are the induced effects of agritourism. In addition to the three types of effects concerning agritourism, we measured broader impacts on tourism within the Willamette Valley economy that are brought about by agritourism farms in the region. These broader community impacts resulting from agritourism are likewise decomposed into direct, indirect and induced effects.
Local consumers and visitors generate economic activity through agritourism-related spending and re-spending. However, spending by local consumers may occur with or without agritourism. If local consumer spending occurred without agritourism and agritourism sales declined, this would cause a short-term change to the economy but little long-term change. Spending by visitors, which we defined as those coming from more than 50 miles away, can provide a net gain to the economy that would not have occurred without agritourism. If that visitor spending disappeared, we would expect the economy to contract proportionately. The difference between short- and long-term changes is based on economic base theory, which stresses that the economic growth of an economy is dependent on exporting goods and services. This is why businesses and communities strive to increase their sale of exports. Sales to visitors from more than 50 miles away can be considered an export. However, import substitution blurs these distinctions. To a large degree, agritourism spurs local consumers to purchase food that is produced locally, rather than imported food, which prevents leakages from the local economy and avoids long-term economic contraction.
Table 7 provides a snapshot of the agritourism industry using data from 2017 to 2021 and adjusted to 2023 dollars. Agritourism is grouped into five categories that show the number of farms/producers and the number of visitors to the different types of farms. We consulted local stakeholders to inform the Christmas tree farm and nursery estimates. Overall, agritourism sites experience roughly 13.7 million visits per year. Local consumers within 50 miles of the farm site represent two-thirds of these visits. The remaining visitors comprise day visitors (19%) and overnight visitors (15%) from more than 50 miles away.
| Number of farms | Average number of visitors | Total visits per year using adjusted mean | Number of local visits per year | Percentage of local visits per year | Average number of day visitors per year from more than 50 miles away | Percentage of day visitors per year from more than 50 miles away | Number of overnight visitors per year from more than 50 miles away | Percentage of overnight visitors per year from more than 50 miles away | |
|---|---|---|---|---|---|---|---|---|---|
| Farms selling food direct to consumers | 3,411 | 3,709 | 12,651,399 or 2,728,800 (if median had been used) | 8,476,437 | 67% | 2,277,252 | 18% | 1,897,710 | 15% |
| Nurseries selling direct to consumers | 229 | 3,750 | 858,750 | 541,013 | 63% | 231,863 | 27% | 85,875 | 10% |
| Christmas tree farms selling direct to consumers | 120 | 600 | 72,000 | 61,200 | 85% | 7,200 | 10% | 3,600 | 5% |
| Farms providing private events and festivals | 20 | 1,500 | 30,000 | 21,300 | 71% | 5,100 | 17% | 3,600 | 12% |
| Farms providing lodging and/or farm dinners | 253 | 161 | 40,733 | 8,147 | 20% | 10,183 | 25% | 22,403 | 55% |
| Total Willamette agritourism farms | 4,033 | 13,652,882 | 9,108,096 | 66% | 2,531,598 | 19% | 2,013,188 | 15% | |
| Total farms in Willamette Valley | 18,679 | ||||||||
| Percentage of agritourism farms of total Willamette Valley farms | 22% |
One of the frequent reasons producers stated in our survey for doing agritourism was their desire to educate people about farming. For context, we estimate that there are roughly 13.7 million agritourism trips per year, including repeat visitors. Another prominent way that many people who live in urban areas learn about farming is through county and state fairs. In 2022, 346,000 people attended the Oregon State Fair, including repeat attendees.23
As shown in Table 7, an overwhelming majority of agritourism is attributable to direct sales of farm goods to consumers, as this accounts for over 90% of both total visitors and agritourism farms. Unsurprisingly, most lodging and farm dinners come from overnight visitors outside the region. For the other categories, local consumers are responsible for the majority of visits, particularly for Christmas tree purchases. The highest relative share of day visitors falls in the direct nursery sales category.
Economic effects of agritourism sales
Table 8 shows those direct effects by type of product or service and primary source of data for the various types of agritourism farms. In total, the direct effects of agritourism amount to annual sales of roughly $353 million. Approximately half of the direct impacts come from nursery direct sales. Direct-to-consumer value-added products and food products also account for significant shares of total sales, at 25% and 15%, respectively.
To explore a more complete picture of Oregon agritourism and not skew overall results, we excluded wine sold at vineyards directly to consumers from Table 8. A report published in 2021, which has some useful regional and marketing channel proportions, estimated vineyard sales of wine at 47% or $74,025,550 of the study area’s total processed or value-added.24 We used $82,688,450 for nonwine value-added sales. We adjusted that amount to 2023 dollars, or $87,088,081, as shown in Table 8.
| Product or service | Primary source of data | Direct sales - 2023 dollars |
|---|---|---|
| Direct to consumer sales (DTC) food products | 2017 census of agriculture | $54,632,979 |
| Value-added food products | 2017 census of agriculture with wine removed | $87,088,081 |
| DTC Christmas trees | Judgment | $3,677,032 |
| DTC nursery | Surveys | $176,924,443 |
| Recreation and tours | 2017 census of agriculture | $6,495,347 |
| Farms providing only private events and festivals with over 100K events removed | Surveys | $1,837,500 |
| Farms with only on-farm lodging and/or farm dinners | Surveys | $22,166,697 |
| Total | $352,822,079 | |
Table 9 provides a summary of the cascading economic effects of the $353 million in agritourism-related sales. Total Willamette Valley Farms was calculated by using IMPLAN’s estimate of crop and animal production for 2021 adjusted to 2023 dollars, which is $3,259,518,663. We ran those sales through the model and added together all the direct, indirect and induced effects for each category: Sales, Value-added and Employment. In addition to the sales effects, we showed the value-added effects of agritourism, which are essentially the gross domestic product of agritourism and those “driven” by agritourism through the indirect and induced effects.
| Type of effect | Sales | Value-added | Employment |
|---|---|---|---|
| Direct | $352,822,078 | $202,651,008 | 6,984 |
| Indirect | $133,179,500 | $72,363,691 | 789 |
| Induced | $227,058,117 | $136,235,103 | 1,243 |
| Total Willamette Valley agritourism farms | $713,059,695 | $411,249,802 | 9,016 |
| Multiplier | 2.02 | 2.03 | 1.29 |
| Total Willamette Valley farms | $5,976,579,887 | $3,062,941,282 | 48,701 |
| Percentage agritourism farms | 12% | 13% | 19% |
As a reminder, job estimates from IMPLAN included total full- and part-time jobs. Also based on our judgment and 105 survey responses, which averaged eight extra employees being hired by agritourism farmers for agritourism activities, we increased IMPLAN’s job estimates by 16 jobs at $8,750 per job per million dollars of sales for direct-to-consumer sales of unprocessed and value-added food; 16 jobs at $4,375 per job per million dollars of sales for Christmas tree and event sales; and 8 jobs at $8,750 per job per million dollars of sales for greenhouse, recreation and on-farm lodging sales. To run the impacts of these additional part-time jobs, we used IMPLAN’s $30,000 – 40,000 income range and Bureau of Labor Statistics estimates of annual farmworker salary.25 IMPLAN’s estimates are for all marketing channels ranging from wholesale to agritourism, with agritourism being more labor-intensive than all marketing channels combined.
Sale prices of agritourism products and services or their direct effects include not only the effects directly attributable to the agritourism producer but also include the inputs that the producer purchases from suppliers, such as fuel, fertilizer, etc. The local purchases of these inputs are included in the indirect effects as well. Sales dollars always include some “double counting,” and if all sales in an economy were added together, they would represent a much larger productive capacity than exists. We included sales dollars or direct effects to remain consistent with other analyses and others’ descriptive estimates of economic activity.
Value-added removes those outside inputs and tabulates the additional value created only by the agritourism producer, which is primarily provided by the farmers’ labor, soil, equipment and facilities, and only the production of businesses in the indirect and induced effects that are related to agritourism.
The multipliers indicate that for every agritourism dollar from sales more than another dollar is generated from suppliers of products and services to the farmer and employees. The employment multiplier suggests that for every job in agritourism, another 0.29 jobs are necessary to support the farmworkers.
Economic impacts of agritourism: consumers from more than 50 miles away (day visitors)
About one-third of agritourism’s customers come from more than 50 miles away, both for the day and overnight (Table 7). These customers could have come from outside or within the study area. The surveys asked the farmers to estimate the percentage of their customers who were not local as defined by coming from more than 50 miles away. Measuring nonlocal agritourism impacts can help align visitors’ reasons for traveling to the region with their interest in purchasing agritourism products or services. While we did not collect information for our study area that attributed agritourism to visitors’ reasons for traveling, the previous study cited above in Newport, Oregon, for the Hatfield Marine Science Center asked visitors if their reasons for traveling were related to visiting the center. Most of the day visitors had planned several stops and attributed 40% of their reason for traveling to the place we studied. In those surveys, we also asked visitors about their expenditures during those visits. Table 10 shows the primary businesses from which we estimated agritourism visitors will purchase and the amount of sales attributed to their visits at agritourism farms based on that previous study.
| Product or service | Expenditures per person — 2023 dollars | Direct sales — 2023 dollars |
|---|---|---|
| Prepared meals | 28 | $28,353,898 |
| Food stores | 8 | $8,101,114 |
| Gas | 6 | $6,075,835 |
| Entertainment | 8 | $8,101,114 |
| Retail all types | 6 | $6,075,835 |
| Total | 56 | $56,707,795 |
In the surveys, producers estimated their visitors’ origins based on whether visitors were local or traveled more than 50 miles to the farm. This means that the visitors could be from within the study area, other parts of Oregon or outside Oregon. Even if visitors from inside the study area originated more than 50 miles away from the farm, they likely made tourism types of expenditures, which distinguished them from local visitors who typically traveled from home to farm, made other local stops, and then returned home. By multiplying the product/service-specific per-person expenditures, day visitation counts, and attribution level (40%), we computed direct sales to day visitors as shown in Table 10, which was then fed into the IMPLAN model to generate the estimated economic impacts from day visitors (Table 11).
| Type of effect | Sales | Value-added | Employment |
|---|---|---|---|
| Direct | $56,707,796 | 33,216,250 | 588 |
| Indirect | $24,561,566 | 14,527,562 | 113 |
| Induced | $26,367,793 | 15,622,245 | 148 |
| Total Willamette Valley agritourism farms | $107,637,155 | 63,366,057 | 849 |
Economic impacts of agritourism: consumers from more than 50 miles away (overnight visitors)
Overnight visitors have an even greater economic impact per person, per visit than day visitors. This is because they stay longer and may purchase overnight accommodations. The expenditures per person, per visit in Table 12 are based on estimates from Dean Runyan Associates, a report from a consulting firm focused on travel and recreation, which was the most currently available data as we made our estimates using IMPLAN.26 We used an attribution level of 20% for overnight visitors because overnight visits are made primarily for agritourism and are less likely to occur than day visits. The 20% is based to a large degree on the HMSC study and our judgment. If that level seems low or high, the attribution level can be easily adjusted as mentioned above. Using a process similar to what was used to measure the day visitation impacts, the economic impacts of overnight visitors are shown in Table 13.
| Product or service | Expenditures per person — 2023 dollars | Direct sales — 2023 dollars |
|---|---|---|
| Accommodations | 43 | $17,313,417 |
| Prepared meals | 61 | $24,560,894 |
| Food stores | 22 | $8,858,027 |
| Gas | 30 | $12,079,128 |
| Entertainment | 33 | $13,287,041 |
| Retail all types | 28 | $11,273,853 |
| Total | 217 | $87,372,360 |
| Type of effect | Sales | Value-added | Employment |
|---|---|---|---|
| Direct | $87,372,360 | $52,303,899 | 873 |
| Indirect | $36,847,048 | $21,704,478 | 175 |
| Induced | $40,601,199 | $24,055,195 | 228 |
| Total Willamette Valley agritourism farms | $164,820,607 | $98,063,572 | 1,276 |
Comparing agritourism and other marketing channel farm sales
We used the 2017 Agricultural Census data to determine most of the direct effects/sales (which are only to the producer). If those direct effects in the top row of Table 9, which are $352,822,078, are divided by the total number of agritourism farms or 4,033, the average sales per farm related to agritourism is $87,484. On average, respondents in the surveys we conducted and discussed above, said they earn half of their gross revenues from agritourism. Doubling the agritourism sales estimates an agritourism farm’s average total sales to be $174,968. The agritourism employment is higher, yet the remaining portion of the agritourism farms’ employment remains at the level when other marketing channels are used, which is lower. For the agritourism half of the farm’s operations, employment is 3.51, and for the remaining portion, it is roughly 1.8 for a total of 5.31 full- or part-time jobs.
To compare farms with and without agritourism, we created a weighted average of total sales per farm from the 2017 Agricultural Census for the nine counties. Those numbers included the agritourism farms. However, half of the agritourism farms’ sales are not directly related to agritourism and agritourism farms represent only 22% of the total farms. So, the sales per farm for all farms in the Willamette Valley came directly from the 2017 Agricultural Census, which we adjusted by 10.6% using the IMPLAN inflation factor for crops to get from 2017 to 2023 dollars. The jobs estimate came from IMPLAN. Average per farm sales for all the Willamette Valley farms is $102,152 and average per farm employment is 3.6 full- or part-time jobs.
Using these rough calculations, agritourism farms have 70% higher sales and 48% higher employment than the average of all farms. These differences are likely to be driven by agritourism farms capturing a portion of the wholesale, processing (for the portion of agritourism farms that add value), and retail portion of the food dollar, which is approximately 35% or more than three times the farmgate price. Another consideration for these differences is that many of the small to mid-sized farms are not able to produce quantities that brokers or wholesalers will purchase for sale to processors or retailers. In those cases, agritourism becomes a critically important option.
Maintaining good relationships between agritourism farms and other rural landowners
While agritourism can provide many benefits to farmers and their communities, it can introduce more traffic, noise and other effects of increased economic activity. People have different views of what activities are appropriate for farm country. This has led to inconsistent policies, inequities and confusion as to what is allowable and acceptable for agritourism.
Oregon wineries have specific statutes that allow them to offer more on-farm activities than other types of farms. Both small and large wineries are allowed tours and tastings, luncheons and dinners, open houses, fee-based outdoor concerts, facility rentals, celebratory gatherings and charitable activities. As of 2019, on-farm cideries and breweries are treated similarly to wineries under Oregon law.
Most of these agritourism activities are prohibited on other types of farms or require a conditional use permit for different activities. It is not clear why this inequity among types of farms persists. Yet, recently when a bill (SB1087) was introduced in the 2023 Legislature to allow a pilot program for farm cafes in Lane County, the divergence of views of appropriate agritourism activities was apparent in the Senate Committee on Rules hearing on the bill.27 Opposition to the bill included themes of individuals wanting to retain valuable land use laws, to rank prepared food sales as subordinate to farm crops, to minimize the building and infrastructure on farmland that is not directly related to traditional farming, and to impact neighbors and other farming operations. Those in favor of the bill cited reasons, such as agritourism’s ability to help offset the rising input costs of farming, to help diversify revenue sources, and to help farmers make a living wage while trying to preserve the greater land use goal of preserving farmland.
Developing more consistent policies, which will require mediating the concerns of those in support and opposing further development of agritourism, will determine whether the economic footprint and impacts estimated above can be increased — and maybe even maintained. It can help to examine the experiences of destination tourism communities and urban areas with mitigating conflicts, such as the effects of increased congestion or neighbors whose land uses differ significantly. A collaborative effort is necessary to better understand what the agritourism activities are in the Willamette Valley and Oregon and to engage a wide range of stakeholders, both rural and urban, to develop the necessary compromises.
Agritourism can be important to the survival of farmers who want to diversify and keep their land in farming.28 However, neighbors should not be expected to pay a high price, in terms of quality of life, so that agritourism farms can survive.
Summary
This analysis indicates the potential value that agritourism may provide to the agritourism farmer and the communities of the Willamette Valley. Through the surveys we conducted, respondents overwhelmingly indicated agritourism was important to their financial viability and to their efforts to help people understand and appreciate the importance of farming.
An informal inventory estimated that approximately 22% of farms in the Willamette Valley produce one or more types of agritourism products and services. A market study gauging consumer demand would be needed to recommend opportunities for more farms to expand into agritourism or for existing farms to expand their agritourism products or services.
Based on our surveys, agritourism farmers may earn 50% of their gross revenues and 50% of their net revenues/profits from their agritourism production. With income derived from agritourism sales and other marketing channels, producers can diversify their income sources and risk as a protection against economic fluctuations.
When the agritourism farm production and the expenditures made by farm visitors are combined, the economic effects exceed $985 million in sales, $572 million in value-added/GDP, and 11,000 jobs. Although these effects are not a major portion of Oregon’s economy, they contribute significantly to the Willamette Valley economy and the economies of local communities.
Efforts beyond the farms involved would be needed to increase the economic contribution of agritourism, which can potentially enhance opportunities for people to better understand farming and rural lifestyles. Adding financial resilience to agritourism may help retain land in farming operations.
Appendix: An example of how agritourism may be expanded
Other states offer agritourism products and services that may not be allowed in Oregon. Often, the regulations in Oregon are so confusing and inconsistently applied among and within counties that many farmers are hesitant to consider adding agritourism products or services to their operations.
Oregon Revised Statutes define and provide guidance and some flexibility for agritourism activities: “What is consistent no matter where you are is that agritourism and other commercial events must be related to and supportive of agriculture. All the activities approved by these provisions must be ‘incidental and subordinate to existing farm use.’”29
Based on farmer interviews, one example of those agritourism activities is offering on-farm lodging. Often on-farm lodging does not just include lodging. It may include educational activities, such as farm tours, opportunities to interact with the livestock, and even in some cases help with livestock or crop management tasks. Some farms are currently offering on-farm lodging through online platforms like Vrbo or Airbnb. Those types of on-farm lodging are less likely to include additional experiential learning activities or support the price level of formal on-farm lodging.
If the policies for on-farm lodging, both at the state and county levels, were legalized and standardized to allow a season of up to 100 rented days per year for a small number of rental units or even just one unit, a number of current agritourism farms would likely add on-farm lodging to their offerings. Farms not active in agritourism may find on-farm lodging a good way to diversify into agritourism. The season would extend beyond 100 days because it would include a day between rented days for cleaning.
Again, the on-farm lodging must be supportive of agriculture, and incidental and subordinate to the existing farm use. The on-farm lodging option cannot be used as a method to site large lodges or essentially motels on EFU land.
The average price per night of on-farm lodging is approximately $250. Using just one unit as an example, a season could create an additional $25,000 (100 nights x $250) in revenue for the farm. Using IMPLAN’s Other Accommodations sector in the detailed IMPLAN model, two-thirds of the $25,000 — or $16,500 — would go to the farmer and employees. Since the farmer often takes care of the on-farm lodging unit(s), we do not have a good way to allocate that $16,500 between the farmer and employees. 24%, or $6,000, would go to supplies or intermediate inputs. From our surveys, we would expect a major portion of that $6,000 would be spent locally. The remaining 10% would go to lodging taxes and other property income not directly related to the on-farm lodging.
Using the average sales per agritourism farm of $174,968 from above, a single on-farm lodging unit can increase total sales for the average agritourism farm by 14%. For agritourism farms selling other products and services, guests staying will likely purchase some of those products and services, thereby boosting sales. In addition, we would expect that many of the on-farm lodging guests would come from more than 50 miles away and generate additional economic impacts to the farm and communities similar to those noted above for overnight visitors.
Allowing agritourism farm owners to rent one or a small number of units would limit the number of people staying at the farm and minimize disruption to neighbors.
Notes
- Van Sandt, Anders, Sarah A. Low, and Dawn Thilmany. 2018. “Exploring Regional Patterns of Agritourism in the U.S.: What’s Driving Clusters of Enterprises?” Cambridge University Press 47 (3): 592-609.
- Chase, Lisa C., Mary Stewart, Brian Schillig, Becky Smith and Michele Walk. 2018. “Agritourism: Toward a Conceptual Framework for Industry Analysis.” Journal of Agricultural Food Systems, and Commodity Development.
- Economic Forensics and Analytics, Inc. 2021. “The Economic Impact of the Wine and Wine Grape Industries on the Oregon Economy 2019 and 2020 Estimated.” (January), 1-31.
- Ross, Rachel. 2017. “Who Invented the Refrigerator.” LiveScience.
- Stewart, M., A. Comerford, B. Sorte, S. Angima, L. Chase, W. Wang, R. Bartlett, D. Conner, C. Hollas, C. Brittain, L. Quella., 2021. “Increasing Farm Viability Through Agritourism and On-Farm Direct Sales: An Oregon Producer Survey.” OSU Extension Service.
- Giri, Anil K., Dipak Subedi, Jessica E. Todd, Carrie Litkowski, and Christine Whitt. “Off-Farm Income a Major Component of Total Income for Most Farm Households in 2019.” Amber Waves, 2021.
- Scale economies refer to the idea that the cost per unit of production declines as the size (or scale) of the farm increases. For example, consider a row-crop farm operation. As the acreage of the farm increases, some costs, such as the fixed cost of machinery loan payments, become smaller on a per-acre basis.
- MacDonald, James M, Robert A. Hoppe, and Doris Newton. “Three Decades of Consolidation in U.S. Agriculture.” U.S. Department of Agriculture, Economic Research Service, 2018.
- MacDonald, James M. “Tracking the Consolidation of U.S. Agriculture.” Applied Economic Perspectives and Policy 42, no. 3 (2020): 361–79.
- Lacy, Katherine, Peter F. Orazem, and Skyler Schneekloth. “Measuring the American Farm Size Distribution.” American Journal of Agricultural Economics 105, No. 1 ( 2023): 219–42.
- Drawing direct historical comparisons with total farm/farmland is problematic because of statistical changes to the Census of Agriculture methodology over time. This is particularly true for smaller farms, hence our focus on changes in acreage for farms of at least 100 acres. See MacDonald (2020) for more information on the issues with comparisons of the Census data over long periods.
- Khanal, Aditya R. and Ashok K. Mishra. 2014. “Agritourism and off-farm work: survival strategies for small farms.” Agricultural Economics, 45: 65-76.
- Bigelow, Daniel. “Oregon Develops Far Less Forest and Agricultural Land than Its Neighbors.” OSU Applied Economics Outreach Blog (blog), 2023.
- Abbott, Carl. “Senate Bill 100.” Oregon Encyclopedia, 2022.
- 1000 Friends of Oregon. 2020. “Death By 1000 Cuts: A 10-Point Plan to Protect Oregon’s Farmland.” (June), 1-48.
- 2017 Census of Agriculture, Introduction VII.
- 1974 Census of Agriculture - Oregon; State and County Data p. A-8.
- 1978 Census of Agriculture - Oregon: State and County Data, p. D-4.
- 2007 Census of Agriculture - Oregon; State and County Data, p. B-43.
- Crompton, John. “Uses and Abuses of IMPLAN in Economic Impact Studies of Tourism Events and Facilities in the United States: A Perspective Article.” Tourism Review 75, no. 1 (2020): 187–90.
- Stewart, M., A. Comerford, B. Sorte, S. Angima, L. Chase, W. Wang, R. Bartlett, D. Conner, C. Hollas, C. Brittain, L. Quella., 2021. “Increasing Farm Viability Through Agritourism and On-Farm Direct Sales: An Oregon Producer Survey.” OSU Extension Service.
- Sorte, Bruce 2018. Economic Linkages and Impact Analysis for the Oregon Sea Grant-Operated Visitor Center at the Hatfield Marine Science Center. Oregon Sea Grant.
- Oregon State Fair attendance and revenues rebound from the pandemic. Oct. 31, 2022. Oregon Public Broadcasting.
- Economic Forensics and Analytics, Inc. 2021. “The Economic Impact of the Wine and Wine Grape Industries on the Oregon Economy 2019 and 2020 Estimated.” (January), 1-31.
- Bureau of Labor Statistics, U.S. Department of Labor, Occupational Outlook Handbook, Agricultural Workers, (visited October 03, 2023).
- “The Economic Impact of Travel in Oregon 2021p (Preliminary) Travel Oregon.” May 6, 2022. Primary research conducted by Dean Runyan Associates 811 SW 11th Ave., Suite 920, Portland, Oregon 97205.
- Submitted written public testimony, Oregon Senate Committee on Rules, April 6, 2023.
- Van Sandt, Anders, Sarah A. Low, and Dawn Thilmany. 2018. “Exploring Regional Patterns of Agritourism in the U.S.: What’s Driving Clusters of Enterprises?” Cambridge University Press 47 (3): 592-609. .
- Oregon Law: Agritourism, Commercial Events or Activities


