- >
- Cost of living>
- Cost of living statistics>
- UK cost of living statistics 2022
UK cost of living statistics 2024

This page includes UK cost of living statistics for 2024, such as changes to average household spending in the UK, the impact of rising inflation on energy bills, council tax, and more.
Statistics surrounding the cost of living in the UK are inescapable. Given that energy bills, food prices and other associated expenditures are already high, and expected to rise further, it’s perhaps not surprising that more and more people are seeking help with the UK cost of living crisis.
Money.co.uk gathered the most recent UK cost of living statistics for 2024, to see how the rising cost of living will impact people, households, and businesses today and in years to come.
Top 10 UK cost of living statistics
Total household expenditure for the third quarter of 2023 stood at nearly £399 billion
Combined domestic spending for the first three quarters of 2023 was nearly £1.2 trillion
As of February 2024, the BoE base rate sits at 5.25% for the sixth consecutive month
As of December 2023, UK inflation stands at 4.2% – more than double the BoE target of 2%
The largest upward contribution to the monthly change in both CPIH and CPI annual rates came from alcohol and tobacco while the largest downward contribution came from food and non-alcoholic beverages.
Total household electricity spending in England and Wales was around £1.3 billion less in 2023 compared to 2022
Annual UK rental price growth stood at +9.7% in December 2023
The average UK adult has approximately £4,123 of unsecured personal debt
According to the Student Money Survey 2022, the average UK living costs for students rose 14% within the previous 12 months, with the average student spending £924 a month
In terms of UK retirement statistics, for a typical UK retiree to have a minimum standard of living once they give up work, they need to be earning at least £12,800 a year
UK household spending statistics
The latest average household spending statistics show that, in December 2023, household spending was up 0.4% from November 2023, and 4.2% compared to December 2022.
A breakdown of total household spending statistics in the UK 2022-23, broken down by category
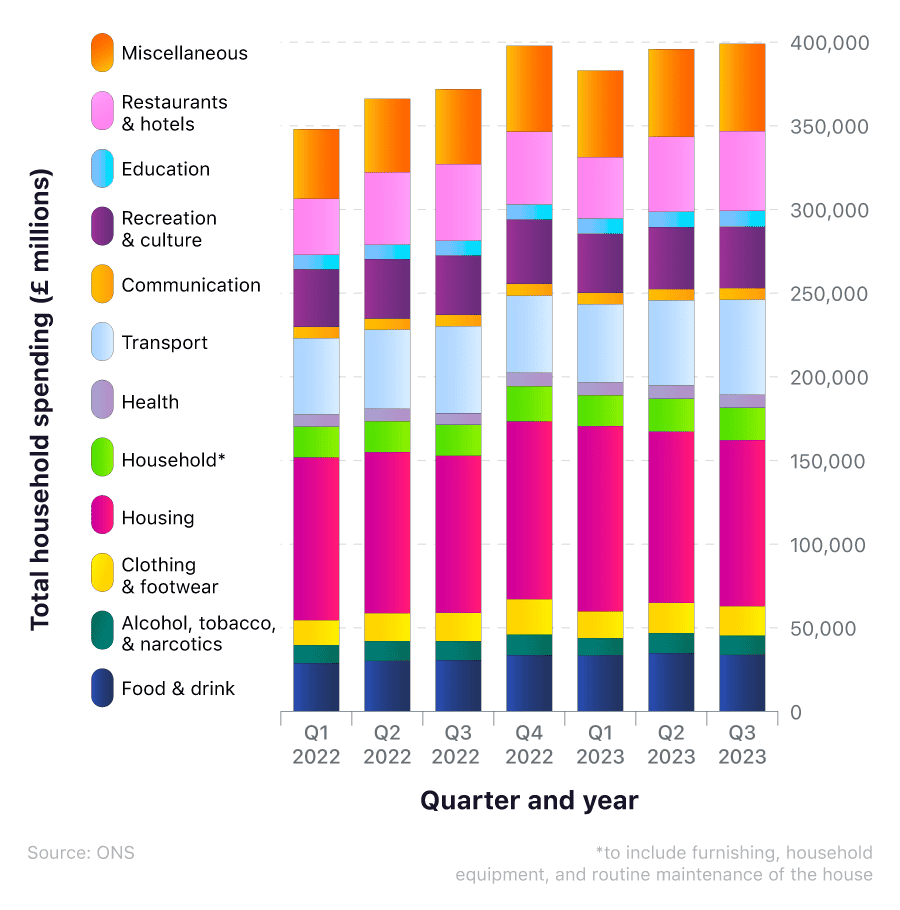
Total household expenditure for Q3 2023 stood at nearly £399 billion, with around £99 billion spent on housing (25%) and nearly £57 billion on transport (14%).
The data shows a rise in expenditure for every category between Q3 2022 and Q3 2023, with spending on housing increasing by 5.6% over this period.
Total domestic expenditure by UK households
According to UK cost of living stats, total domestic expenditure by UK households was close to £1.5 trillion by the end of 2022 – an increase of more than £160 billion from 2021. Total spending for the first three quarters of 2023 was nearly £1.2 trillion – around £90 billion more than the first three quarters of 2022.
A breakdown of total domestic expenditure by UK households

More than a quarter (27%) of spending in 2022 is attributed to housing, totalling in excess of £393.4 billion. This is followed by nearly £191 billion worth of household spending on transport, and just under £144 billion on recreation and culture. The smallest contributors to the total UK domestic expenditure for 2022 were health (approximately £29.9 billion) and communication (£27.3 billion).
Predicted increase in household expenditure for 2024 (exclusive data)
UK cost of living statistics indicate that those in London are likely to spend almost £411 a month more on living costs in 2024 compared to 2022, whereas residents in the North East are predicted to spend just over £291 a month extra.
However, in terms of percentage increase, the rising cost of household living expenses is expected to be roughly the same across the whole of the UK. All regions are expected to see rises between 18% and 19% in 2024 compared to 2022. The only exception is the South East, which falls just outside this margin (17.98%).
A breakdown of the expected weekly price increase of UK household expenditure in 2024 by region

| 2024 Price Increase (£) | Food & non-alcoholic drinks | Alcoholic drinks, tobacco & narcotics | Clothing & footwear | Housing, fuel & power | Household goods & services | Health | Transport | Communication | Recreation & culture | Education | Restaurants & hotels | Miscellaneous goods & services | Total across all expenditure groups |
|---|---|---|---|---|---|---|---|---|---|---|---|---|---|
| North East | 18.98 | 2.46 | 2.37 | 11.45 | 5.9 | 0.82 | 6.63 | 2.12 | 7.11 | 0.04 | 6.95 | 3.13 | 67.97 |
| North West | 21.2 | 2.91 | 2.98 | 13.69 | 5.85 | 1.06 | 7.76 | 2.39 | 9.57 | 0.28 | 8.5 | 4.39 | 80.57 |
| Yorkshire & The Humber | 19.62 | 2.86 | 2.43 | 11.67 | 6.27 | 1.23 | 7.27 | 2.1 | 8.25 | 0.33 | 7.93 | 4.1 | 74.06 |
| East Midlands | 21.54 | 2.72 | 2.84 | 12.52 | 6.18 | 1.29 | 9.02 | 2.41 | 9.32 | 0.61 | 8.9 | 4.69 | 82.03 |
| West Midlands | 21.64 | 2.65 | 2.94 | 14.04 | 6.15 | 1.49 | 8.18 | 2.41 | 8.72 | 0.42 | 8.17 | 4.45 | 81.28 |
| East | 22.38 | 2.84 | 2.7 | 15.32 | 6.51 | 1.15 | 9.29 | 2.5 | 9.35 | 0.65 | 8.9 | 4.51 | 86.11 |
| London | 24.1 | 2.14 | 3.32 | 25.18 | 5.31 | 1.29 | 7.3 | 2.38 | 8.1 | 1.3 | 10.77 | 4.85 | 96.04 |
| South East | 24.13 | 2.97 | 2.9 | 16.33 | 7.19 | 1.69 | 9.44 | 2.53 | 11.44 | 1.45 | 9.94 | 5.15 | 95.18 |
| South West | 21.98 | 2.97 | 2.77 | 15.07 | 6.3 | 1.29 | 8.59 | 2.4 | 10.33 | 0.7 | 9.25 | 4.54 | 86.19 |
| Wales | 20.56 | 2.74 | 2.56 | 12.13 | 5.81 | 0.93 | 7.02 | 2.22 | 8.38 | 0.48 | 6.83 | 3.77 | 73.43 |
| Scotland | 20.26 | 3.03 | 2.84 | 12.75 | 5.71 | 0.86 | 7.8 | 2.27 | 8.02 | 0.27 | 7.73 | 3.89 | 75.41 |
| Northern Ireland | 24.84 | 3.06 | 3.7 | 10.24 | 6.18 | 1.43 | 7.72 | 2.38 | 7 | 0.33 | 8.75 | 4.39 | 80.02 |
Source: ONS
Those living in London and the South East have seen the biggest monetary increase in their weekly household living costs, at just over £96.04 and £95.18, respectively. Transport costs in the South East have increased by more than £9.40 per week, followed by rises of just under £9.30 a week for the East of England and just over £9 for the East Midlands.
London, the South East, and Northern Ireland have all seen the weekly cost of food and non-alcoholic drinks rise by at least £24. Meanwhile, housing, fuel and power costs in London increased the most, rising by more than £25 a week on average.
If you already have debts, you could consider a 0% Balance Transfer credit card to help reduce your interest payments.
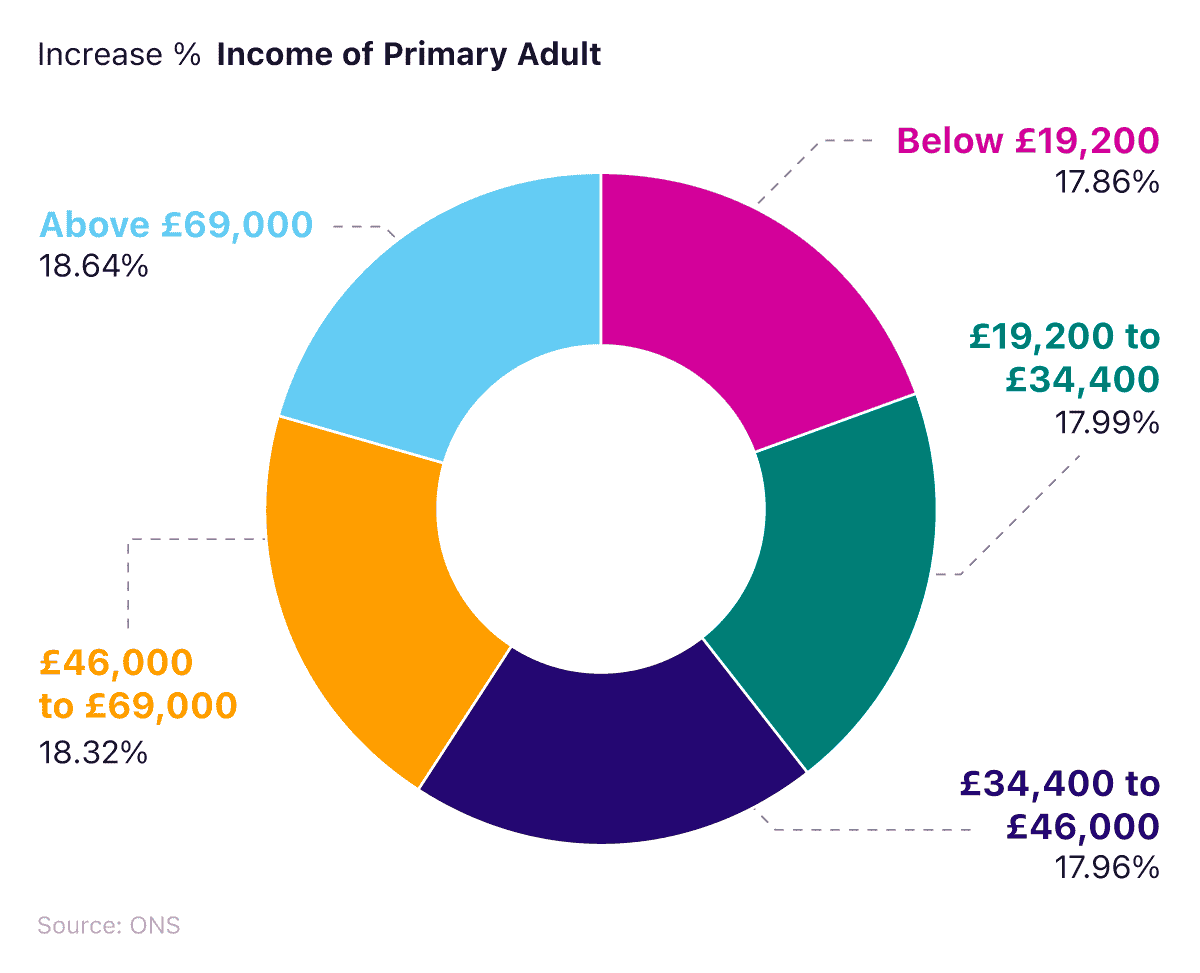
A breakdown of the expected price increases of UK household weekly expenditure by income bracket in 2024
| Income bracket | Food & non-alcoholic drinks | Alcoholic drinks, tobacco & narcotics | Clothing & footwear | Housing, fuel & power | Household goods & services | Health | Transport | Communication | Recreation & culture | Education | Restaurants & hotels | Miscellaneous goods & services | Total across all expenditure groups |
|---|---|---|---|---|---|---|---|---|---|---|---|---|---|
| below £19,200 | 22.28 | 2.14 | 2.9 | 22.28 | 5.1 | 0.9 | 6.07 | 2.4 | 4.72 | N/A | 5.63 | 3.68 | 78.12 |
| £19,200 - £31,400 | 21.57 | 1.85 | 2.48 | 18.18 | 4.33 | 0.65 | 6.33 | 2.91 | 5.73 | N/A | 5.86 | 3.27 | 73.16 |
| £31,400 - £46,000 | 21.6 | 2.5 | 2.54 | 16.67 | 5.6 | 0.89 | 8.07 | 2.58 | 7.43 | 0.53 | 7.5 | 4.34 | 80.28 |
| £46,000 - £69,000 | 22.28 | 2.57 | 3.46 | 15.8 | 7.11 | 1.15 | 11 | 2.78 | 10.56 | 0.51 | 11.04 | 5.04 | 93.3 |
| Above £69,000 | 25.31 | 3.33 | 4.34 | 19.39 | 8.85 | 2.25 | 15.15 | 2.86 | 14.29 | 1.38 | 16.55 | 6.44 | 120.15 |
Source: ONS
When broken down by income, UK residents earning more than £69,000 a year can expect to see their monthly household expenses increase by around £120 in 2024. Conversely, those earning less than £19,200 a year could see a rise of around £78 a week.
As a percentage increase, all income groups are estimated to see proportionally increased monthly living costs of between 17.9% and 18.6%. Those earning more than £69,000 are predicted to experience increased monthly living costs of just under 18.6% – the highest of all income groups.
According to the UK cost of living stats, those earning between £19,200 and £31,400 a year are expected to have a rise of more than £73 a week in living expenses, with close to £22 a week extra being spent on food and drink and over £18 on housing, fuel and power.
For those earning between £31,400 and £46,000 a year, the biggest proportional change in their weekly spending is also predicted to come from food and housing (just under £22 and £17 extra, respectively.)
This is followed by transport, which may mean paying an extra £8.07 a week for the middle-income earners, and £6.07 a week for those earning £19,200 or less.
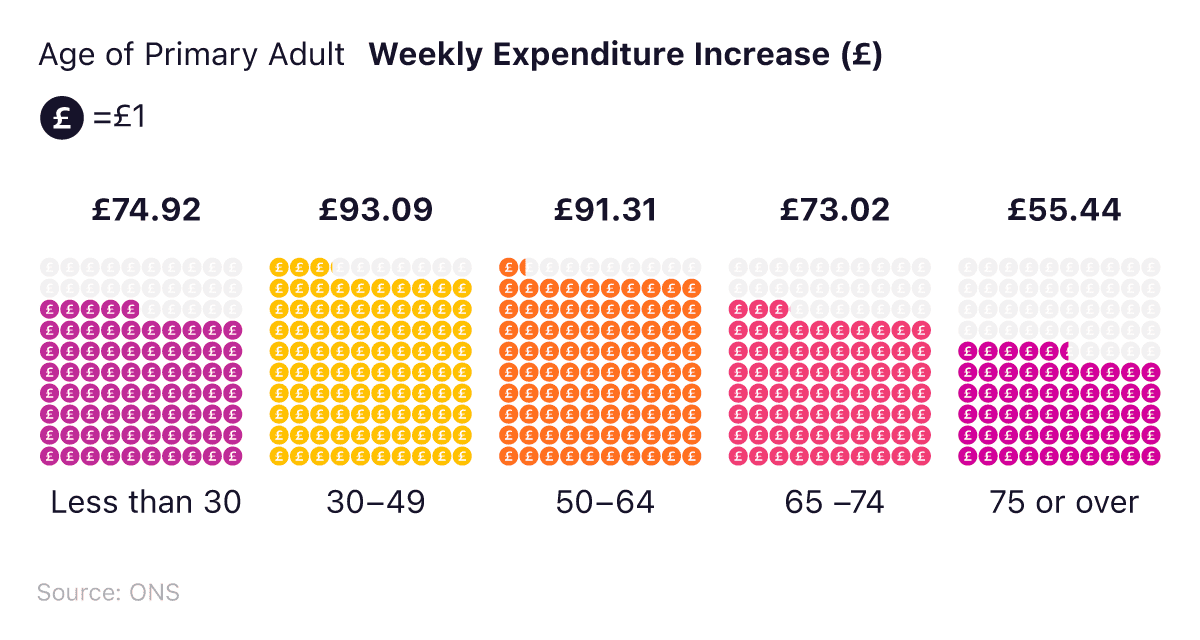
A breakdown of the expected price increases for UK household expenditure in 2024 by age group
| Age of primary adult | Total weekly expenditure up to 2022 (£) | Estimated total weekly expenditure 2024 (£) | Weekly expenditure increase (£) | Monthly expenditure increase (£) | Increase % |
|---|---|---|---|---|---|
| Less than 30 | 419.6 | 494.52 | 74.92 | 321.09 | 17.86 |
| 30 - 49 | 517.5 | 610.59 | 93.09 | 398.96 | 17.99 |
| 50 - 64 | 508.3 | 599.61 | 91.31 | 391.33 | 17.96 |
| 65 - 74 | 398.6 | 471.62 | 73.02 | 312.93 | 18.32 |
| 75 or over | 297.4 | 352.84 | 55.44 | 237.6 | 18.64 |
Source: ONS
When broken down by age, those aged 75 and over could be worst affected by the rising cost of living. The oldest age group could see a rise of 18.64% in their household living costs between 2022 and 2024 whereas, for all other age groups, this could be between 17.9% and 18.3%
UK cost of living stats indicate that, every week in 2024, those aged 30-49 are expected to spend just over £93 more on household costs in 2024 than in 2022. By comparison, those aged 75 and over could see costs rise by over £55 a week.
A breakdown of the expected weekly price increases for UK household expenditure in 2024 by age group and expense category
| Age group | Food & non-alcoholic drinks | Alcoholic drinks, tobacco & narcotics | Clothing & footwear | Housing, fuel & power | Household goods & services | Health | Transport | Communication | Recreation & culture | Education | Restaurants & hotels | Miscellaneous goods & services | Total across all expenditure groups |
|---|---|---|---|---|---|---|---|---|---|---|---|---|---|
| Less than 30 | 15 | 1.23 | 1.92 | 24.52 | 4.61 | 0.53 | 6.94 | 2.12 | 5.93 | 0.79 | 7.98 | 3.35 | 74.92 |
| 30 - 49 | 23.53 | 2.31 | 3.49 | 18.91 | 6.16 | 1.18 | 9.57 | 2.65 | 9.41 | 0.95 | 9.77 | 5.16 | 93.09 |
| 50 - 64 | 22.92 | 3.39 | 3.08 | 14.47 | 6.9 | 1.6 | 10.66 | 2.66 | 10.41 | 0.58 | 10.14 | 4.49 | 91.31 |
| 65 - 74 | 19.18 | 3.14 | 2.26 | 10.56 | 6.74 | 1.93 | 6.95 | 2.06 | 8.35 | 0.17 | 7.98 | 3.7 | 73.02 |
| 75 or over | 16.92 | 1.85 | 1.32 | 9.75 | 4.38 | 1.59 | 3.78 | 1.7 | 5.81 | N/A | 4.54 | 3.82 | 55.44 |
(Source: money.co.uk via ONS)
Those between 30 and 64 can expect to witness a rise of between £22 and £24 a week in their food and drink costs, and an increase of between £3 and £4 for clothing and footwear.
Interestingly, the older the age group, the smaller the rise in housing, fuel and power is expected to be. For those under 30 years, housing, fuel and power expenses may increase by an average of £24.52, compared to £9.75 a week for those aged 75 and over.
Looking to cut down on your petrol/diesel expenditure? Check out our guide on how to save money on fuel when driving your vehicle.
Food and non-alcoholic drinks make up another significant area for price increases in 2024, with increases ranging from as low as £15 for the under 30s to as high as £23.53 for those aged 30-49.
High inflation and rising interest rates - consumer goods and food prices
Since 2021, the UK's cost of living has steadily increased. Consumer prices, as measured by the Consumer Prices Index (CPI), were 4.2% higher in December 2023 than the previous year.
On the lips of many are questions about the cost of living—how will it impact them now and in the future? And which areas of life will be affected the most? Let’s start with food.
The price rises for food have accelerated, with the ONS estimating food price inflation to be at 8% as of December 2023. This figure marked the 29th consecutive month in which food prices have risen. These rises are lower than in early 2023, however, when food inflation reached 19.2% in March 2023 – the highest rate since 1977.
A breakdown of UK food price rises by food type between September 2021 and September 2022
| Item | Size (units) | Price in September 2021 (nearest pence) | Price in September 2022 (nearest pence) | September 2021 and September 2022 price change (%) |
|---|---|---|---|---|
| Vegetable oil | 1,000ml | 156 | 258 | 65.20% |
| Pasta | 500g | 38 | 61 | 59.90% |
| Tea | 125g | 67 | 97 | 46% |
| Chips | 1,500g | 99 | 137 | 38.70% |
| Bread | 800g | 48 | 66 | 37.60% |
| Biscuits | 400g | 40 | 54 | 34.40% |
| Mixed frozen vegetables | 1,000g | 76 | 100 | 31.90% |
| Milk | 4 pints | 117 | 152 | 29.40% |
| Crisps | 150g | 73 | 91 | 23.70% |
| Tomatoes | 250g | 48 | 57 | 19.30% |
| Instant coffee | 100g | 131 | 155 | 18.80% |
| Onions | 1,000g | 63 | 75 | 18% |
| Sausages | 454g | 89 | 105 | 18.30% |
| Apples | 6 pack | 83 | 97 | 17.20% |
| Baked beans | 400g | 30 | 34 | 16.20% |
| Potato | 2,500g | 94 | 106 | 13.20% |
| Fish Fingers | 250g | 76 | 87 | 13.10% |
| Tomato ketchup | 460g | 58 | 65 | 12.10% |
| Breakfast cereal | 500g | 69 | 76 | 10.60% |
| Cheese | 255g | 89 | 98 | 10.40% |
| Chicken breast | 600g | 330 | 363 | 10.10% |
| Ham | 200g | 160 | 176 | 9.90% |
| Bananas | 5 pack | 73 | 78 | 7% |
| Yoghurt | 500g | 55 | 58 | 6.60% |
| Fruit squash | 750ml | 48 | 51 | 6.70% |
| Pizza | 300g | 84 | 87 | 3.20% |
| Granulated sugar | 1,000g | 66 | 66 | 0.30% |
| Rice | 1,000g | 89 | 89 | -0.20% |
| Beef mince | 500g | 210 | 195 | -7.40% |
| Fruit juice orange | 1,000ml | 83 | 76 | -8.90% |
Source: ONS
Food budgets during a cost of living crisis are likely to take a hit, as producers are expected to pass any increase in production costs onto you (the consumer).
According to UK lifestyle cost of living statistics, between September 2021 and September 2022, there was a significant shift in the cost of consumer goods—the vast majority of which have seen prices rise.
In 12 months, the price of a 1 litre bottle of vegetable oil increased by over 65% – the highest increase of any UK food item. In September 2021, this would have set customers back £1.56 on average – by April 2022, this had risen to £2.58.
Pasta and tea saw price hikes of nearly 60% and 46%, respectively. Items which experienced rises of between 20%-40% include frozen vegetables, chips, bread, and milk.
Some items saw very little change in their costs, with rice and granulated sugar both experiencing price changes of less than 1%.
Of the 30 items monitored in the ONS survey, just three items decreased in value over the 12 months between September 2021 and September 2022. Orange fruit juice saw the greatest decline, falling by nearly 9%, followed by beef mince (-7.4%) and rice (-0.2%).
The continued rise in the food inflation rate since September 2022 suggests that the majority of items on the table would have incurred further price rises over the last year.
Ways to cut the cost of your weekly shop during the UK cost of living crisis
According to our weekly shop index, the UK ranked as the 22nd most expensive country in the world for food shopping in 2022, with the average food cost per week just shy of £14 per person. By contrast, the same food shop would have set you back more than £20 in the USA (seventh place), and almost £36 in Switzerland (first place).
At the other end of the scale, the same basket of food would have cost you just £6.66 in Turkey and £7.22 in Colombia—roughly half of what it did in the UK.
Predicted price changes to UK items 2023 (exclusive data)
To assess the extent of price changes to UK items in 2023, our exclusive study analysed ONS inflation statistics to calculate the percentage price increase for a range of UK products and services between January 2022-23. Using this data, a forecast was generated for potential price rises up until July 2023.
A breakdown of predicted price increases for different categories of household expenditure in 2023
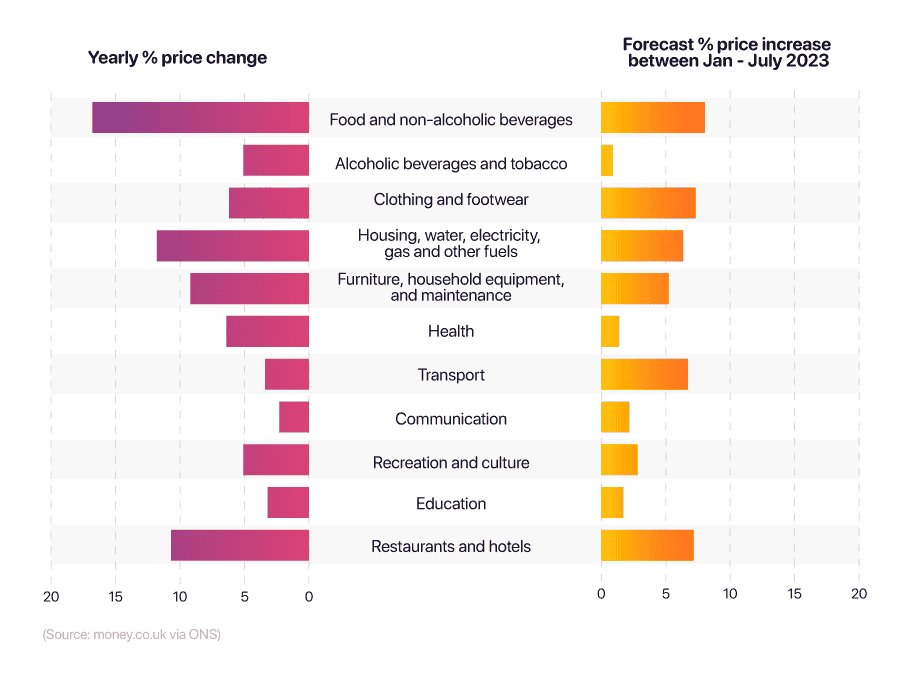
| Item | Yearly % price change | Forecast % price increase between Jan - July 2023 |
|---|---|---|
| Food and non-alcoholic beverages | 16.8 | 8.04 |
| Alcoholic beverages and tobacco | 5.1 | 0.89 |
| Clothing and footwear | 6.2 | 7.32 |
| Housing, water, electricity, gas and other fuels | 11.8 | 6.34 |
| Furniture, household equipment, and maintenance | 9.2 | 5.22 |
| Health | 6.4 | 1.38 |
| Transport | 3.4 | 6.72 |
| Communication | 2.3 | 2.17 |
| Recreation and culture | 5.1 | 2.82 |
| Education | 3.2 | 1.71 |
| Restaurants and hotels | 10.7 | 7.16 |
(Source: money.co.uk via ONS)
According to household expenditure statistics obtained from our exclusive study, all categories of spending were predicted to see a price rise between January and July 2023.
Food and non-alcoholic beverages were expected to see the biggest price rise, costing more than 8% more in July 2023 compared to January. This was followed by restaurant and hotel-related items (+7.16%), such as bed linen, soaps, and cleaning products.
Throughout 2022, food and non-alcoholic beverages saw the largest percentage price increase of all categories (+16.8%) followed by housing, water, electricity, gas and other fuels (+11.8%). However, the predicted future growth for the latter category was expected to be slightly less than that of transport (+6.34% and +6.72%, respectively) going into July 2023.
At the other end of the scale, alcoholic beverages and tobacco were predicted to experience minimal growth in their price, costing just 0.89% more in July 2023 compared to the start of the year. This was followed by health (+1.38%) and education (1.71%).
In terms of yearly percentage price change in 2022, communications had the smallest growth (2.3%), and this was forecast to remain low up until July 2023 (2.17%), although not as low as health or education costs.
A breakdown of highest predicted price increases for different items in 2023
| Item | Yearly % price change | Forecast % price change between Jan - July 2023 |
|---|---|---|
| Passenger transport by air | 18.5 | 59.39 |
| Natural gas and town gas | 132.86 | 35.69 |
| Gas | 129.35 | 35.24 |
| Electricity | 66.71 | 25.24 |
| Liquid fuels | 40.19 | 23.28 |
| Milk, low fat | 45.19 | 19.86 |
| Toll facilities and parking meters | 14.02 | 18.73 |
| Edible offal | 31.49 | 17.95 |
| Milk, whole | 37.14 | 17.27 |
| Diesel | 15.51 | 17.27 |
| Butter | 27.15 | 16.95 |
(Source: money.co.uk via ONS)
In terms of individual items, passenger transport by air was forecast to have the largest percentage price change in the first seven months of 2023, costing almost 60% more in July 2023 compared to six months earlier.
This was followed by natural and town gas and standard gas prices (both around +35%), electricity (+25.24%), and liquid fuels (+23.28%).
Between 2022 and 2023, gas prices saw extraordinary growth, an increase of somewhere between 129% and 133% in January 2023 compared to 12 months earlier. This was almost double the annual price hike rate experienced by electricity costs in the same period, and three times the recorded increase for liquid fuels and low-fat milk.
A breakdown of lowest predicted price increases for different items in 2023
| Item | Yearly % price change | Forecast % price change between Jan - July 2023 |
|---|---|---|
| Equipment for camping and open-air recreation | -1.13 | -7.29 |
| Software | -2.71 | -6.66 |
| Games and hobbies | 1.37 | -6.65 |
| Equipment for the reception, recording, and reproduction of sound and vision | -8.96 | -5.56 |
| Second-hand cars | -7.14 | -4.51 |
| Data processing equipment | -5.14 | -3.66 |
| Personal computers | -7.58 | -3.46 |
| Major items for games and sport | -6.48 | -2.29 |
| Binding services and e-book downloads | 34.32 | -2.29 |
| Coffee machines, tea makers, and similar appliances | -4.6 | -1.9 |
(Source: money.co.uk via ONS)
Throughout 2022, some items experienced a reduction in their price, with equipment for reception, recording, and reproduction of sound and vision seeing the largest drop in cost (almost -9%). The price of second-hand cars and personal computers both saw a decrease in excess of 7% in 2022, followed by major items for games and sports (-6.48%).
Heading into 2023, equipment for camping and open-air recreation was expected to cost almost 7.3% less in July compared to January. Games and hobbies, along with software, prices were also predicted to drop by around 6.6% in the same period.
High inflation and rising interest rates - oil prices
The latest UK cost of living crisis statistics show a sharp rise in oil prices between January and February 2022, when the war in Ukraine began. The peak oil price for February 2022 ($100.54) was recorded on 24 February – the day the war was officially announced.
A breakdown of oil prices per barrel in 2023-24
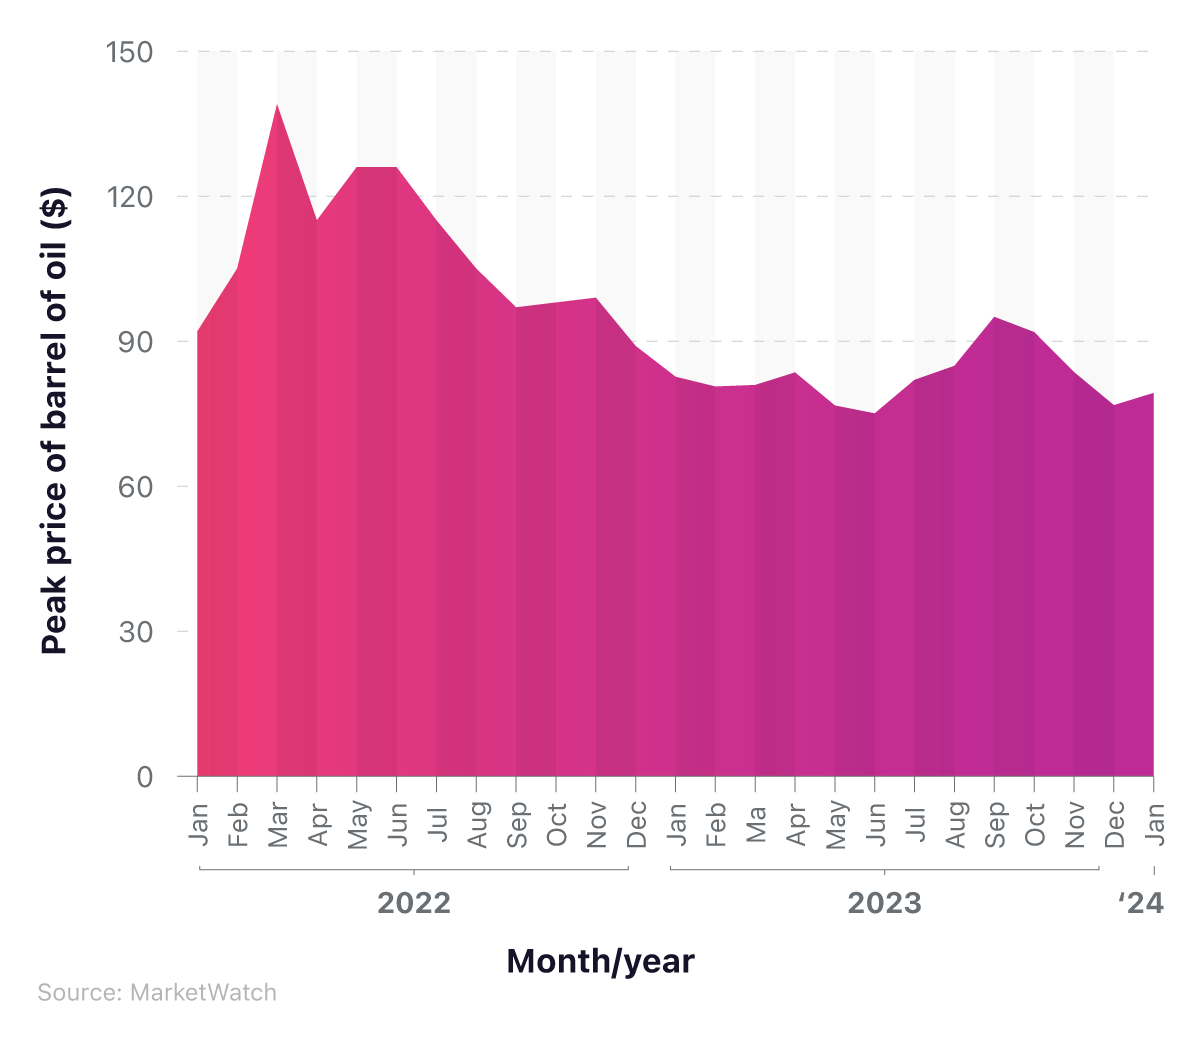
Oil prices peaked at $120.67 in June 2022, amid uncertainty surrounding the war, before falling in the subsequent months. By September 2022, the cost of oil began to approach pre-February 2022 levels (almost $97 per barrel) before declining steadily towards the start of 2023.
Prices fell as low as $67.51 in June 2023 before climbing to $95.03 by late September. Things decreased again toward the end of the year, dropping to $76.76 at the start of December.
As of January 2024, peak oil prices stood at £79.29 – around $9 lower than they were the month before Russia invaded Ukraine. The current state of the world economy may have been a factor in these patterns, with oil prices typically plummeting at times of recession and economic hardship due to a decrease in demand.
Read our guide for tips on saving money on fuel during the cost of living.
UK energy bill statistics
The running costs and energy bills for flats are generally lower compared to houses, especially newly built rented properties with higher efficiency ratings.
UK cost of living statistics indicate that the amount of gas it takes to heat and run a purpose-built flat over 12 months is 40% lower than a converted flat. A one-bedroom home requires less than 50% of the gas needed to heat a three-bedroom house, while D and E energy rated properties require 25% and 48% more gas, respectively, compared to a C-rated home.
Average cost of UK energy bills
The Consumer Price Index (CPI) for all domestic fuels decreased by 2.8% in Q3 2023, compared to Q3 2022. Average domestic energy bills for 2023 were estimated to be £2,592, a 13% (£298) increase on the previous year. The average UK electricity bill was also predicted to increase by 9% to £1,264 over this period, with gas bills incurring a 17% rise from £1,134 to £1,328.
An estimated 557,000 electricity customers and 310,000 gas customers transferred between providers during Q3 2022, representing quarter-on-quarter increases of 41% and 35%, respectively.
Prices in the manufacturing industry for electricity and gas have begun to decrease. The average price (excluding Climate Change Levy) for electricity between July and September 2023 was 18.8 pence per kWh, a 4.7% fall from Q3 2022. At the same time, gas was 4.6 pence per kWh – a decrease of 7.5% over the same period.
Road fuel prices in mid-December 2023 remained lower than at the end of 2022. The mid-month average retail price of unleaded petrol in December 2023 was 142.31p per litre. This was 2.2% lower than in mid-December 2022, when the average cost of unleaded stood at £145.61, and just over quarter (26%) lower than the peak prices at the start of July 2022.
The average retail diesel price was 150.19p per litre in mid-December 2023 – a 15% decrease from the same period a year before and a quarter (25%) drop from mid-July 2022.
Average UK electricity bill costs
According to UK cost of living stats, energy spending has decreased year-on-year (YoY) since 2019, from almost £55.3 billion, to just under £52.9 billion in 2022. Gas spending fell by more than 14% between 2021 and 2022, from £10.7 billion to just under £9.2 billion.
A breakdown of the total expenditure for different types of energy by UK households from 2020-2022
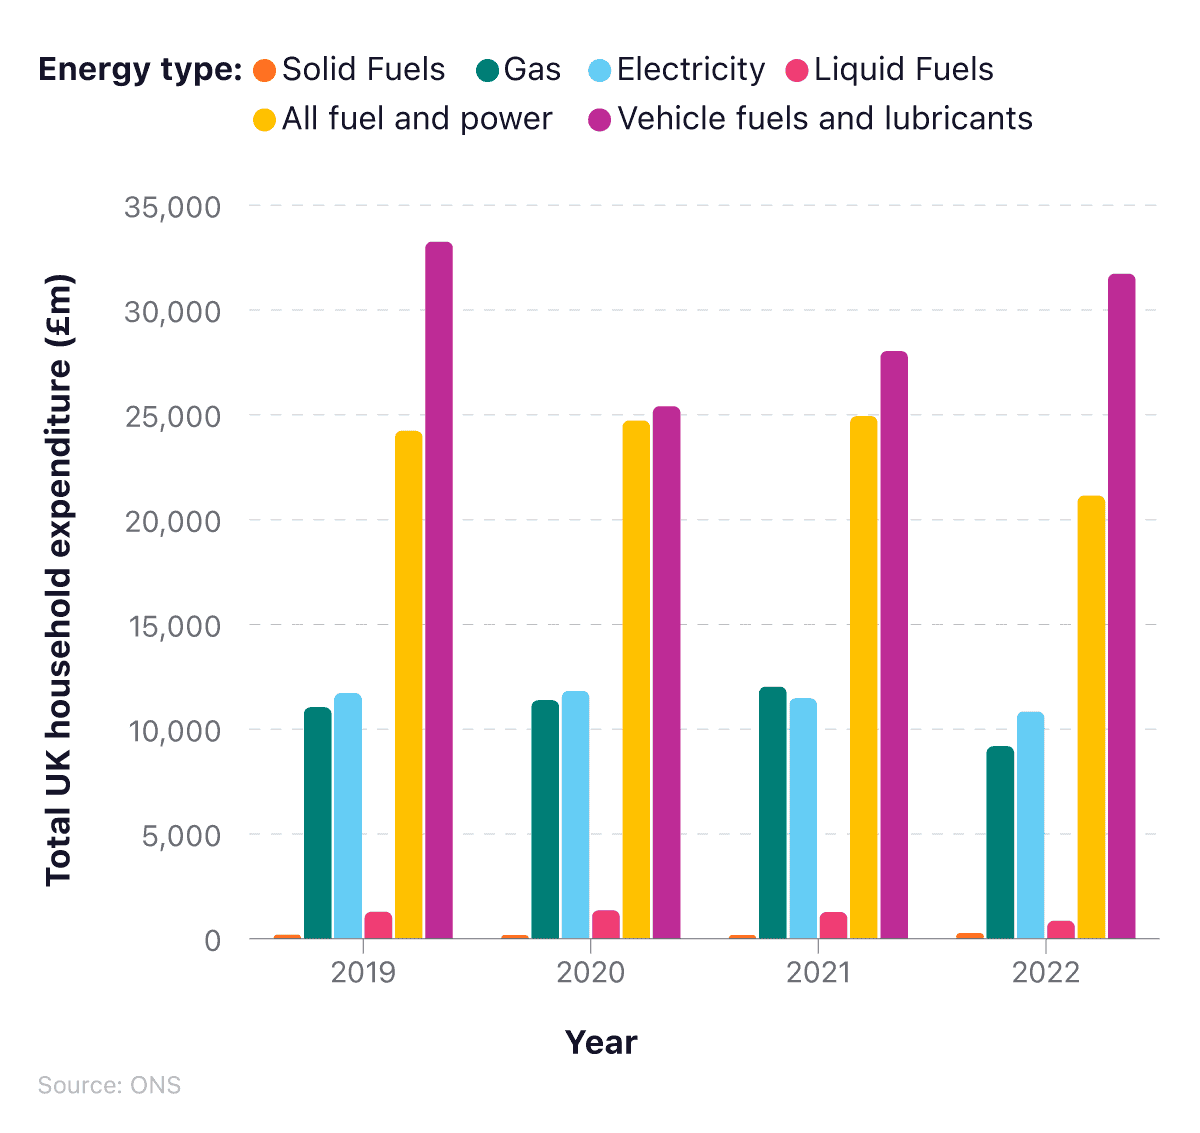
Electricity spending fell in 2022 by about £1.3 billion (-11%) compared to 2021, while vehicle fuels and lubricants increased to around £31.7 billion — nearly £4 billion more than in 2021.
Average cost of UK electricity bills
The latest statistics on the average cost of UK electricity bills found that, in 2023, the average electricity bill was expected to be £1,264. This represents a rise of around 9% (£104) from 2022. Those on standard credit were paying around 4.5% more than direct debit customers and prepayment consumers.
A breakdown of the average cost of UK electricity bills by year (2021-23)
| Year | Standard credit: All consumers (pounds) | Direct debit: All consumers (pounds) | Prepayment: All consumers (pounds) | Overall: UK (pounds) |
|---|---|---|---|---|
| 2021 | 821 | 754 | 779 | 769 |
| 2022 | 1,226 | 1,151 | 1,122 | 1,160 |
| 2023 | 1,311 | 1,254 | 1,255 | 1,264 |
Source: ONS
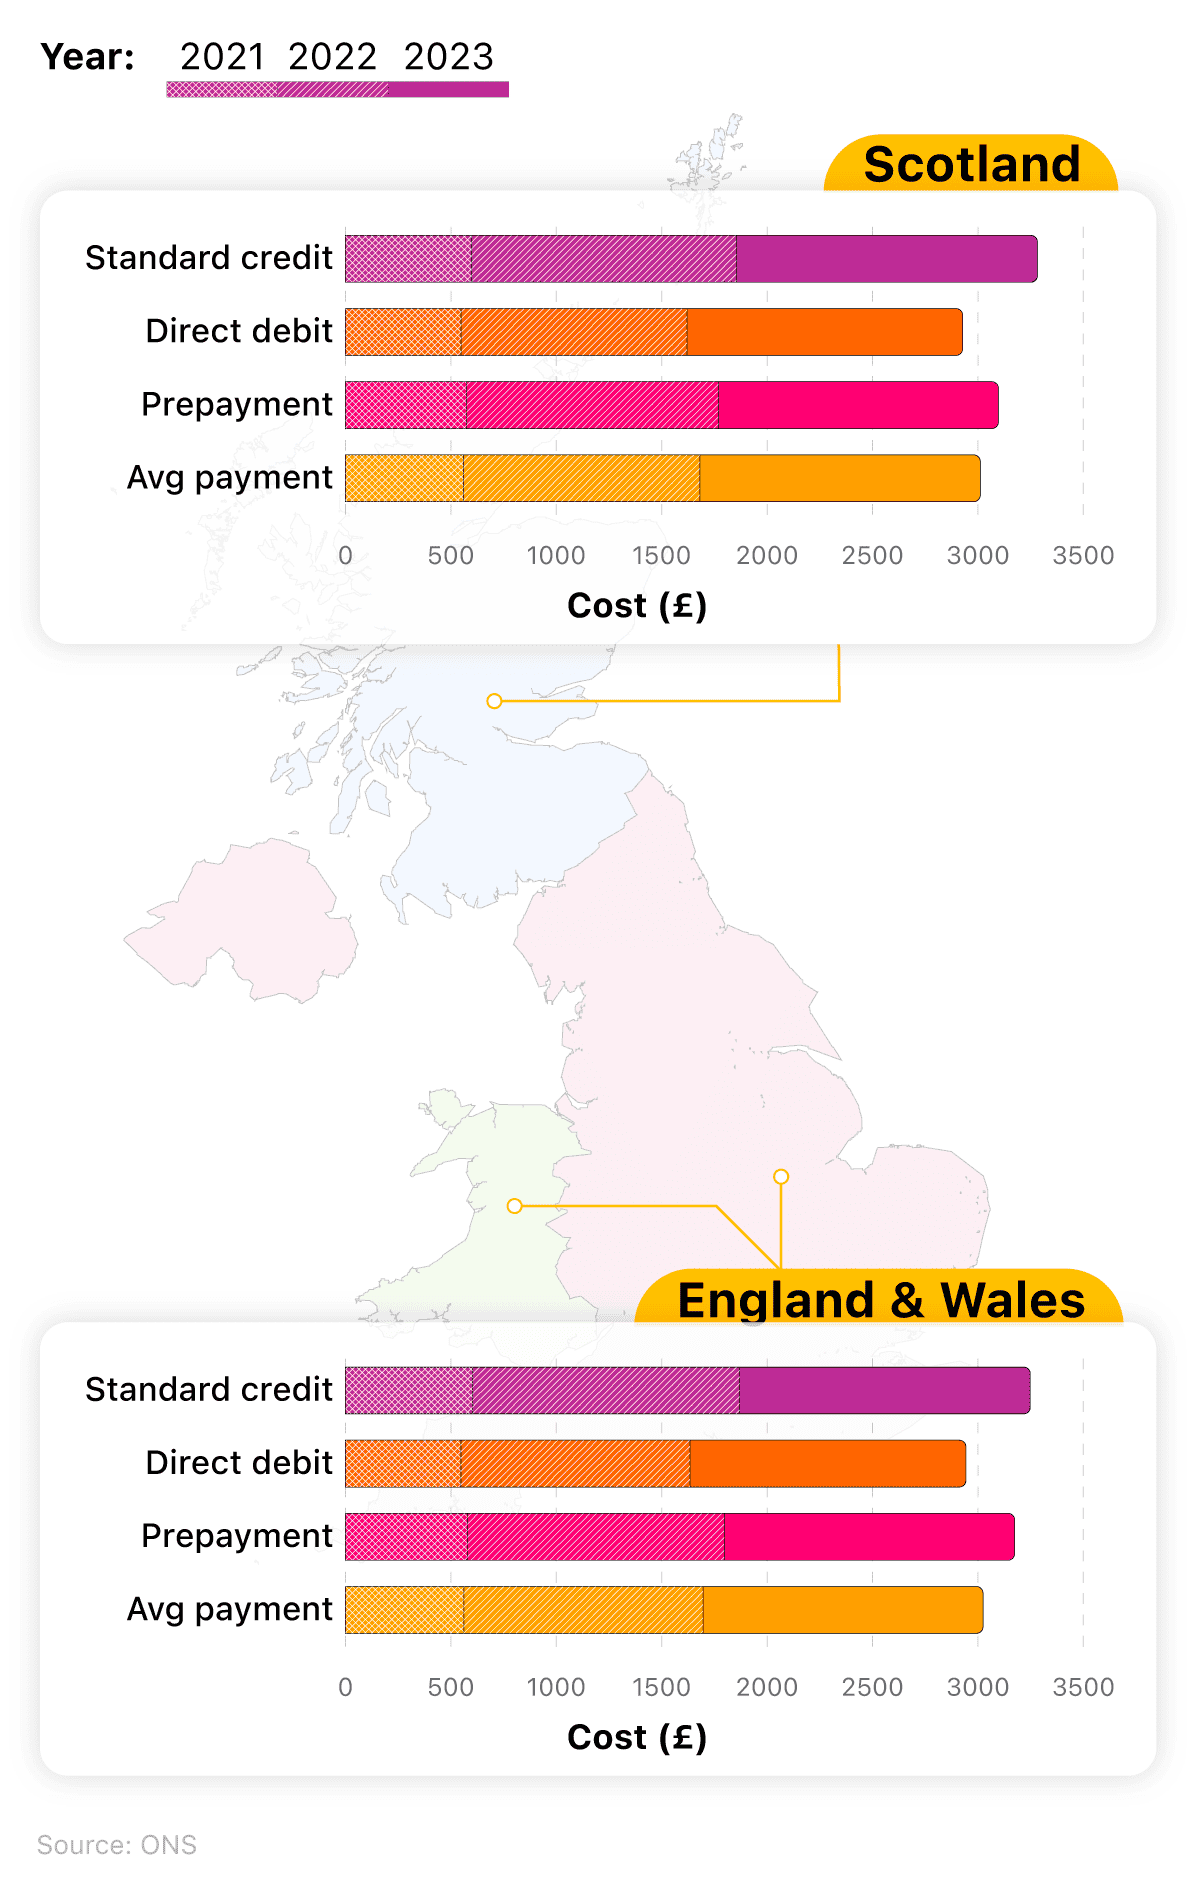
All three methods of payment rose hugely between 2021 and 2023, with standard credit consumers increasing by around three-fifths (60%), compared to around two-thirds (66%) for those paying by direct debit and slightly less (64%) for those on prepayment plans.
A breakdown of average annual domestic electricity bills between different countries of the UK
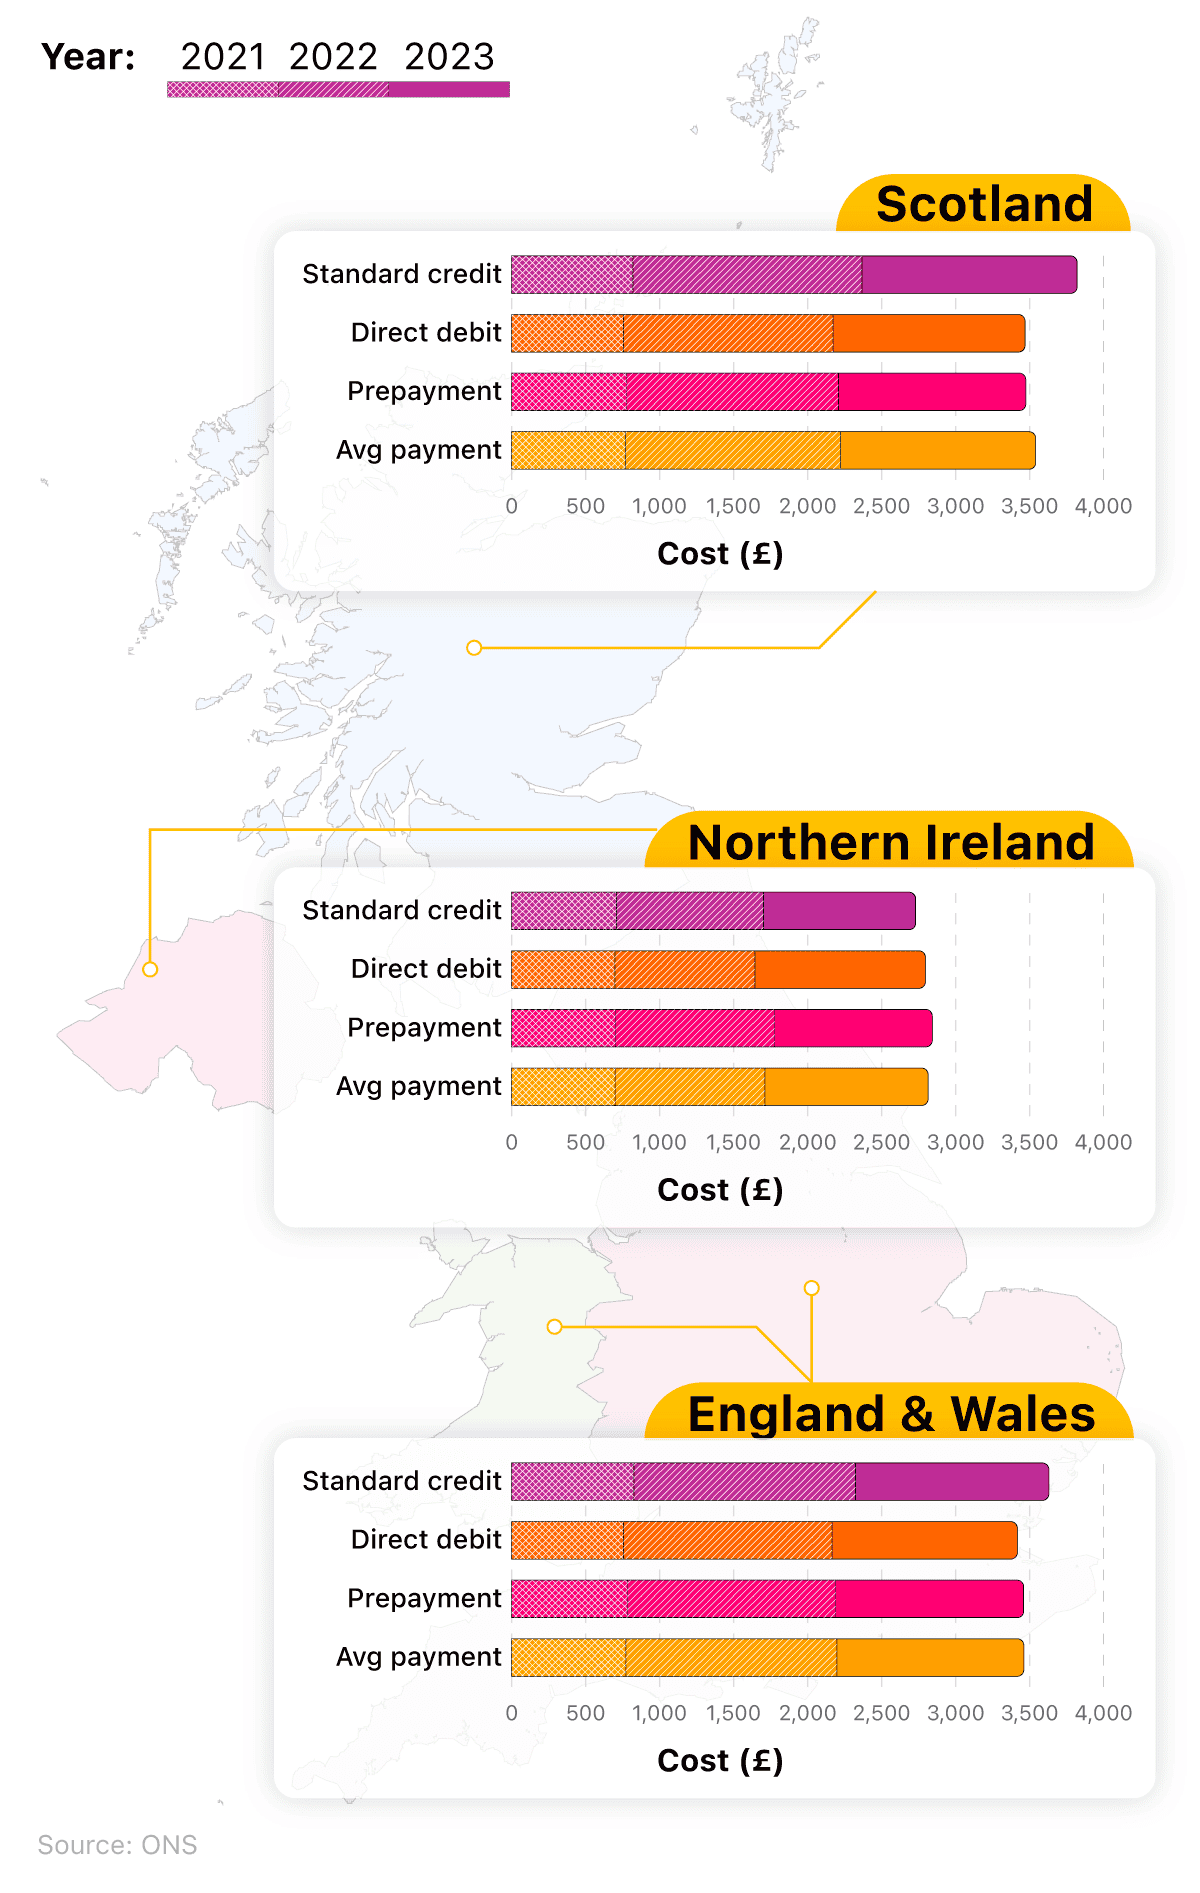
The latest cost of living stats on the average electricity bill shows significant price drops across Great Britain. Households in England and Wales paid around 11% less on average on their electricity bills in 2023 compared with the previous year, with those in Scotland paying roughly 9% less.
In contrast, average electricity bills in Northern Ireland increased by 9% from £1,012 a year to £1,103, between 2022 and 2023.
The most expensive method of payment in Scotland in 2023 was by standard credit (£1,454 a year). This is around two-fifths (42%) more costly than paying by the same method in Northern Ireland.
A breakdown of average annual domestic electricity bills between different regions of the UK
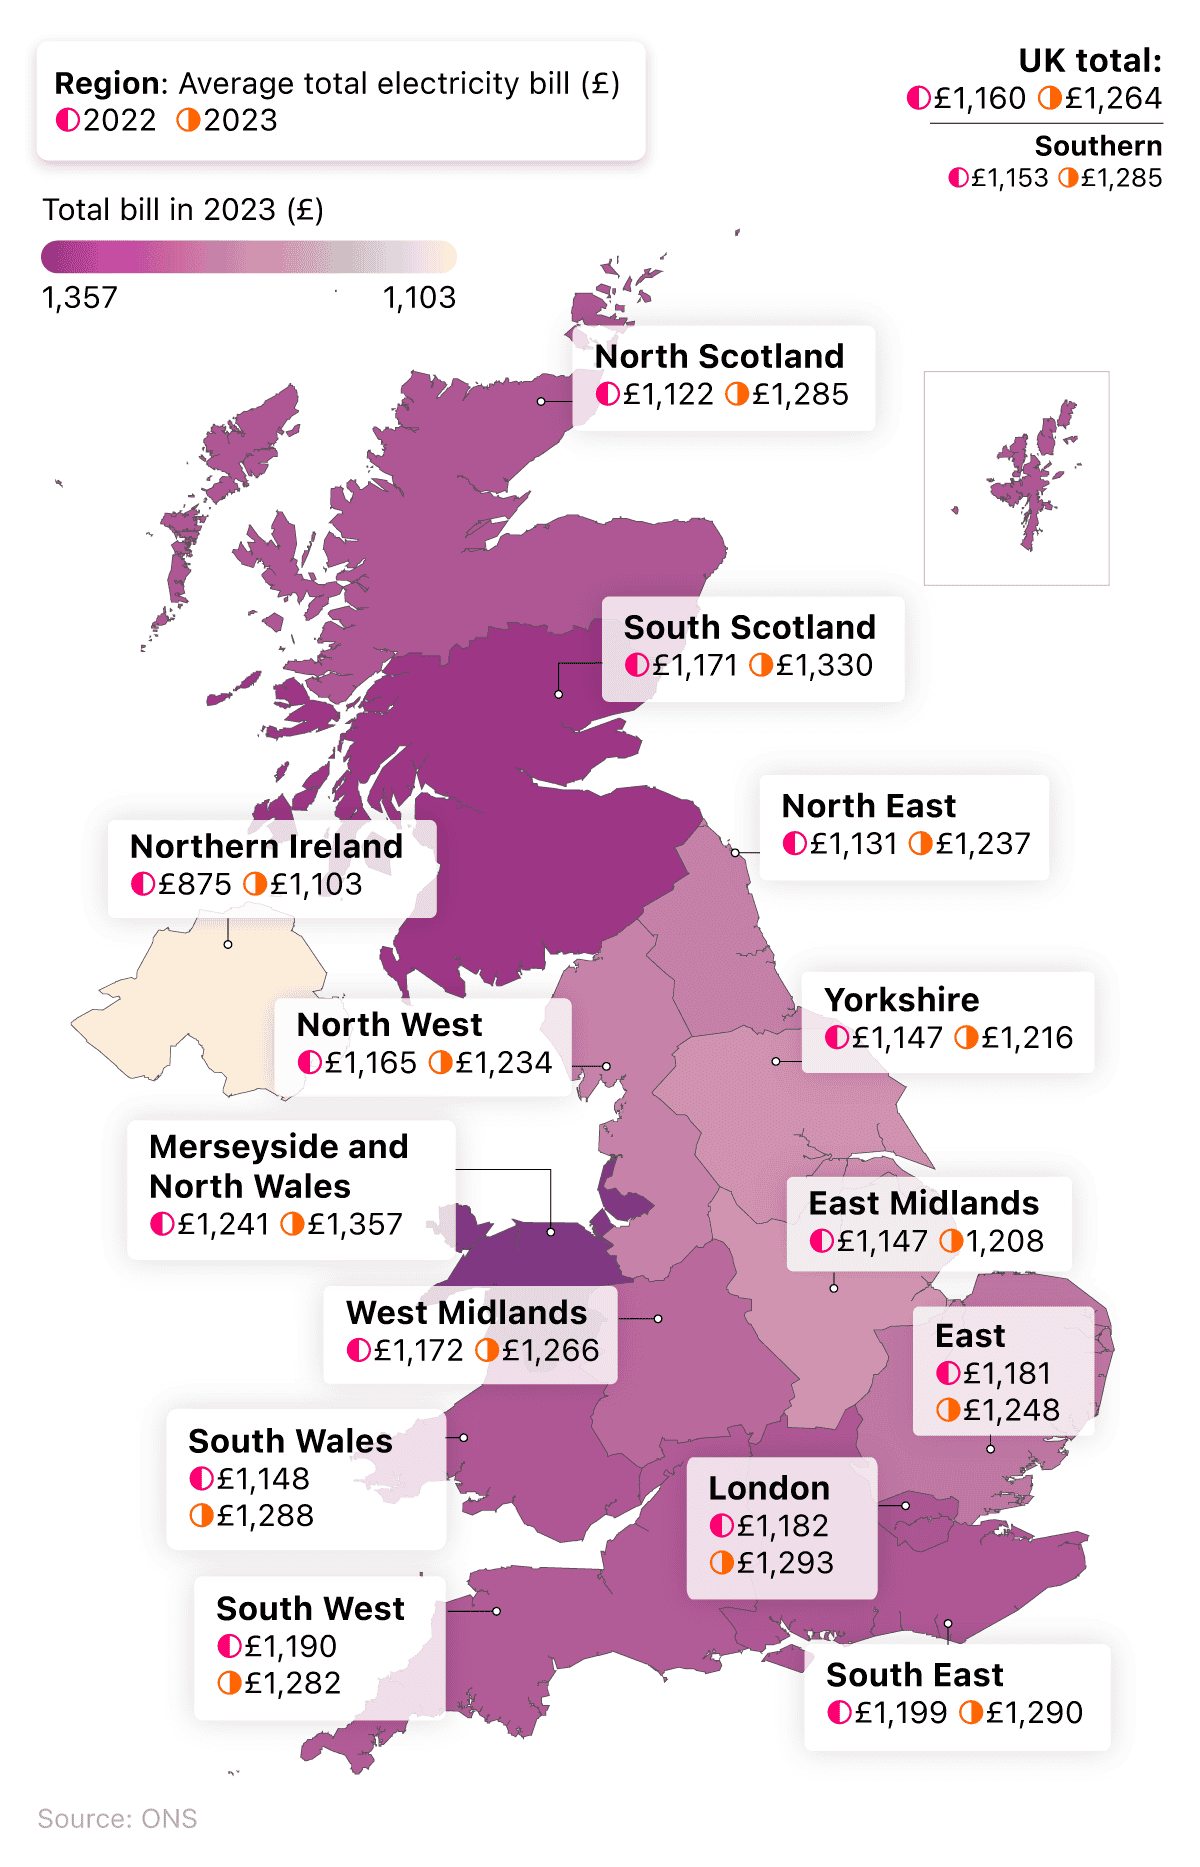
Latest UK cost of living statistics show that all regions of the UK experienced rises in their total domestic energy bills between 2022 and 2023. For the UK as a whole, households spent an average of £1,264 on their electricity costs in 2023 – nearly 9% more than the previous year.
In 2023, the highest average UK electricity bills were for those residents in Merseyside and North Wales (£1,357 a year), followed by South Scotland (£1,330) and London (£1,293). By contrast, the cheapest annual electric bills could be found in Northern Ireland (£1,103), followed by the East Midlands (£1,208) and Yorkshire (£1,216).
South Scotland had the most expensive unit cost for standard credit payments at 41.25p/kWh. This is 12.73p/kWh more than Northern Ireland – the cheapest location per unit.
Northern Ireland also had the cheapest bills for prepayment customers, with their average annual fees (£1,063) costing around £290 less than those in the West Midlands (£1,353) – the most expensive region for this payment method.
Average electricity bills for direct debit customers are cheapest in Yorkshire and the Humber with average annual fees of £1,152 – £201 less than Merseyside and Wales.
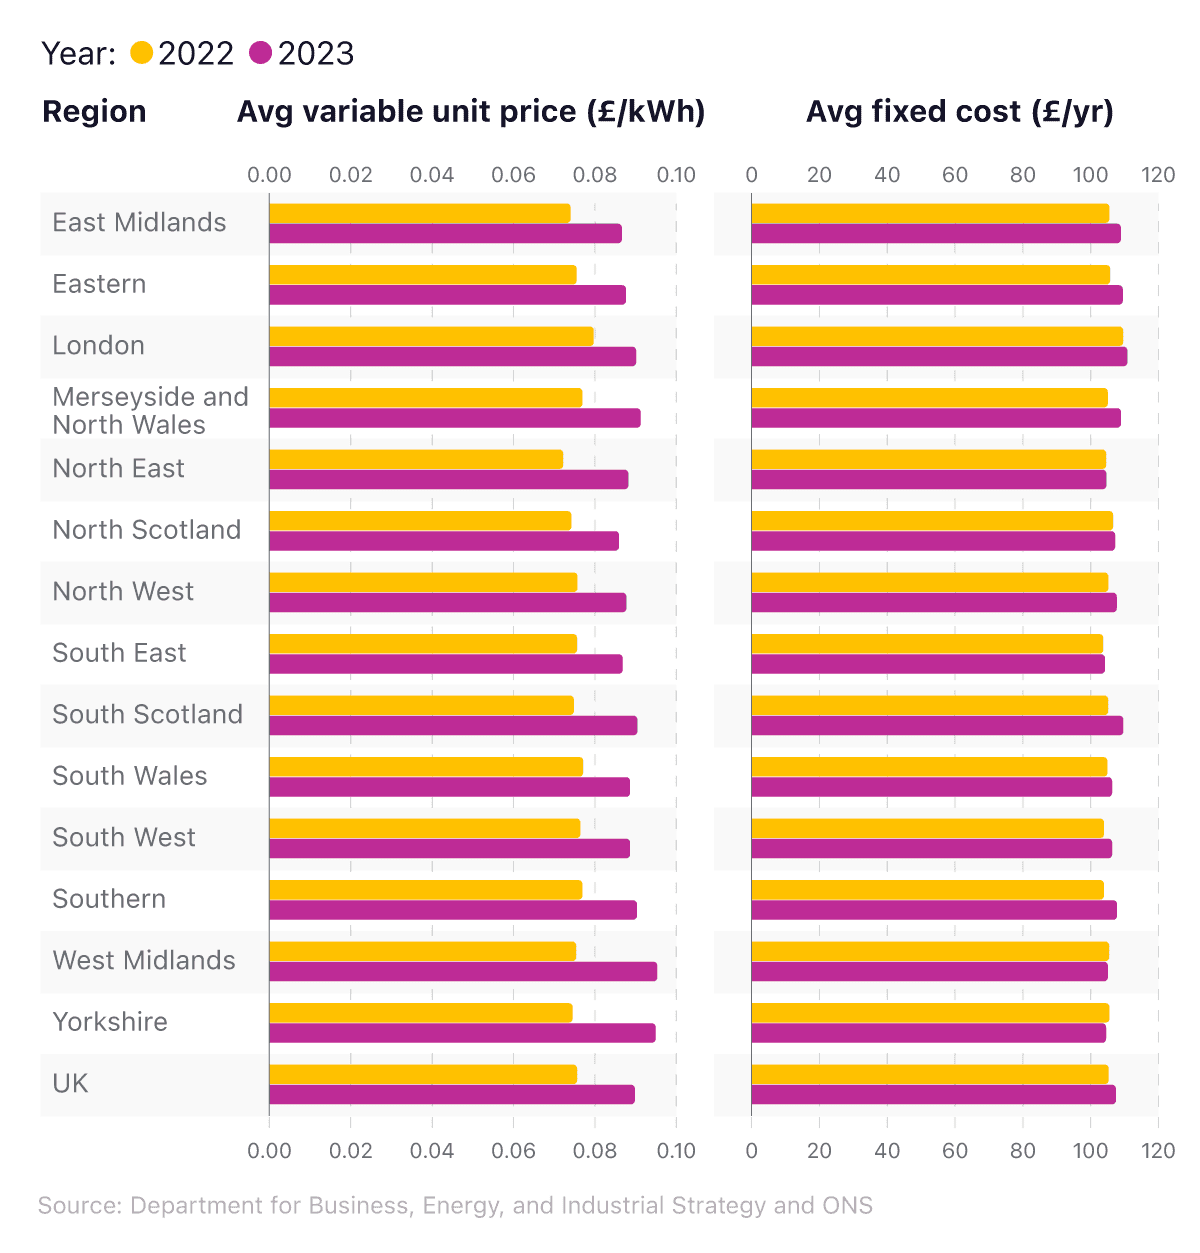
A breakdown of average units costs and fixed costs for electricity across different regions
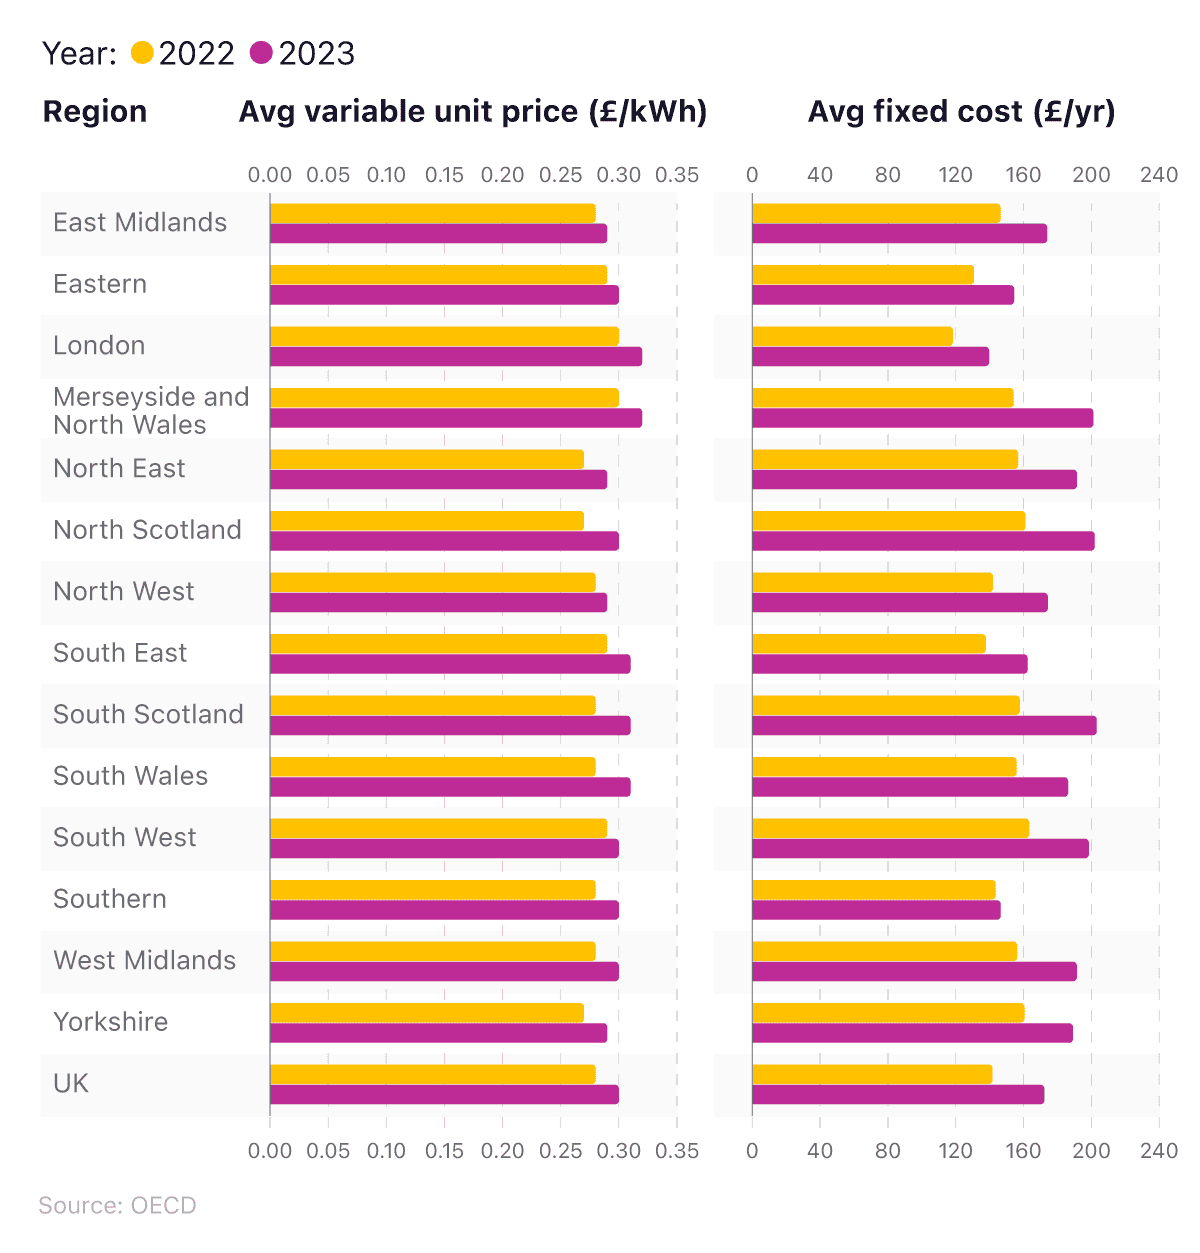
In 2023, UK households spent, on average, in excess of £172 a year on fixed-cost electricity bills. This represents a rise of around a fifth (22%) from 2022.
Those living in North Scotland typically incur the costliest annual electricity bills for fixed charges, at over £203 a year. This is around 45% more expensive than London (£139.63).
The average variable rate for those paying by standard credit, direct debit, and prepayment methods fell somewhere between £0.28/kWh and £0.35p/Kwh for all regions. South Scotland proved to be the costliest region for standard credit payments and direct debits, with the West Midlands being the most expensive for prepayment plans.
At the other end of the table, Londoners typically paid the lowest costs for all three payment plans, with their average direct debit fixed cost of £132.43, around £67 lower than the average costs in the most expensive region, South Scotland.
Average UK gas bill costs
After large rises between 2021 and 2022, UK households generally experienced smaller increases in their gas bills for 2023. According to UK cost of living statistics, the average UK gas bill for domestic use was £1,328 in 2023. This was a 17% rise on the average from the previous year.
A breakdown of the annual average UK gas bills 2021-23
| Year | Standard credit: All consumers (£) | Direct debit: All consumers (£) | Prepayment: All consumers (£) | Overall: UK (£) |
|---|---|---|---|---|
| 2021 | 601 | 550 | 587 | 564 |
| 2022 | 1,266 | 1,086 | 1,217 | 1,134 |
| 2023 | 1,381 | 1,308 | 1,372 | 1,328 |
Source: ONS
Standard credit consumers, on average, pay more than direct debit or prepayment customers. In 2023, standard credit payments were found to be £1,381 on average. This was £73 a year more than direct debit customers and £9 a year more than those on prepayment plans.
Learn how to write a budget that will help you stay on top of your finances and manage your money better.
A breakdown of the annual average gas bills for different countries of Great Britain
Across all payment types in England and Wales, the average gas bill for 2023 was £1,328. This was an increase of more than 17% from the previous year. In Scotland, the average cost was £1,330 – up nearly a fifth (19%) from 2022.
Those on standard credit payments in England and Wales pay, on average, £1,377 a year for their gas. This is £69 a year more than those on direct debit in the same countries.
In Scotland, those on standard credit pay just under £1,427 a year for their domestic gas consumption. This is £120 more than those on direct debit and £100 more than prepayment customers.
A breakdown of average annual domestic gas bills for different regions of Great Britain
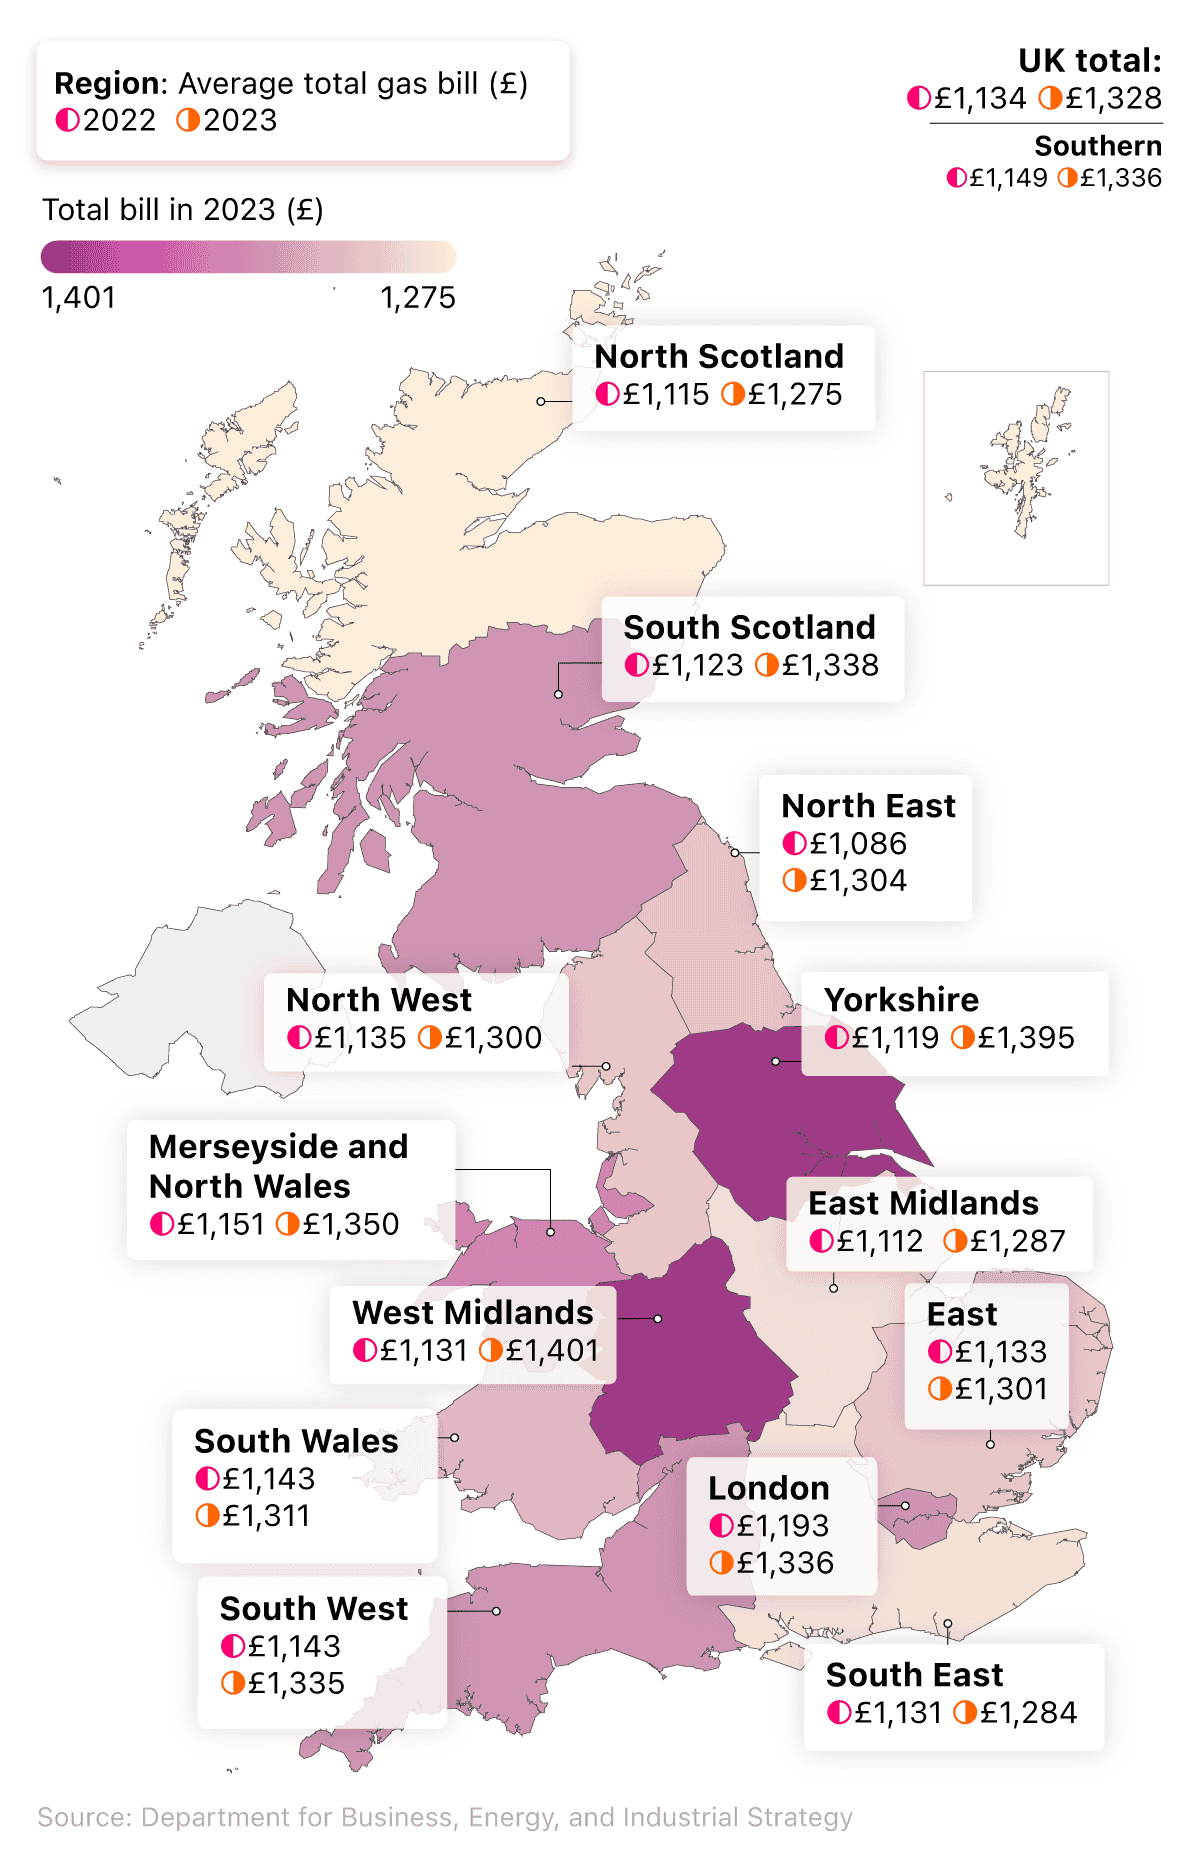
All regions of Great Britain experienced rises in their total domestic gas bills between 2022 and 2023. For the UK as a whole, households spent an average of £1,328 on their gas costs in 2023 – a 17% increase on the previous year.
The highest average gas bills in 2022 were for those living in the West Midlands (£1,401 for the year), followed by Yorkshire (£1,395). By contrast, the cheapest annual gas bills were found in North Scotland (£1,275) and the East Midlands (£1,287).
South Scotland had the most expensive unit cost for standard credit payment in 2023, at 10.57p/kWh (0.77p/kWh more than the North East – the cheapest location per unit). As a result, those living in South Scotland were paying £34 more a year than those in the North East for a standard credit payment.
Customers in the West Midlands face the most expensive bills for direct debit payments (£1,392), typically paying £150 a year more than those in North Scotland by comparison. However, this was the cheapest payment option for the majority of regions within the country.
For prepayment customers, Yorkshire is the most costly area, at £1,481 a year. This is £158 a year more than those in South Scotland, who only pay £1,323 on average for their domestic gas bills.
A breakdown of average units costs and fixed costs for gas across different UK regions
In 2023, British households spent, on average, £107.41 a year on fixed costs on their gas bills. This represents a rise of just over 2% from 2022.
Those living in London incurred the costliest fixed charges in 2023, at just over £110.79. This is more than £6 a year higher than the cheapest part of Great Britain (the South East).
Those in London also paid the most on standard credit and prepayment plans with rates close to £122.02 and £123.55, respectively. Those on standard credit in the capital paid more than £5 more than those in South East – the cheapest region for standard credit.
South Scotland had the most expensive charges for direct debit customers, with an average cost of £106.84 – more than £5 higher than the cheapest region (the West Midlands).
UK prepaid energy meter statistics
Prepaid energy meters are an increasingly popular type of domestic energy meter that requires users to pay for energy before using it. This ‘pay as you go’ system has become popular amongst low-income households and those looking to save money as it allows the customer to track their usage in real time and reduces the risk of spending more than they can afford for gas and electricity.
In some instances, energy providers can switch customers to prepaid meters if they have missed payments or have an outstanding debt for energy bills. Based on figures from Ofgem, an estimated 600,000 people were forced onto a prepayment meter in 2022 because they could not afford their energy bills, a rise of 220,000 from the previous year.
A breakdown of UK households with prepaid energy meters in 2021 (weighted figures)
| Number of households on prepaid energy meters for gas only (millions) | Number of households on prepaid energy meters for electricity only (millions) | Number of households on combined prepaid energy meters for gas and electricity (millions) |
| 1.94 | 2.6 | 0.22 |
(Source: ONS)
The latest prepaid energy meter statistics from the ONS found that, as of 2021, around 2.6 million UK households were using combined prepaid energy meters for their electricity. Electricity-only meters were found to be the most common type of prepaid energy meters amongst UK households.
Figures for gas-only prepaid meters were around 25% less than electricity meters, with just under 2 million households using this variant. Conversely, those who used combined pre-paid meters for gas and electricity only were far less common, with this type of meter found in roughly 90% fewer households than gas-only meters and 92% less than electricity meters.
A breakdown of UK households with prepaid energy meters in 2021 where the referenced household person is unemployed (weighted figures)
| Number of households on prepaid energy meters for gas only (thousands) | Number of households on prepaid energy meters for electricity only (thousands) | Number of households on combined prepaid energy meters for gas and electricity (thousands) |
| 266 | 330 | 9 |
(Source: ONS)
* A Household Reference Person (HRP) is the person who is legally responsible for the household. Where there is more than one person who is legally responsible in the household, the HRP is the person with the highest income. If there is more than one person with the same income, the eldest member of the household becomes the HRP.
The figures regarding the number of unemployed households with prepaid energy meters follow a similar pattern to the overall statistics. Again, the most common type of prepaid meter was found to be electricity-only meters, with this type of meter found in roughly 25% more households than the next most common pre-paid meter (gas only).
Combined meters were once again the least common pre-paid meter, with their figures of 9,000 more than 95% lower than both electricity-only and gas-only meters.
A breakdown of UK households with prepaid energy meters in 2021 receiving disability benefits (weighted figures)
| Number of households on prepaid energy meters for gas only (thousands) | Number of households on prepaid energy meters for electricity only (thousands) | Number of households on combined prepaid energy meters for gas and electricity (thousands) |
|---|---|---|
| 414 | 554 | 36 |
(Source: ONS)
Cost of living stats found that electricity only meters were also the most common type of pre-paid meter amongst those receiving disability benefits. Found in over 550,00 households, this type of meter was found in more than 30% more homes than gas-only meters. In a trend that mimics the previous findings, combined meters were once again found in over 90% fewer homes than both electric and gas pre-paid meters.
UK energy price cap
A price cap is introduced to stop companies from making excessive profits and ensure consumers pay no more than a fair price for their energy consumption. It’s traditionally updated twice a year and tracks the wholesale energy cost to decide how much the cap should be.
After dozens of energy suppliers became insolvent as a result of soaring prices not keeping up with the six-month review process, Ofgem changed this to a quarterly process in August 2022.
Under the UK energy price cap, companies can pass on ‘reasonable costs' to the consumer, including any increases associated with buying gas from its source. From April 2022, energy companies were also allowed to pass this additional cost onto UK customers because they cannot afford to supply gas and electricity for less than they have paid for it.
Between 2021 and 2022, 29 energy companies either left the market or were put into administration due to rising global gas prices. This affected around 4.3 million UK customers.
In February 2022, the UK regulator Ofgem announced the UK energy price cap would increase from 1 April 2022 by 54%, from £1,064 to £1,971 for typical annual consumption.
Following concerns over a mammoth rise in prices just as winter began, the Government stepped in to limit the UK energy price cap to £2,500 for a typical household from October 2022. The Energy Price Guarantee (EPG) meant that the government would subsidise any customer payments above £2,500 between October 2022 and March 2024.
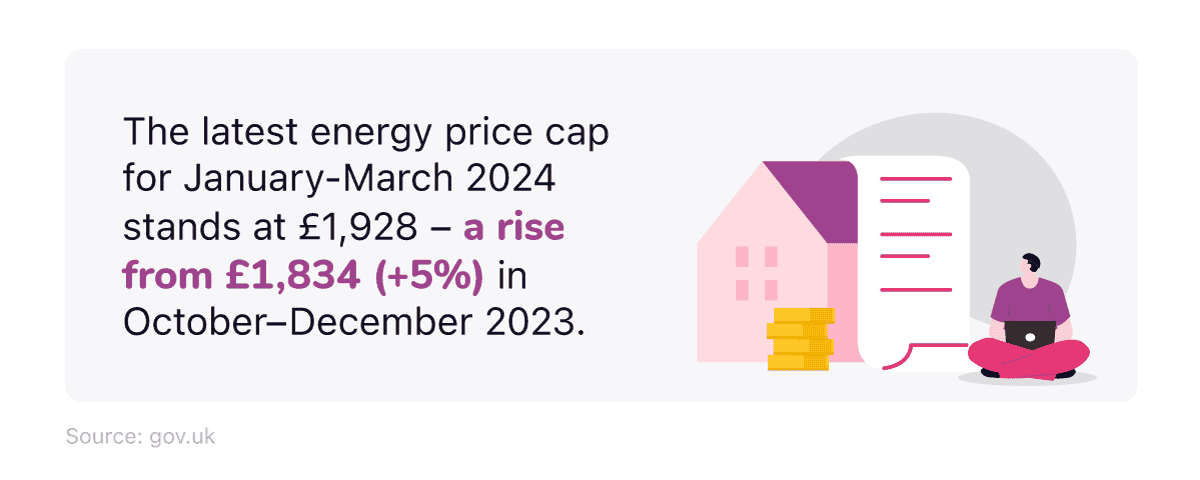
The energy price cap peaked at £4,279 in January 2023, before falling throughout the rest of 2023. The latest energy price cap for January-March 2024 stands at £1,928 – a rise from £1,834 (+5%) from October-December 2023 for those paying by direct debit.
The UK energy price cap is a limit on the cost of a unit of gas/electricity, with standard charges taken into account. It is not a cap on consumers’ overall energy bills, which will rise and fall in line with their overall energy consumption. From 1 January 2024, the equivalent per unit level of the price cap is 28.62p per kWh for electricity and 7.42p per kWh for gas for the average customers paying by direct debit.
The UK energy price cap has directly impacted approximately 29 million UK consumers, particularly those on default or variable rates on credit metres. This could affect customers in various ways, depending on how they choose to pay their energy bills. For example, from January-March 2023:
Those on default tariffs paying by direct debit could see an increase of almost £94, from £1,834 to £1,928 a year
Prepayment customers (about 4.5 million UK households) may experience a rise of £99, from £1,861 to £1,960. This could result in additional fees of £32 a year compared to those on direct debit payment plans
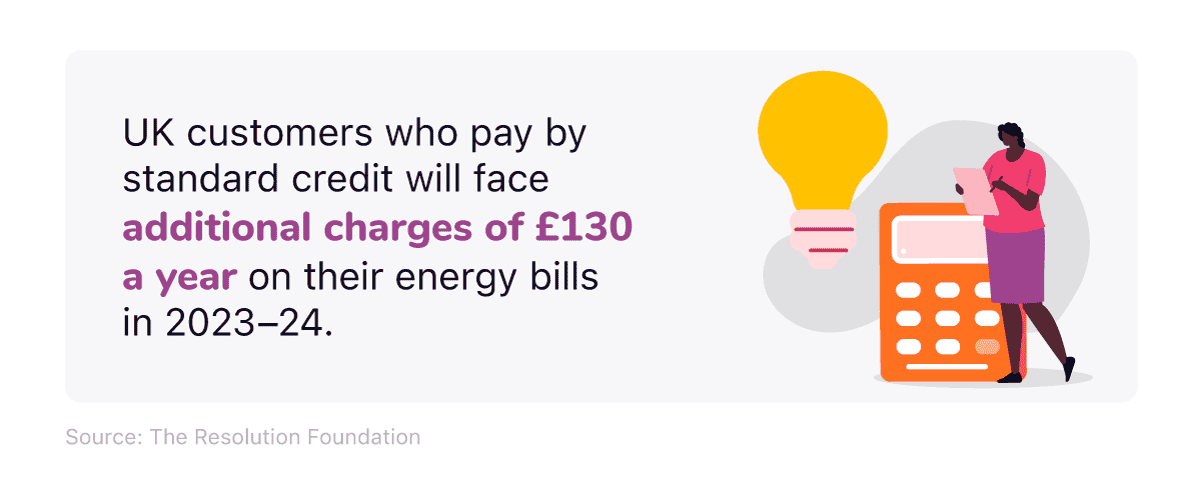
Customers who pay by standard credit (i.e. cash or cheque) could pay an additional £130 more than those paying by direct debit due to the higher admin costs involved in supplying them
The reduction in the UK energy price cap from the start of 2024 is the result of global gas prices falling from their record rates in 2022, with wholesale prices dropping by 86% from their peak in 2022.
Struggling to cover the cost of your energy? Check out our guide on what to do if you cannot pay a bill.
Average UK water bills 2022-23
As of 2023, the cheapest average UK water bill was supplied by Portsmouth Water. With an average of £109 a year, their customers were £28 a year better off than the next cheapest, Bournemouth (£137), and £44 better off per year compared to Cambridge Water in third (£153). By contrast, the most expensive water bill was supplied by Essex and Suffolk, at an average of £245 for 2022 and £225 for 2023 (more than double Portsmouth Water’s average bill).
A breakdown of average UK water bills by company and associated cost (current and forecast) 2022-23
| Company | Average annual cost of bill in 2021-22 (£) | Average annual cost of bill in 2022-23 (£) | Projected average annual cost of bill in 2023-24 (£) |
|---|---|---|---|
| Portsmouth | 103 | 109 | 117 |
| Bournemouth | 143 | 137 | 140 |
| Cambridge | 151 | 153 | 161 |
| South Staffs | 158 | 160 | 173 |
| Northumbrian | 161 | 177 | 188 |
| Southern | 178 | 168 | 186 |
| Hafren Dyfrdwy | 171 | 179 | 195 |
| Affinity (Central) | 177 | 175 | 187 |
| Affinity (Eastern) | 204 | 207 | 227 |
| SES Water | 187 | 190 | 216 |
| Yorkshire | 186 | 186 | 198 |
| Bristol | 189 | 201 | 213 |
| Severn Trust | 188 | 201 | 213 |
| Dwr Cymru Welsh Water | 185 | 193 | 193 |
| Anglian | 195 | 198 | 222 |
| Affinity (South-East) | 232 | 235 | 257 |
| United Utilities | 203 | 199 | 210 |
| Essex and Suffolk | 225 | 245 | 259 |
| Thames | 220 | 227 | 258 |
| South West | 222 | 215 | 216 |
| Wessex | 233 | 235 | 261 |
| UK average | 199 | 199 | 215 |
(Source: Individual companies listed above via Statista, 2023)
*Average bills from April 2023 to March 2024 are estimates based on forecast data provided by water companies)
According to average UK water bill statistics, the projected figures for 2023 and 2024 place Wessex Water as the most expensive water provider in the UK, with an average annual water bill of £261.
Portsmouth is expected to hold onto its crown of the most affordable region for domestic water bills in 2023, with a rise of £6 in its average bill, to £117 a year.
Of the 22 companies, 19 increased their average annual water bills between 2022 and 2023, two decreased them, and only one (Cymru Welsh Water) held them level. South West Water decreased the most (£6 off their average annual bill), while Thames increased the most (£38).
Check out our guide for expert tips that can help you save money on your water bill.
UK housing cost of living statistics - rising house prices
Average UK house prices 2023
Average UK house prices decreased by 2.1% over the year to November 2023, signalling a steeper decline than the 1.3% year-on-year decline seen in October 2023. The average UK house price was £285,000 in November 2023, a £6,000 decrease from the same time in 2022.
A breakdown of regional average property prices in England 2023
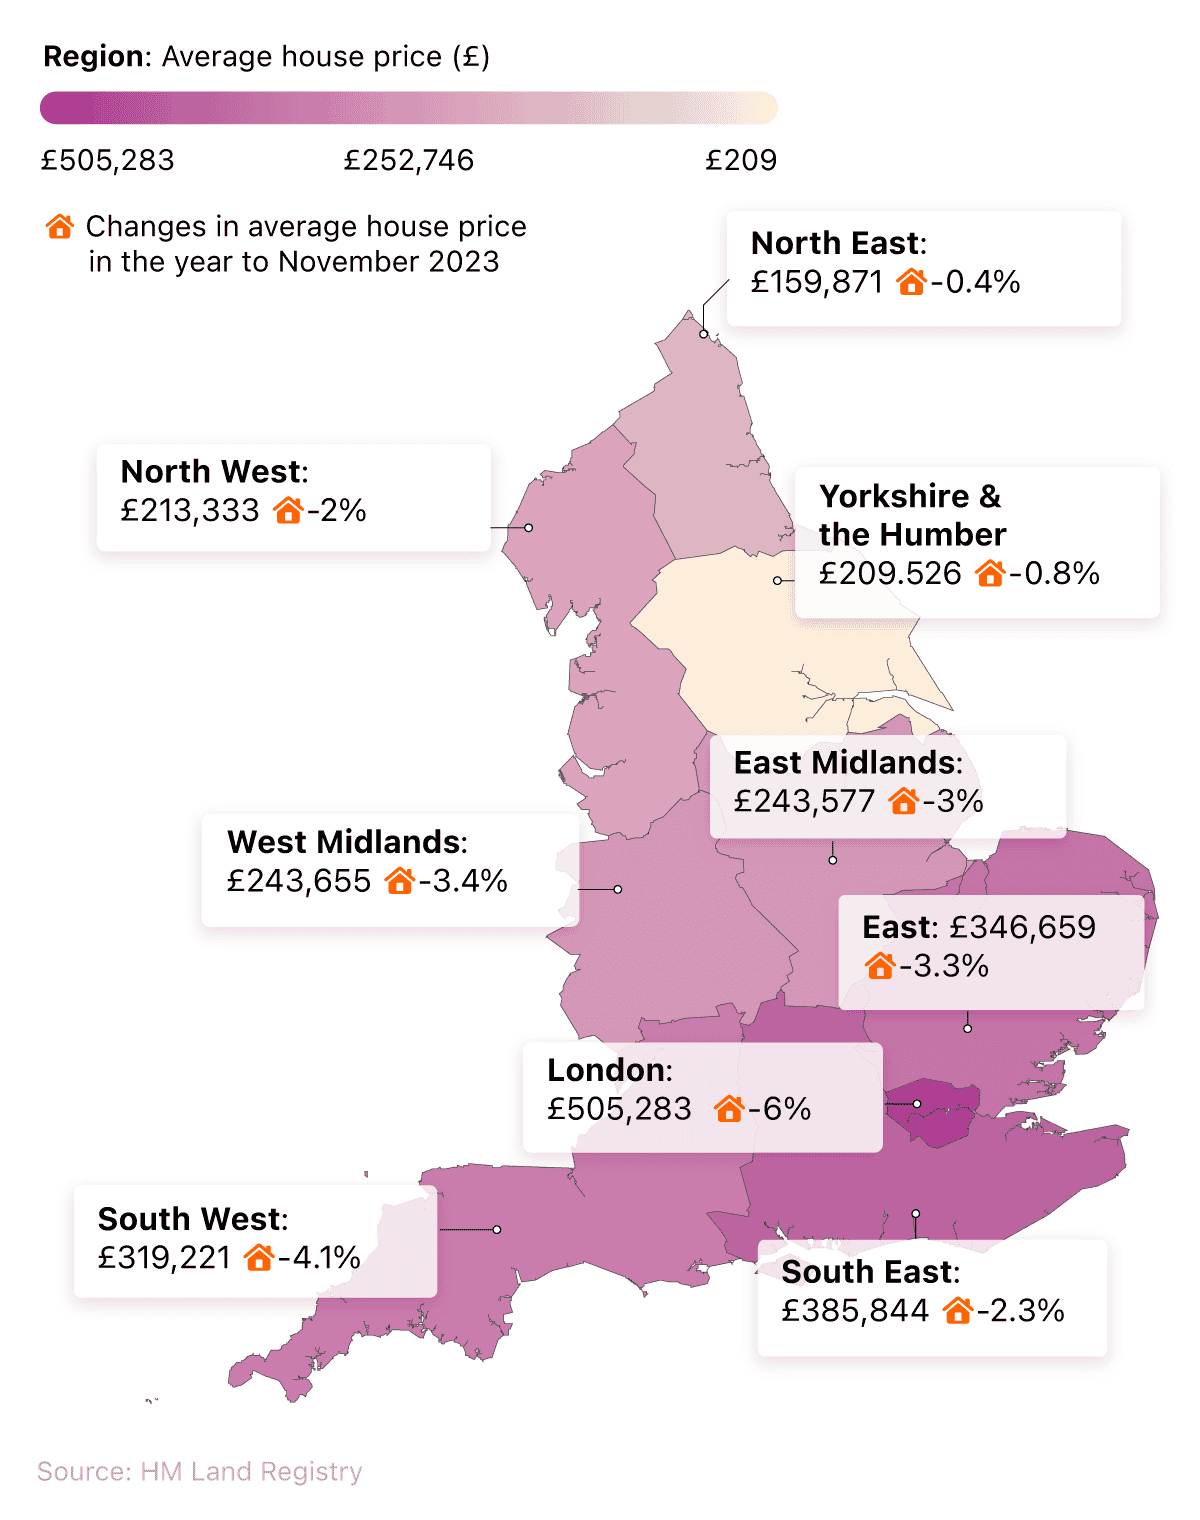
The latest UK cost of living statistics show that London remains the most expensive area to purchase a property, with the average price exceeding £505,000. At the other end of the table, the North East was found to be the most affordable part of England on average for house prices, with prices typically under £160,000 – around two-thirds (68%) lower than London.
The region with the largest fall in average UK house prices since November 2022 was London (-6%), followed closely by the South West (-4.1%). The North East saw the smallest annual price fall, at -0.4%.
As of January 2024, Rightmove reported that the average price of new properties coming to the UK housing market was around £359,748 (a 1.3% rise on the previous month). This suggests that house sellers are continuing to raise their asking prices, despite the fall in average UK house prices. On average, this equated to more than £4,571 per property.
A breakdown of the rate of annual change to average UK house prices between 2019-23
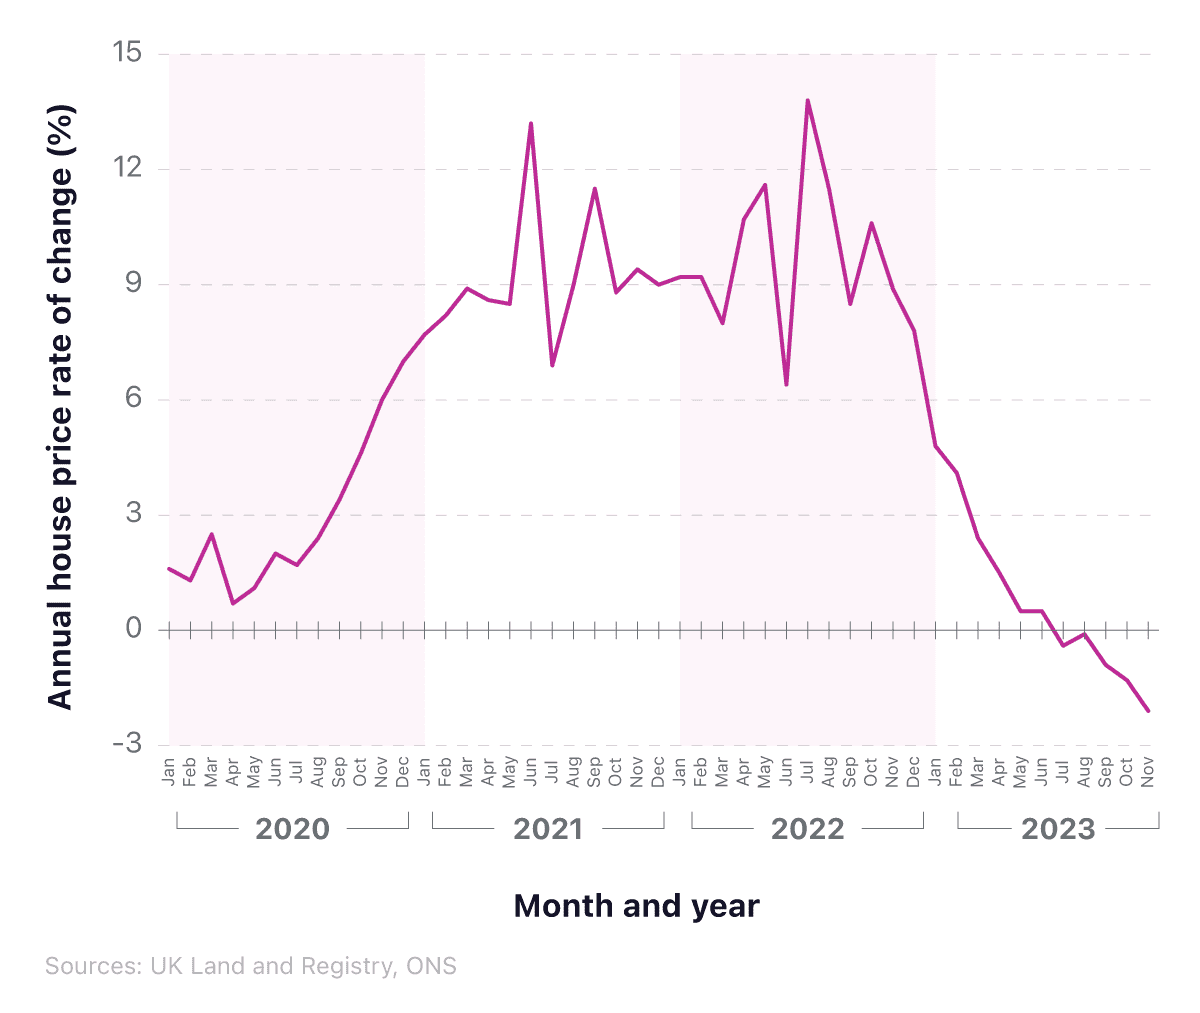
Throughout 2021 and 2022, the UK housing market witnessed a degree of turbulence, with fluctuations between roughly 7-14%. From January 2018, the percentage change dropped from 4.3% to 0.6% in August 2019, after which it rapidly increased to 8.9% in March 2021.
According to UK cost of living crisis statistics, this reached a peak of 13.8% in July 2022 before broadly slipping in the following months. After a 10.6% change in October 2022, the final few months of the year saw a steady decline to 8.9% in November and 7.8% in December.
The percentage rate fell to 4.8% in January 2023 then continued decreasing throughout 2023, dropping below 0% in July (-0.4%) for the first time since 2012.
The latest figure of -2.1% for November 2023 is the lowest figure for house price inflation since June 2011.
Visit our mortgage guides section to find expert advice on new and existing mortgages.
A breakdown of average property prices between different countries of the UK between 2013 and 2022
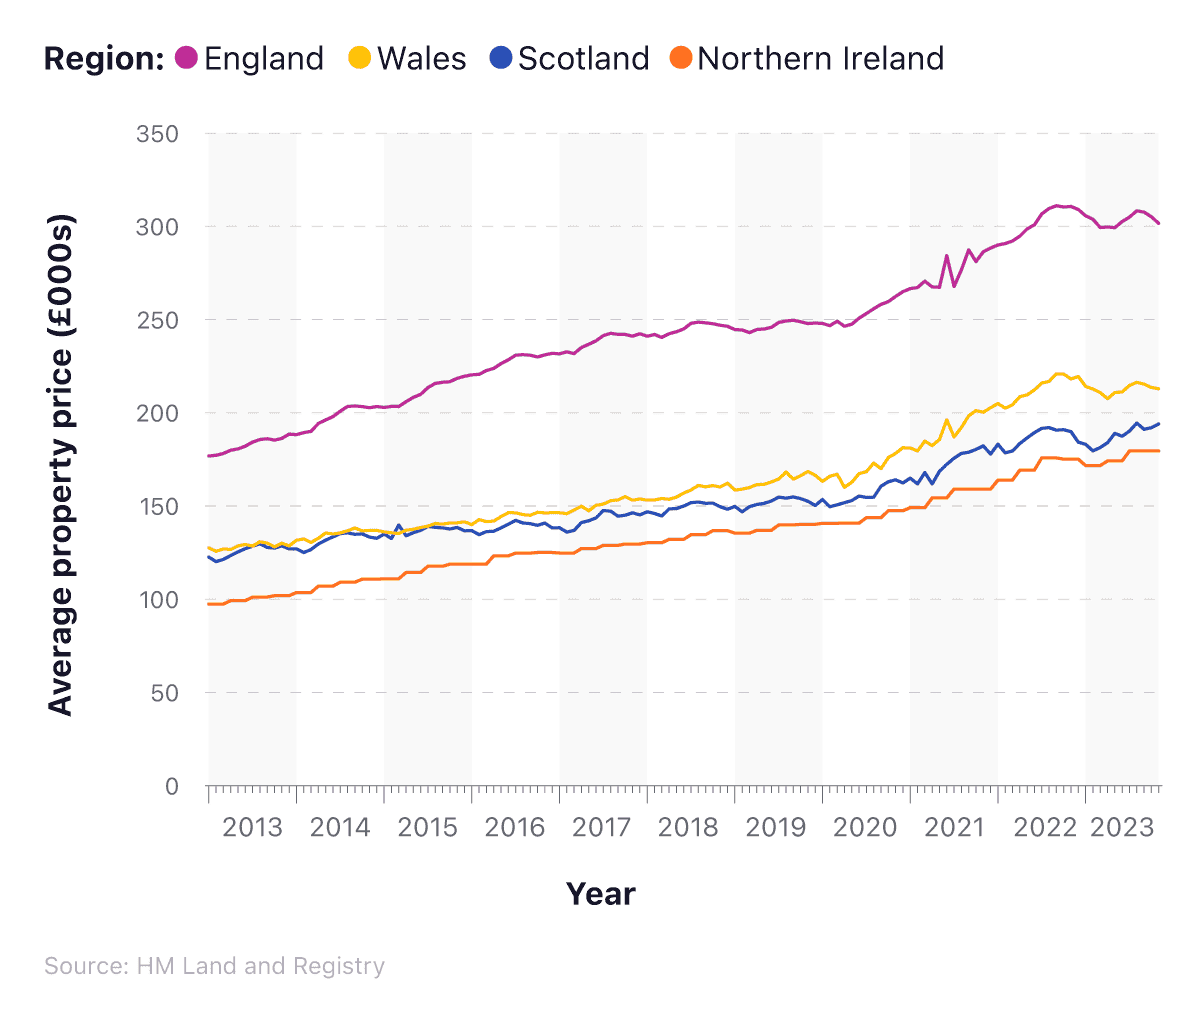
UK cost of living statistics indicate that the average English property decreased in value in November 2023 to £301,613 (-2.9% compared to November 2022).
In Wales, the corresponding figure was £212,866 (down 2.4%), while Scotland was marginally over £194,000 (+2.2%). Northern Ireland remains the cheapest part of the UK to purchase a property, with average prices of £179,530 in November 2023 (+2.5% from November 2022).
At the start of 2012, the average price of a house in England was just a little more than £174,000 (around 42% less than November 2023). In Wales, the corresponding figure for January 2012 was around £127,000 (40% less than 2023), whereas in Northern Ireland, the average property will set you back around £80,000 more in 2022 compared to 2012.
Scotland has seen the smallest growth in its property prices across the last 10 years. In 2012, the average property would set you back around £123,000 (just £71,000 less than in 2023).
Average UK house prices by property type
According to recent UK cost of living statistics, the average UK house price was £284,691 in December 2023 (1.4% lower than the previous year).
Terraced properties in the UK saw the largest percentage decrease in their average price, dropping more than £9,000 in November 2023 compared to the same time in 2022. This represents a fall of 3.8%, compared to 0.7% for detached homes and 1.7% for semi-detached housing.
A breakdown of the average UK house by property type (November 2022-23)
| Property type | November 2022 | November 2023 | Difference (%) |
|---|---|---|---|
| Detached | £457,043 | £451,249 | -1.26% |
| Semi-detached | £281,749 | £277,880 | -1.40% |
| Terraced | £239,455 | £230,416 | -3.80% |
| Flat/maisonette | £231,945 | £225,652 | -2.70% |
| All | £291,092 | £284,321 | -2.30% |
(Source HM Land Registry)
Flats and maisonettes had the second-highest percentage decrease (2.7%) of all property types over the last 12 months. This equated to over £6,200 less in cost compared to the previous year.
UK mortgage arrears statistics and repossession stats 2022
According to the Financial Conduct Authority (FCA), at the end of Q3 2022, there were 87,930 mortgage loan accounts with arrears of more than 2.5% of the current loan balance. Of these, 15,670 had arrears of between 5% and 7.5%.
UK mortgage arrears statistics from UK Finance estimated that 630 homeowner properties were taken into possession in Q3 2023. This means that across the UK, on average, there were 6.8 properties repossessed every day between July and September 2023 – more than one every four hours.
Between July to September 2023, 45.5 daily mortgage possession claims, and over 10.5 mortgage possession orders, were made across England and Wales. In addition to this, an average of 271.1 landlord possession claims and 72.5 landlord possession orders were also made each day across the same period.
UK mortgage arrears statistics indicate that, at the end of October 2023, total mortgage debt stood at more than £1.63 trillion – £9 billion more than one year earlier. With almost 10.8 million households in the UK, this means the estimated average outstanding debt is £151,076 per household.
Want to know how much you’re eligible to borrow from mortgage lenders? Set your expectations by using our free mortgage calculator.
UK rental market statistics
According to UK rental market statistics from Zoopla, rental growth in the UK stood at 9.7% a year (as of December 2023) – well ahead of the inflation for wages, which was 6.5% in November 2023.
The UK has a distinct supply-demand issue when it comes to rented accommodation. Compared to the UK’s five-year average, UK rental market statistics indicate that demand for rental properties was down 11% in December 2023 from the previous year. However, this was still around a third higher than the average for the previous five years.
The stock of UK rental accommodation in 2022 is way below the five-year average. According to UK cost of living stats, the flow of new supply onto the market is around a fifth (18%) lower than the mean average figures for 2017-2022, but 20% higher than the same period last year.
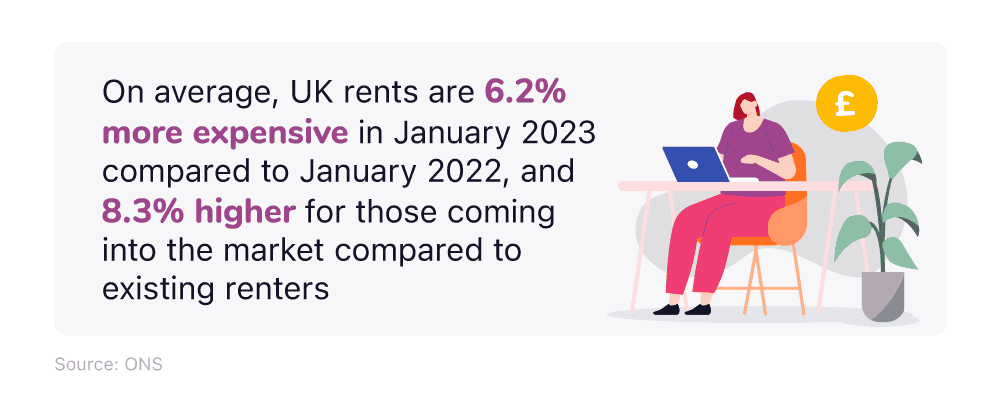
The ONS rental index tracks growth across all rental homes. This is, on average, 6.2% more expensive in December 2023 compared to 12 months earlier. However, those moving to a newly rented property will find the rising cost of renting 8.3% higher than a year ago according to Rightmove. This is because rents for new lets reflect the current levels of supply and demand at the time of moving.
Seeing as the average renter moves every four years, and given the UK cost of living crisis, people may think twice about whether to find a new rental property or choose to stay put in their current one. This will amplify the squeeze on supply, and risk keeping the pressure on the UK rental market into 2025.
UK rental market statistics show that, over recent years, demand has reduced for two and three-bedroom houses, down to around 11% for each in 2022, whereas two-bedroom flats are up to more than a third (35%). The growth in demand for one-bedroom flats slowly grew between 2020 and 2022, from 30% to 32%.
According to our cost of living index, the UK ranks 12th best in the world when it comes to rent, monthly outgoings, and other associated living costs. The affordability of renting is broadly in line with the long-term average (LTA) since 2009. In Q2 2022, rent accounted for more than a third (34.4%) of earnings, compared to an LTA of 33%. This figure did drop to a low of 31.9% in Q1 2021 but has since slowly been on the rise, as the average price of rent continues to increase faster than the rate of pay.
Looking to buy your first home? Compare first-time buyer mortgage and help to buy mortgage rates from an array of lenders and find the best deal for you.
UK rental market statistics - private rent price increases in the UK
UK rental market statistics indicate that private rental prices in the UK were 6.2% higher in December 2023 compared to the same time in 2022 – the joint-largest annual increase in the previous six years alongside November 2023.
At the start of 2016, UK private rental charges were, on average, 2.6% higher than in January 2015, which then fell to 0.9% in July 2018. A period of steady increase with some fluctuations saw them reach 2.1% in January 2022, before rapidly increasing to 3% only six months later.
A breakdown of the change to UK average monthly rent for private properties between 2018 and 2023
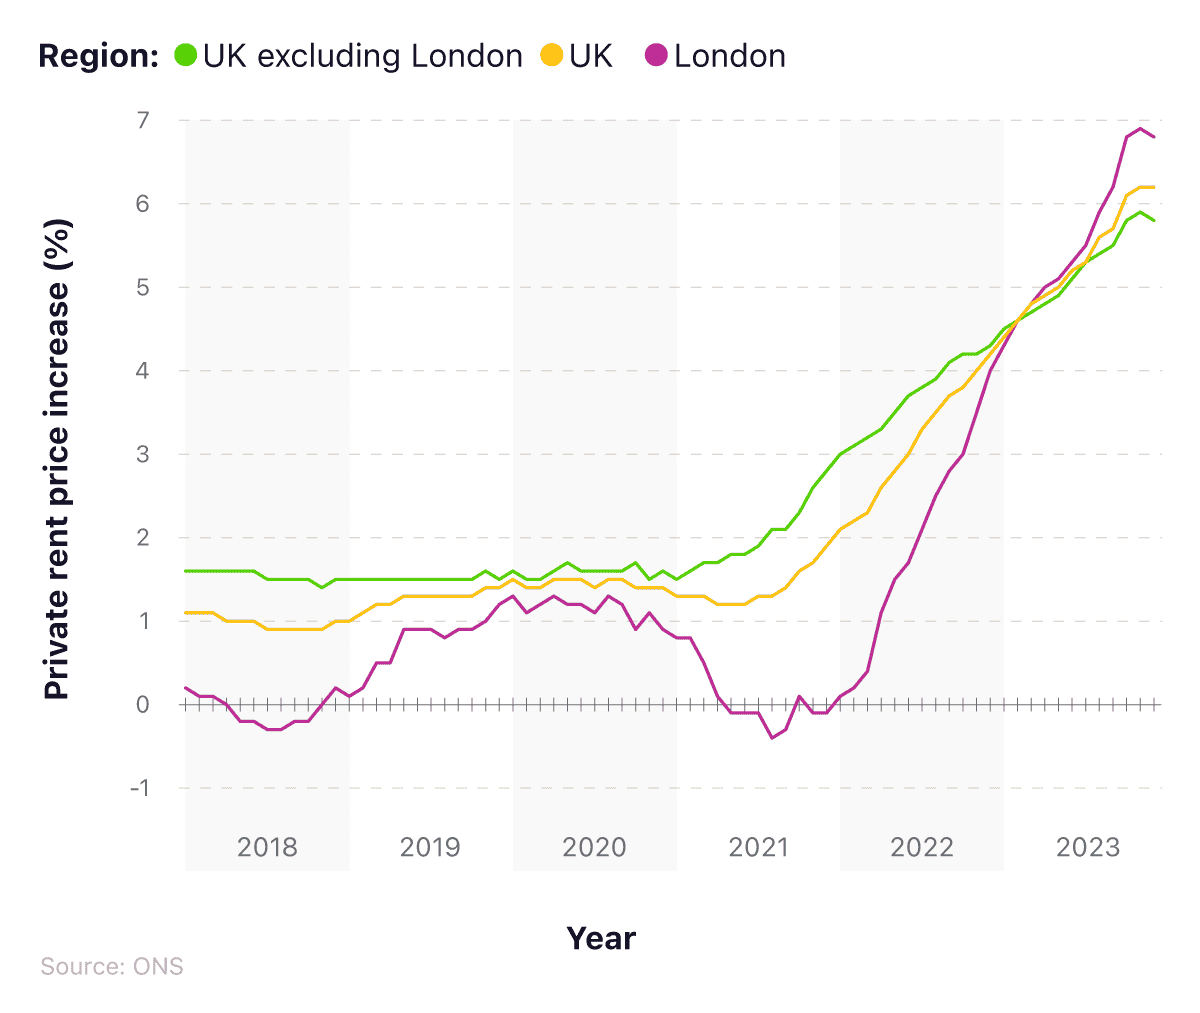
In London, the private rental market has been more volatile than the rest of the country, with the changes far more extreme over the given six-year period. In 2016, the average rental property in London was 3.9% higher than the previous year. This rate dropped dramatically in May 2018, when prices reached negative values for the first time in recent history (-0.2% compared to May 2017).
Following this, private rental prices have gradually increased and decreased between -0.3% and 1.3%. Since May 2022, the percentage change started to increase relatively quickly, reaching 2.1% in July 2022 compared to July 2021. In the second half of 2023, London’s annual price rises were consistently above the rest of the UK, peaking at 6.9% in November before falling to 6.8% in December.
When London is taken out of the UK national figures, the picture for private rental prices is more stable. UK cost of living statistics show that, throughout 2016 and 2018, there was very little change, with prices fluctuating between 1.4% and 2.3% higher compared to the previous 12 months. However, according to historic UK rental market statistics, the percentage change in private rent increased rapidly from 2.6% in November 2021 to 4.4% in January 2023. These increases continued throughout 2023, peaking at 5.9% in November before falling slightly in December (5.8%).
UK rental market statistics by region 2023
Between 2016 and 2022, all four UK nations witnessed a relatively similar pattern in the average cost of private rent, with fluctuating prices up until 2021, and a sustained increase throughout 2022 and 2023.
Throughout most of 2016 and 2017, the percentage change in private rental prices in England was higher than in the other three nations, despite falling from 2.8% in February 2016 to 1.6% in September 2017. After this point, Northern Ireland has sustained its position as the country with the highest rate of change in average rent prices in the UK.
Since January 2020, the rising cost of rent has been relatively significant in Northern Ireland, despite mild fluctuations between 2017 and 2019. As of October 2023, the percentage change stood at 9.3%, having been as high as 10% in March.
UK rental market statistics highlight that changes to private rental charges in England have been more gradual. After reaching a low of 0.9% in July 2018, it steadily rose and fell across the resulting three years. Since January 2022, it has trebled, rising from 2.0% to 6.1% as of December 2023 – the joint-highest increase on record in recent years.
A breakdown of changes to UK rental market statistics for different countries of the UK between 2018 and 2023
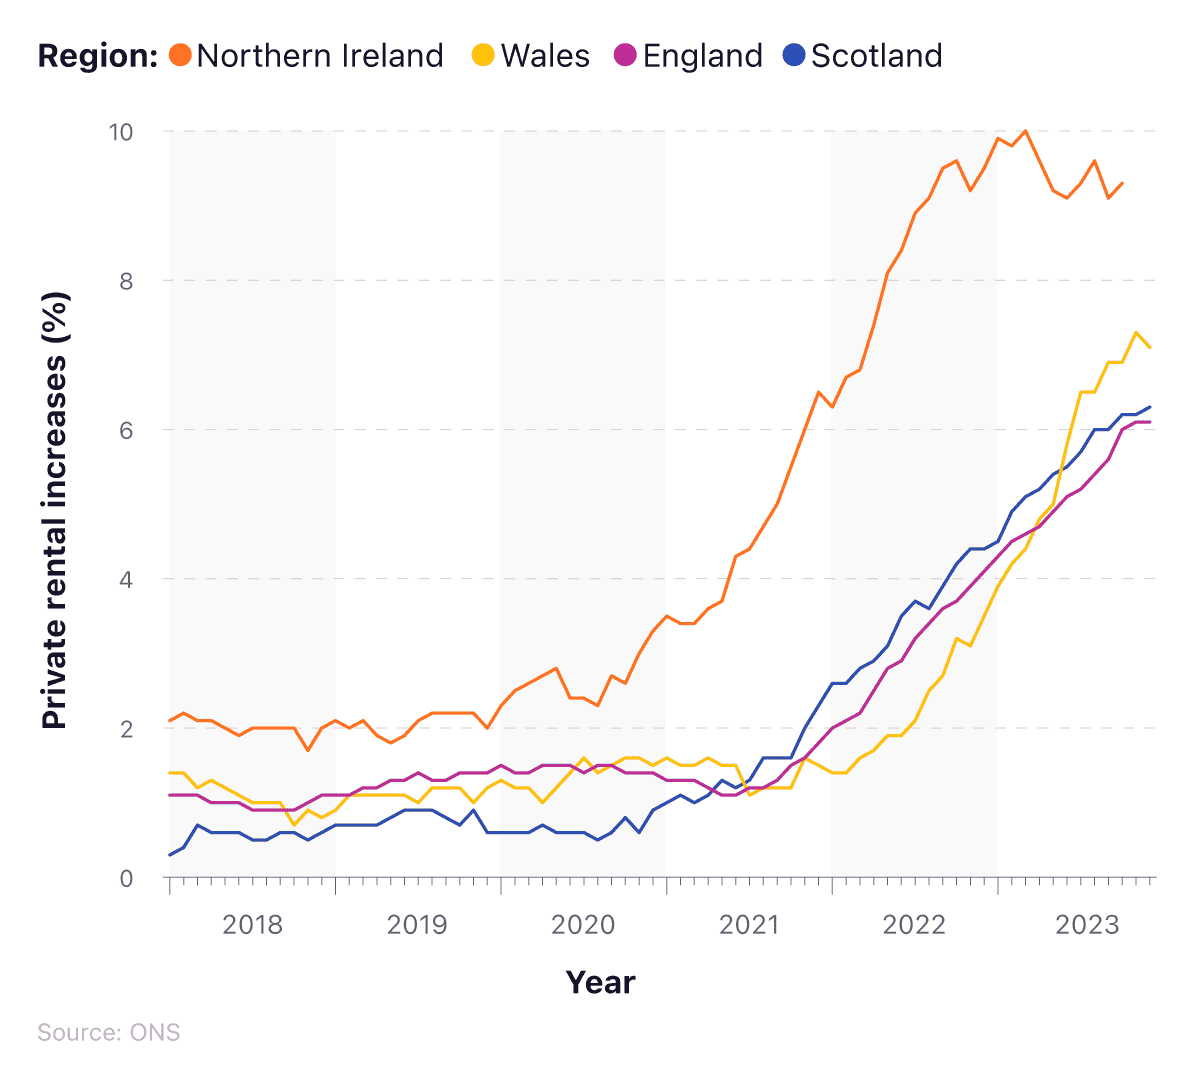
The private rental landscape for both Scotland and Wales is similar to that of England, but with some negative changes to note. For Scotland, the rate of change for private rental charges was 0.8% in January 2016, before dropping -0.2% in October later that year.
Between August 2016 and July 2017, the percentage change fluctuated above and below 0%, after which it gradually increased up until January 2021. Prices during this time alternated between 0.6% and 1.0%, compared to the previous year. From January 2021, there was a sustained increase, rising to a peak of 6.3% in December 2023.
For Wales, the initial picture for private rental costs is relatively similar to Scotland. Increases were felt between June 2016 and December 2017, when the average change in private rental charges went from -0.1% to 1.7% in December 2017. Things remained stable until 2022 when the figures began to rise dramatically.
By December 2023, UK rental market statistics show the average change in private rental charges in Wales stood at 7.1% – more than double the number recorded in December 2022 but a 0.2 percentage point fall from November 2023.
A breakdown of the rental affordability of different regions of the UK in 2023
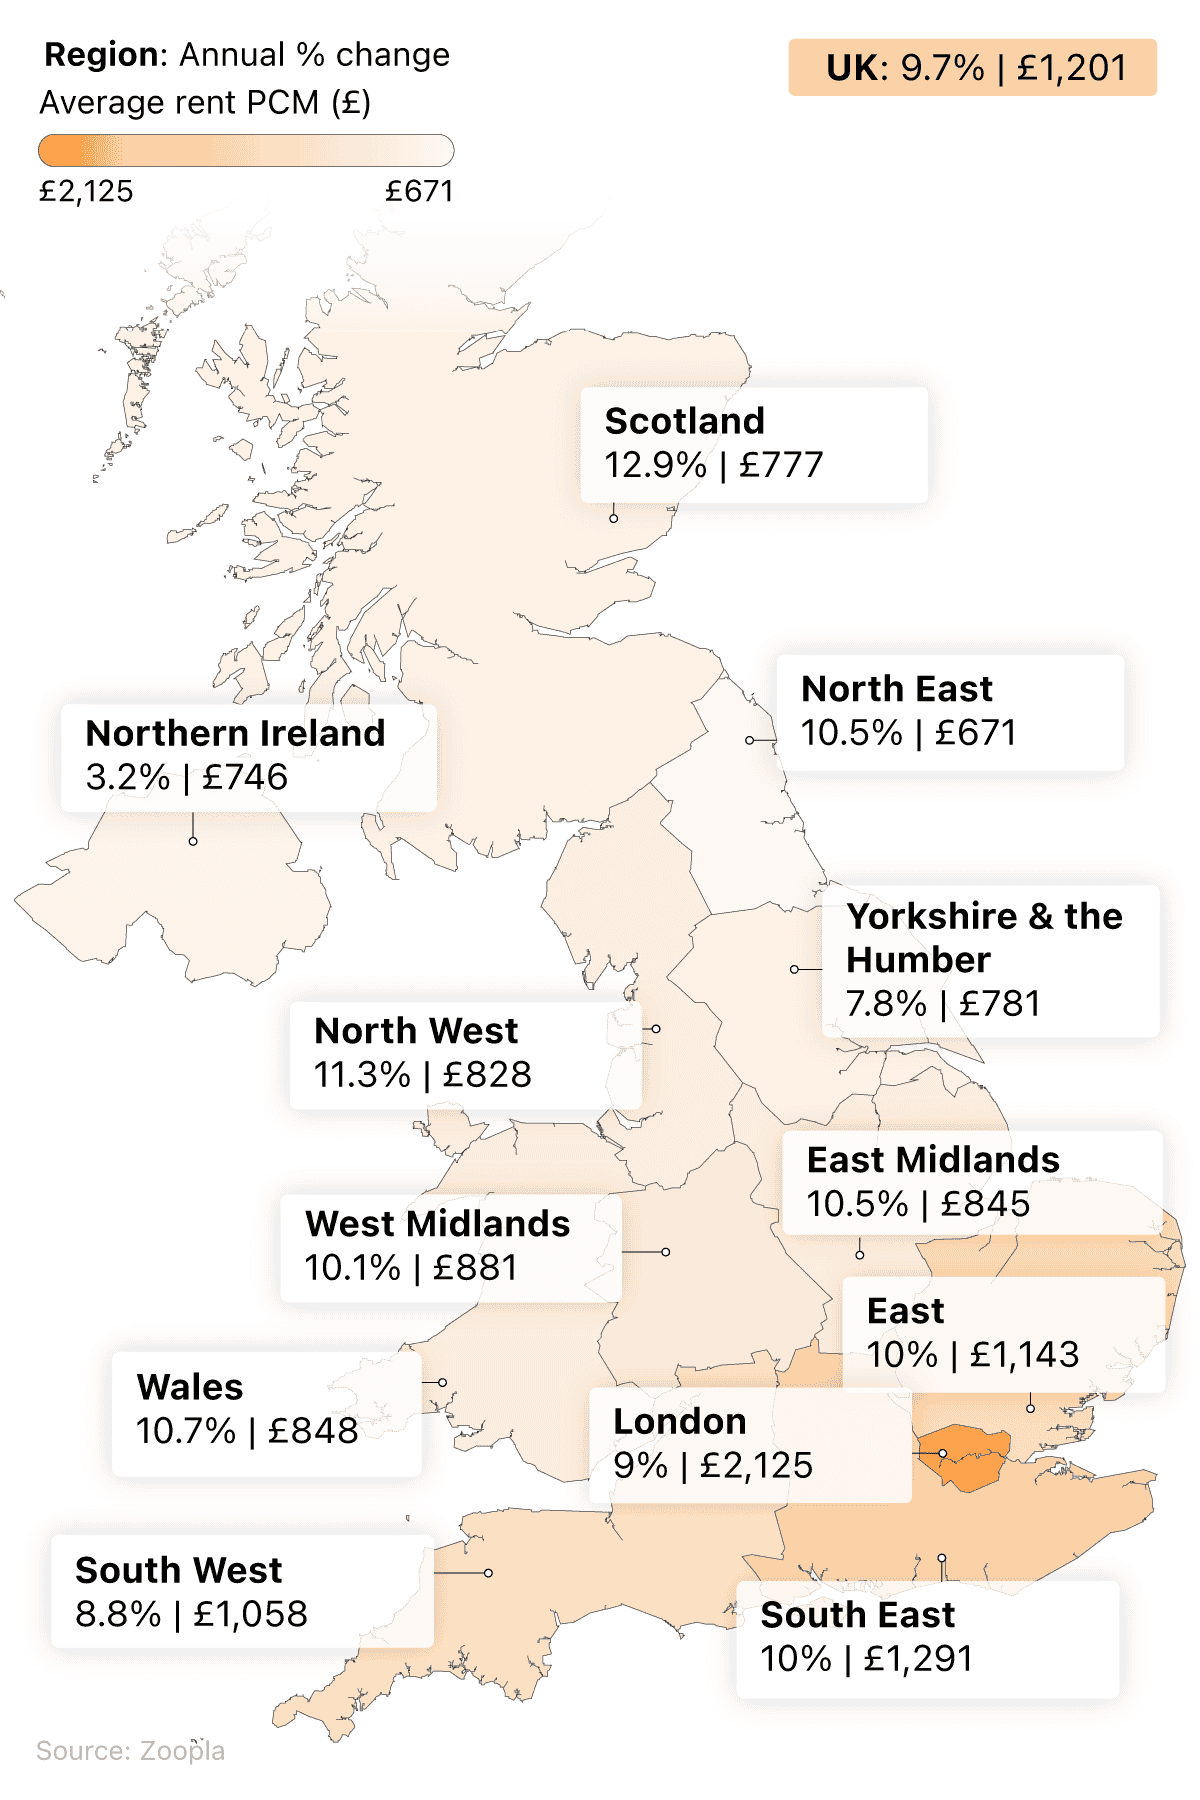
UK cost of living statistics indicate that, in 2023, London remained the most expensive place to rent in the UK, with average monthly costs of £2,125. This is more than three times as expensive as the North East (the UK’s cheapest rental location, at £671).
Our cost of living report found that the rising cost of rent made some areas such as Kensington and Chelsea average at almost £2,970 a month—the highest across anywhere in the UK.
Scotland recorded the highest year-on-year (YoY) growth for 2023 (12.9%), followed by the North West (11.3%). At the other end of the table, Yorkshire and the Humber’s YoY growth of 7.8% was the lowest figure recorded across the country.
The rising cost of rent doesn’t only affect England. Rent-affordability-by-region data shows that the average rent in Wales (£848 pcm) is nearly 10% higher than in Scotland (£777) and over 13% more than in Northern Ireland (£746).
A breakdown of the rent prices for the major UK cities in 2023
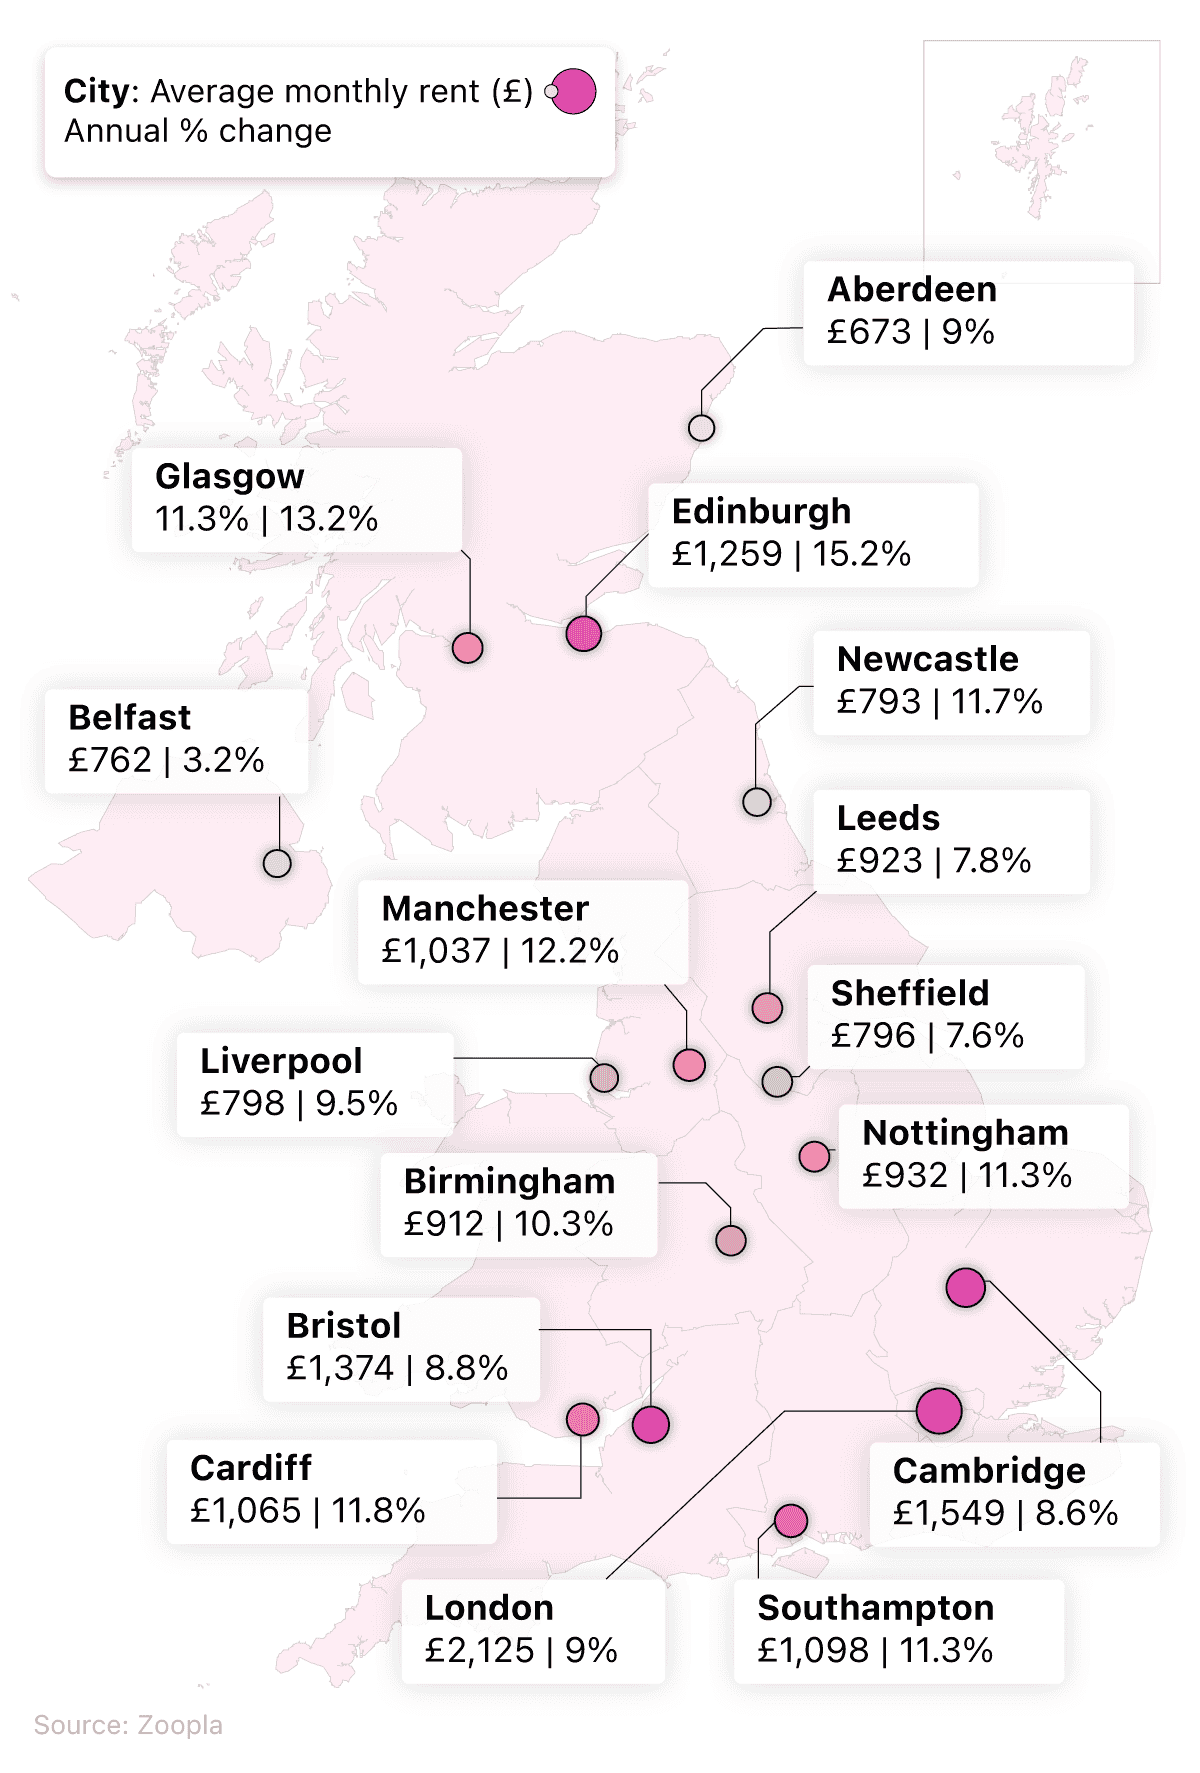
The UK has some of the best cities to move to for work. However, this is only beneficial if the associated wages of working there allow you to live the lifestyle you desire.
Data for 2023 average rental costs by region shows that London is the most expensive city to rent a property in the UK. At £2,125pcm, the rising cost of rent means renters here pay more than £575 a month more than second-placed Cambridge (£1,549), and around 316% more than the UK’s most affordable city, Aberdeen.
Edinburgh saw the largest growth in rental costs within the past 12 months, at 15.2%. By contrast, Belfast has seen the smallest growth, followed by Sheffield, at 3.2% and 7.6%, respectively.
If you are considering relocating for a better standard of living, check out our UK relocation report, which judges different places in the country on UK average house prices, salary, as well as environmental factors that may influence your overall quality of life by moving there.
Average UK council tax statistics 2023
In 2022-23, average UK council tax statistics showed that the cost for a typical Band D property was £1,996. This increased £99 (or 5.1%) for 2023-24, to £2,065 a year.
For other parts of the UK, the corresponding figures for a typical Band D property in 2023-24 are:
£1,789 in London (up from £1,684 in 2022-23)
£2,059 in metropolitan areas (rising from £1,960 in 2022-23)
£2,139 in unitary areas (rising from £2,036 in 2022-23)
£2,134 in shire areas (rising from £2,040 in 2022-23).
The UK’s average council tax costs will be £1,578 in 2023-24.
A breakdown of the most and least expensive places for UK council tax 2023-24
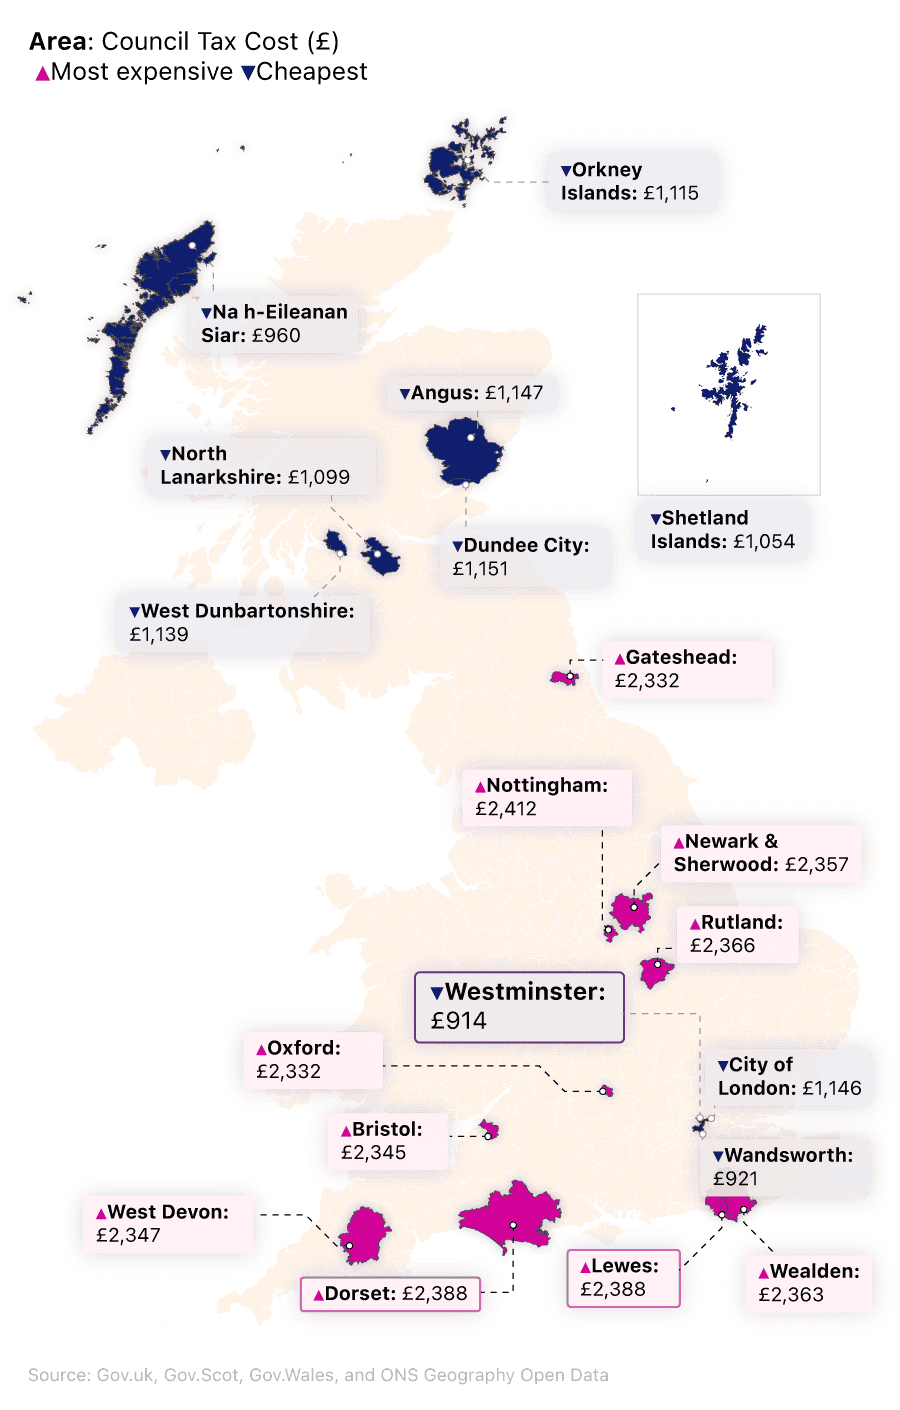
UK council tax statistics shows that the two cheapest areas for UK council tax in 2023 and 2024 can both be found in London. Council tax for residents of Westminster starts from as little as £914 a year, followed by Wandsworth at £921.
The most affordable location in Scotland is Na h-Eileanan Siar (£960), followed by the Shetland Islands (£1,054) – the third and fourth cheapest rates in the UK, respectively.
There is no Welsh representative in the top 10, with the lowest council tax in Wales (Caerphilly) more than £700 a year more expensive than Westminster.
England dominated the list of areas with the most expensive council tax, with all of the top 10 based in England. The two most expensive areas were both found in Nottinghamshire, with Rutland and the City of Nottingham having average annual rates of £2,366 and £2,412, respectively.
It’s not just about the annual cost of council tax, it’s what you get for your money. According to our study, the regions with the best return on their council tax are Wandsworth, Wigan, and Windsor & Maidenhead, when taking into account what services are offered by the council, such as emergency vehicle response times, education, and household recycling facilities.
UK council tax statistics for council tax support fund and housing benefits 2023
Our exclusive data analysed the budgets of each county council in England, with a focus on council tax support and household support funds. This data was then weighed up against the council’s reported population, giving an accurate figure of support available per head.
The main findings from our study show that:
Of the top 10 councils offering the most support, the top seven are all based in northern England.
Hartlepool offers the largest council tax support, with £3.78 per person available to its 92,000 inhabitants.
The City of London offers the least support per person regarding council tax, at just £0.79 (although that affects only 8,538 residents).
Population data reveals that Kent County Council has the largest population of all councils in England, being responsible for over 1.5 million people. The county features in 93rd place due to low council tax support and household support funds available.
A breakdown of England’s best and worst performing councils for council tax financial support
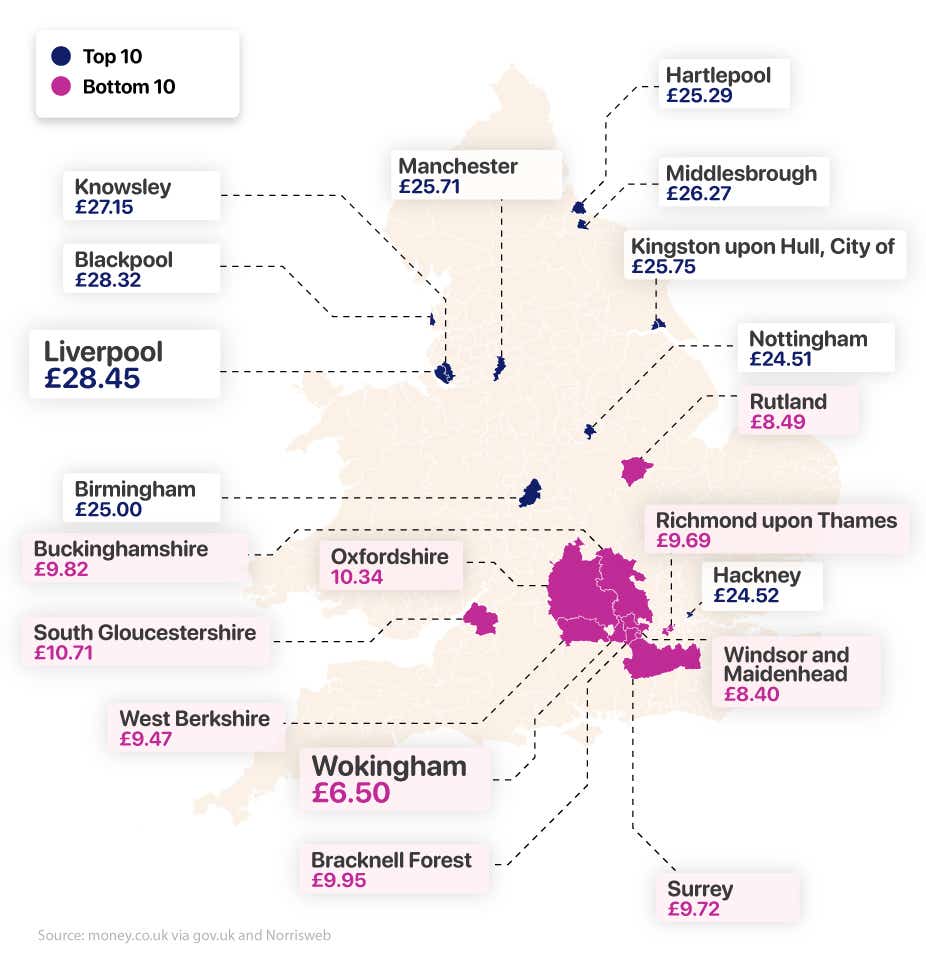
Data shows that Liverpool council offers the most support per person across their county. At £28.45 per head, Liverpool exceeds all other major cities in its household support fund, issuing £24.91 per person to those requiring assistance. Similarly, their council tax support fund is one of the highest in the UK, at £3.54 per person.
In the northwest of England, Blackpool offers marginally more per person than Liverpool in terms of council tax support (£3.57 vs £3.54, respectively). However, the same can’t be said for their household support fund, which offers £24.76 per person—15 pence less than that of Liverpool.
Overall, Blackpool’s combined support figure is £28.32 per head—13 pence less than that of Liverpool. However, that’s more than Knowsley (featuring in third on the list) which offers £27.15, a full £1.17 lower than Blackpool.
A breakdown of the UK’s highest performing councils for council tax financial support
| County council / unitary authority | Population | Number of households | Council tax support fund (£) | Household support fund (£) | Council tax support fund per capita (£) | Household support fund estimate per capita (£) | Support funding per capita (£) |
|---|---|---|---|---|---|---|---|
| Liverpool | 486,088 | 207,491 | 1,722,389 | 12,108,040 | 3.54 | 24.91 | 28.45 |
| Blackpool | 141,036 | 64,789 | 502,981 | 3,491,715 | 3.57 | 24.76 | 28.32 |
| Knowsley | 154,519 | 66,073 | 470,169 | 3,724,377 | 3.04 | 24.1 | 27.15 |
| Middlesbrough | 143,926 | 60,262 | 473,542 | 3,307,230 | 3.29 | 22.98 | 26.27 |
| Kingston upon Hull, City of | 267,014 | 115,472 | 798,075 | 6,076,587 | 2.99 | 22.76 | 25.75 |
| Manchester | 551,938 | 214,732 | 1,286,349 | 12,906,326 | 2.33 | 23.38 | 25.71 |
| Hartlepool | 92,338 | 40,930 | 348,937 | 1,986,043 | 3.78 | 21.51 | 25.29 |
| Birmingham | 1,144,919 | 423,456 | 3,035,699 | 25,582,270 | 2.65 | 22.34 | 25 |
| Hackney | 259,146 | 106,081 | 709,312 | 5,644,517 | 2.74 | 21.78 | 24.52 |
| Nottingham | 323,632 | 124,745 | 817,735 | 7,113,868 | 2.53 | 21.98 | 24.51 |
(Source: money.co.uk via gov.uk and Norrisweb)
Birmingham is the first council in the top 10 that isn’t in the north of England, listed in eighth place. With a population of over 1.1 million, the Midlands city has by far the largest population of any county council in the top 10. Their council tax support scheme is the lowest in the top 10, at £2.33 per person—a full £1.21 less than that of Liverpool.
Birmingham’s household support fund isn’t as large per person as that seen in the north of England, with £22.34 available to residents of the county. This makes it the highest council assistance package in the Midlands when it comes to council tax support (£25), but lower than that of northern, large metropolitan areas, such as Liverpool and Manchester.
A breakdown of the UK’s lowest performing councils for council tax financial support
| County council / unitary authority | Population | Number of households | Council tax support fund (£) | Household support fund (£) | Council tax support fund per capita (£) | Household support fund estimate per capita (£) | Support funding per capita (£) |
|---|---|---|---|---|---|---|---|
| Wokingham | 177,503 | 69,164 | 103,153 | 1,051,147 | 0.58 | 5.92 | 6.5 |
| Windsor and Maidenhead | 153,496 | 60,932 | 113,299 | 1,175,810 | 0.74 | 7.66 | 8.4 |
| Rutland | 41,049 | 16,694 | 33,919 | 314,742 | 0.83 | 7.67 | 8.49 |
| West Berkshire | 161,448 | 66,658 | 138,468 | 1,389,699 | 0.86 | 8.61 | 9.47 |
| Richmond upon Thames | 195,278 | 80,705 | 220,115 | 1,672,713 | 1.13 | 8.57 | 9.69 |
| Surrey | 1,203,110 | 481,818 | 1,111,933 | 10,581,659 | 0.92 | 8.8 | 9.72 |
| Buckinghamshire | 553,078 | 220,328 | 634,939 | 4,798,381 | 1.15 | 8.68 | 9.82 |
| Bracknell Forest | 124,607 | 50,248 | 128,690 | 1,110,936 | 1.03 | 8.92 | 9.95 |
| Oxfordshire | 725,291 | 288,108 | 778,230 | 6,722,512 | 1.07 | 9.27 | 10.34 |
| South Gloucestershire | 290,424 | 118,101 | 290,245 | 2,820,033 | 1 | 9.71 | 10.71 |
| Leicestershire | 712,369 | 296,408 | 759,096 | 7,240,078 | 1.07 | 10.16 | 11.23 |
(Source: money.co.uk via gov.uk and Norrisweb)
Wokingham, based in the county of Berkshire, offers the least council support for residents. With a population of 177,000, and a council tax support fund of just £103,153, the available help on offer is just £0.58 per person.
Similarly, with a household support fund of a little over £1 million, financial help is restricted to £5.92 per person—£1.74 lower than the fellow Berkshire county of Windsor and Maidenhead. The assistance package on offer from Wokingham County Council is £6.50 per head, which is £1.90 less per person than that of Windsor and Maidenhead.
Rutland County Council has the smallest number of residents of any area within the top or bottom 10, at just over 41,000 people. It also has one of the smallest council tax support budgets seen throughout England, at just under £34,000. This means the per capita tax relief is £0.83—£0.09 more than that of Windsor and Maidenhead.
Likewise, Rutland offers a one-pence increase for household support funds over Berkshire County, at £7.67. The overall assistance per head is £8.49—the third lowest offering throughout the nation.
Surrey has one of the largest populations in all of England’s counties, at a little over 1.2 million people. However, in terms of support on offer from their county council, Surrey comes in 147th out of 152 councils. Their budget of just £1.1 million for council tax support, and £10.5 million for household support, means help per person is £9.72 combined. Therefore, Surrey offers the lowest support for any county with a population of over one million people.
By comparison, neighbouring Hampshire, with a population of 1.4 million people, offers an assistance package of £11.29 per person, while Hertfordshire’s 1.2 million people can access £11.57 for both council tax and household support.
In terms of financial assistance, regarding both council tax and household support, there is a sharp divide between councils across the nation. Aside from outliers such as Hackney and Birmingham, the top 10 councils for financial support all hail from northern England, whereas the councils that offer the least are located in the south (besides Leicestershire and Rutland).
The disparity in terms of available funds is apparent too, with Wokingham’s £6.50 per head a full £21.95 less than that of Liverpool. Leeds, one of the largest cities in the north of England, has £19.53 available per person, whereas York, only a 45-minute drive away, offers just £11.27.
Average salary vs cost of living UK 2023
According to the cost of living statistics from the Joseph Rowntree Foundation, a single person living in the UK in 2023 needed to earn at least £29,500 to reach a minimum, acceptable standard of living. For a couple with two children, this increases to an average combined income of around £50,000.
However, these figures will vary depending on which part of the country you live in, your age, and how many dependents (i.e. children) you have.
Using the Minimum Income Calculator tool, we calculated the least amount of money you need to earn each year to achieve a decent standard of living. Below is a series of tables depicting different living arrangements and scenarios, plus the minimum amount of income needed to sustain a reasonable standard of living in that area.
The average cost of living in the UK by household type - one-person household
| Scenario | Location | Earnings | Net income (per week) |
|---|---|---|---|
| Single person, under the age of 65, living alone with no children | Inner London | £48,035 | £703.84 |
| Outer London | Outer London | £43,889 | |
| Scotland | Scotland | £29,568 | |
| Rest of UK (not London or Scotland) | Rest of UK (not London or Scotland) | £29,541 |
(Source: Minimum Income Calculator UK)
As a single person living in the UK outside of London and Scotland, you will need to earn around £29,541 a year to have a comfortable standard of living. This will give you a weekly income of just under £441 to spend on essential items, such as food, utility bills, and accommodation. These figures are similar for Scotland (£29,568).
However, if you move to London, these figures change considerably. Should you choose to live in Inner London, you’ll need to earn in excess of £48,000 a year to have a decent standard of living, as your expenses could set you back approximately £704 a week. Outer London is slightly more affordable, requiring earnings of £43,889, and more than £450 a week in living costs.
The average cost of living in the UK by household type - single-family households
For a single-parent household, the required salary for a decent standard of living can vary considerably, depending on where you live in the country, how many children you have, and how old they are.
| Scenario | Location | Earnings | Net income (per week) |
|---|---|---|---|
| Single person, under the age of 65, living alone with one child (under the age of one) | Inner London | £63,498 | £959.57 |
| Outer London | Outer London | £71,705 | |
| Scotland | Scotland | £37,267 | |
| Rest of UK (not London or Scotland) | Rest of UK (not London or Scotland) | £41,733 |
(Source: Minimum Income Calculator UK)
UK cost of living stats for a single parent, under the age of 65, living in inner London with a child under the age of one, suggest their annual earnings would need to exceed £63,498 to live comfortably, compared to £71,705 in outer London. By comparison, the same family set up in Scotland would require less than two-thirds of this amount (£37,267), with the cost standing at more than £41,733 for the rest of the UK.
| Scenario | Location | Earnings | Net income (per week) |
|---|---|---|---|
| Single person, under the age of 65, living alone with two children (one of primary school age and one of secondary school age) | Inner London | £44,979 | £874.98 |
| Outer London | Outer London | £47,598 | |
| Scotland | Scotland | £60,424 | |
| Rest of UK (not London or Scotland) | Rest of UK (not London or Scotland) | £49,411 |
(Source: Minimum Income Calculator UK)
Being a single parent with a young child was one of the more expensive scenarios in 2023. By contrast, a single parent with two children (both of school age), saw their required earnings drop to £44,979 for inner London, and just under £48,000 for outer London. This left about £875 and £906 a week, respectively, to live comfortably.
By comparison, the earnings required in Scotland were greater than in London (at approximately £60,424 a year) and just over £49,400 for the rest of the UK. Both of these could give you just over £820 a week to live on, and comfortably support yourself and two children.
While it’s possible to cut the cost of living alone, how much you are bringing in each month is a major deciding factor as to how you coped during the UK cost of living crisis in 2023. These pressures certainly become slightly easier when you introduce a second person (and income) into the equation.
The average cost of living in the UK by household type - coupled, family households
Living as a couple with children will take off some of the pressure, as it is likely you will have two incomes as well as help with childcare. However, for both inner and outer London, a family’s cost of living is considerably higher than in other parts of the UK, with required household earnings of £70,423 and £81,031 a year, respectively for couples with a child under the age of one. Such an income could provide them with between £1,100 and £1,200 to live on each week.
| Scenario | Location | Earnings (joint) | Net income (per week) |
|---|---|---|---|
| Couple, under the age of 65, living together with one child (under the age of one) | Inner London | £70,423 | £1,114.85 |
| Outer London | Outer London | £81,031 | |
| Scotland | Scotland | £44,418 | |
| Rest of UK (not London or Scotland) | Rest of UK (not London or Scotland) | £49,103 |
(Source: Minimum Income Calculator UK)
UK cost of living statistics show that, for those in Scotland, the required annual salary drops by more than a third, to just above £44,400, and about £49,100 for the rest of the UK. This could result in couples having around £946 a week to support themselves and their young child.
| Scenario | Location | Earnings (joint) | Net income (per week) |
|---|---|---|---|
| Couple, under the age of 65, living together with two children (one primary school age and one secondary school age) | Inner London | £57.38 | £1,028.75 |
| Outer London | Outer London | £62,604 | |
| Scotland | Scotland | £55,963 | |
| Rest of UK (not London or Scotland) | Rest of UK (not London or Scotland) | £55,959 |
(Source: Minimum Income Calculator UK)
For a couple with two children of school age, the joint earnings required for a good standard of living is reduced by almost a third for inner London, at a little more than £57,300. For outer London, this figure is almost £63,000. This could supply families with almost £1028.75 and £1073.56 a week, respectively, on which to raise their family and comfortably provide for them.
For Scotland and the rest of the UK, the annual combined earnings required for the same scenario drops to just under £56,000, resulting in just under £943 a week for living expenses in these two areas.
Average cost of living in the UK by household type - retired households
For retired households in the UK, the loss of annual earnings from employment is replaced with a pension, whether that be a state pension, a private pension scheme (such as a self-invested personal pension, or SIPP) or a workplace pension. Most older residents will not have the pressure of providing for their dependents or paying a mortgage by the time they reach retirement age, and therefore the required amount of money needed for a decent standard of living drops significantly, compared to those of working age.
| Scenario | Location | Pension | Net income (per week) |
|---|---|---|---|
| Single person, 65+, living alone with no dependents | Inner London | £25,331 | £440.70 |
| Outer London | Outer London | £25,047 | |
| Scotland | Scotland | £20,453 | |
| Rest of UK (not London or Scotland) | Rest of UK (not London or Scotland) | £20,480 |
(Source: Minimum Income Calculator UK)
UK cost of living stats for a single person aged 65+, and living on their own in inner London, suggest they may need a pension or other earnings of at least £25,331 a year for a decent standard of living. This would give them just over £440 a week to live on. For outer London, the corresponding figure drops by around £300, to just over £25,000, and dips below £20,500 for Scotland and the rest of the UK.
| Scenario | Location | Pension | Net income (per week) |
|---|---|---|---|
| Couple, 65+, living together with no dependents | Inner London | £34,294 | £626.42 |
| Outer London | Outer London | £33,964 | |
| Scotland | Scotland | £27,820 | |
| Rest of UK (not London or Scotland) | Rest of UK (not London or Scotland) | £27,854 |
(Source: Minimum Income Calculator UK)
By contrast, couples aged 65+ and living together with no dependents in inner London may need to have a combined pension of almost £34,300 (about £626 a week) to sustain a decent standard of living. This drops to around £33,964 for outer London (approximately £621 a week to cover living expenses).
For the rest of the UK and Scotland, the combined pension needed is a little more than £27,800 a year, providing them with approximately £527 a week to buy food, pay bills, and live well.
See if you could save money on pension fees by comparing deals from leading pension transfer providers.
The cost of living by household type - average weekly expenditure UK, April 2023
The Minimum Income Standard (MIS) is based on specific budgets, calculated for a range of households and individuals. The table above sets out the budgets for four household types, broken down into various categories of spending.
Since 2022, the MIS has risen considerably for all four groups, increasing by 12.5% for single, working adults and more than 12.3% for pensioner couples. Lone parents with two children have seen the smallest rise, at just under 11%. Adult couples with two children saw their cost of living rise by almost 11.1% in the 12 months to April 2023.
| Category | Single adult, working age | Couple, pensioners | Lone parent with two children (aged 2-4 and primary age) | Couple, two children (aged 2-4 and primary age) |
|---|---|---|---|---|
| Food | £77.21 | £113.36 | £105.21 | £144.86 |
| Alcohol | £8.97 | £12.99 | £5.88 | £11.41 |
| Clothing | £14.99 | £19.03 | £41.50 | £51.16 |
| Water rates | £8.06 | £9.51 | £12.53 | £12.54 |
| Council tax | £20.68 | £27.58 | £24.13 | £32.17 |
| Household insurance | £1.75 | £1.99 | £1.73 | £1.93 |
| Fuel | £40.15 | £43.44 | £58.64 | £61.95 |
| Decorating and maintenance | £2.01 | £2.01 | £2.19 | £2.19 |
| Household goods | £15.83 | £24.43 | £33.06 | £34.08 |
| Household services | £8.93 | £13.24 | £15.02 | £11.07 |
| Childcare | £0.00 | £0.00 | £247.34 | £247.34 |
| Personal goods and services | £28.49 | £57.77 | £40.82 | £54.21 |
| Motoring | £0.00 | £0.00 | £80.53 | £81.86 |
| Travel costs | £34.79 | £20.64 | £16.24 | £44.97 |
| Social and cultural participation | £67.97 | £82.70 | £105.89 | £118.88 |
| Rent | £110.76 | £98.92 | £1-7.58 | £107.58 |
| Total all | £440.59 | £527.62 | £898.31 | £1,020.40 |
| Change since 2022 | 12.50% | 12.30% | 10.90% | 11.10% |
(Source: Minimum Income Calculator)
UK cost of living stats show that the 2023 MIS for a single, working adult in the UK stood at just over £440. If this person were to have two children, the MIS would more than double to £898.31 a week.
A pensioner couple in the UK requires about £528 per week to meet their MIS, whereas a couple with two young children needs nearly twice this much to meet their needs, at £1020.40 a week.
Childcare, unsurprisingly, accounts for the majority of costs for those with children, at 27.5% for single parents and around 24.2% for a couple with two children. For single, working adults, around a quarter of their weekly costs goes towards rent, with food and socialising accounting for 17.5% and 15.4% of expenditure, respectively.
Pensioner couples spend around half the average weekly total of couples with two children (£527.62 vs £1,020.40). The highest percentage of pensioner couples’ weekly costs are attributed to food (21%).
See if you could save money by comparing features and interest rates on the best current accounts available.
Rising UK inflation statistics and interest rates
The Bank of England changes the UK base rate in an attempt to keep inflation as close to 2% as possible.
Increasing rates makes borrowing more expensive and saving more worthwhile - this theoretically means people spend less money, which prevents prices rising. It also affects businesses, meaning pay rises are also pushed lower as businesses spend more of their money paying back any loans they have.
Finally, higher interest rates tend to support the pound, making imports cheaper and pushing down inflation again.
According to the BoE, real household expenditure growth slowed from 0.7% in Q1 2022 to -0.9% in Q3. After increasing to 0.8% in Q1 2023, growth fell to -0.5% in Q3 2023.
The rate of inflation is a measure of how quickly prices have increased within the country. In December 2023, prices rose by 4.2% compared to the previous year – more than double the 2% BoE target for inflation but it was less than half the percentage increase for December 2022 (9.2%)
In an attempt to curb the rate of inflation in the UK, the BoE increased interest rates in August 2022 to 1.75% (having risen from 0.1% in December 2021). On 22 September 2022, interest rates increased by a further 0.5% to 2.25%. This took borrowing costs to their highest level since 2008. The base rate continued to rise throughout 2023, with an increase to 5.25% in August.
The question now is how high will the rates go? Some analysts are speculating that the UK base rate may be cut by the Autumn of 2024 as inflation continues to fall closer to the BoE target of 2%.
Cost of retirement UK statistics
As the UK’s cost of living continues to rise, retired workers require more money to sustain their desired quality of life. The Retirement Living Standards calculate the costs required for retirees to maintain three types of lifestyle - minimum, moderate, and comfortable.
To meet each standard, a single person or couple’s lifestyle must meet the following requirements, as outlined by the Pensions and Lifetime Savings Association:
A breakdown of cost of retirement UK statistics in order for couples to live a minimum, moderate, and comfortable lifestyle
| Couple’s lifestyle | Minimum | Moderate | Comfortable |
|---|---|---|---|
| Joint earnings per year | £19,000 | £34,000 | £54,500 |
| What standard of living could you have? | Cover all of your needs, with some left over | More financially secure and flexible | More financial freedom and some luxuries |
| House | DIY maintenance and decorating one room a year | Some help with maintenance and decorating each year | Replace kitchen and bathroom every 10-15 years |
| Weekly food costs (including eating out) | £96 | £127 | £238 |
| Transport | No car | Three-year-old car replaced every 10 years | Two cars, each replaced every five years |
| Holidays and leisure | UK holidays only (one week-long holiday and one weekend break per year) | Two weeks in Europe and a long UK weekend break each year | Three weeks in Europe every year |
| Clothing and personal costs per person per year | Up to £460 | Up to £791 | Up to £1,300 |
| Helping others (cost per birthday present) | £20 | £34 | £56 |
(Source: Pensions and Lifetime Savings Association)
According to the Pensions and Lifetime Savings Association, in order for a couple to retire and sustain the minimum UK lifestyle, they must be earning at least 19,000 a year between them. This will provide them with all of their needs, around £96 a week for food expenses and around £38 per month each for clothing and personal costs. However, it’s likely that they will not have private transport solely on this income, and will be restricted to two domestic holidays each year.
UK cost of living stats indicate that, in order for the same couple to have a comfortable lifestyle when they retire, then they will need to almost triple their joint income, to £54,500. This will give them two-and-a-half times more per week to spend on food (£238), and they can now begin to think about some luxuries as part of their spending. They can now afford two cars, extended European holidays, and around £108 each per month for personal care and clothing.
A breakdown of cost of retirement UK statistics in order for single people to live a minimum, moderate, and comfortable lifestyle
| Single person lifestyle | Minimum | Moderate | Comfortable |
|---|---|---|---|
| Earnings per year | £12,800 | £23,300 | £37,300 |
| What standard of living could you have? | Cover all of your needs, with some left over | More financially secure and flexible | More financial freedom and some luxuries |
| House | DIY maintenance and decorating one room a year | Some help with maintenance and decorating each year | Replace kitchen and bathroom every 10-15 years |
| Weekly food costs (including eating out) | £54 | £74 | £144 |
| Transport | No car | Three-year-old car replaced every 10 years | Two-year-old car, each replaced every five years |
| Holidays and leisure | UK holidays only (one week-long holiday and one weekend break per year) | Two weeks in Europe and a long UK weekend break each year | Three weeks in Europe every year |
| Clothing and personal costs per person per year | Up to £580 | Up to £791 | Up to £1,500 |
| Helping others (cost per birthday present) | £20 | £34 | £56 |
(Source: Pensions and Lifetime Savings Association)
The UK cost of retirement statistics for a single person suggest that annual take home for a minimum standard of living once retired needs to be at least £12,800 a year. This figure almost doubles to £23,300 for a moderate lifestyle, and triples for a comfortable lifestyle (£37,300).
Similar to the cost of retirement statistics for a typical UK couple, £12,800 a year for a single person in the UK will cover their basic living costs when they retire. This will provide around £54 a week for food expenses and about £48 a month for personal costs However, it’s unlikely to cover the cost of running a private vehicle, and holidays will be restricted to short, domestic trips.
On £37,300 a year, a typical UK single retiree can live a comfortable lifestyle. This gives them more financial freedom, and they can start incorporating some luxuries into their lifestyle. This allows them to spend around £144 a week on food and afford a two-year-old car that can be replaced every five years. Personal expenditure allowance now also triples to £125 a month and holiday destinations can be explored further afield into Europe for up to three weeks a year.
A breakdown of cost of retirement UK statistics 2022 based on the Retirement Living Standards categories
| Retirement living standard | Cost for one person in 2021 | Cost for one person in 2022 | Increase from 2021 (%) | Cost for couple in 2022 |
|---|---|---|---|---|
| Minimum | £10,900 | £12,800 | £16,700 | £19,900 |
| Moderate | £20,800 | £23,300 | £30,600 | £34,000 |
| Comfortable | £33,600 | £37,300 | £49,700 | £54,500 |
(Source: Pensions and Lifetime Association)
The latest UK cost of living statistics found considerable rises in the expenditure required to meet each retirement living standard.
Couples planning to retire with the minimum retirement living standards faced the highest rises, with their required expenditure increasing 19% from last year to £19,900. Single people looking to meet the same standard of living faced rises of around 17% (£10,900 to £12,800.)
The price rises for retirees in the moderate category were slightly lower, with required expenditure for couples rising by 13% and 12% for individuals.
Couples in the comfortable living standard category faced the smallest price hikes, with the rise to £54,500 just under 10% higher than the required costs for 2021. Individuals in the same category faced expenditure increases of 11%.
These findings suggest that retirees with less money are disproportionately affected by the cost of living crisis than those with higher disposable income.
Retire more comfortably by reading our expert guide on how to manage your pension fund.
Average personal debt UK
At the end of November 2023, people in the UK collectively owed more than £1.847 trillion. This is £18.8 billion more than November 2022 – an extra £353.46 per UK adult across the year.
Simply writing off your debts is certainly no easy task. According to figures from The Money Charity, the average total debt per UK household in November 2023 was £65,795, with unsecured debt of around £4,163 per UK adult. In terms of net lending to individuals and housing associations, this grew by £769 million in November 2023 compared to the previous month, with borrowers paying £195 million a day in interest during November.
A breakdown of key average personal debt UK statistics for 2023

As of November 2023, the average UK household debt, as a percentage of people’s earnings, stood at 100.5%. This meant people were borrowing more than they could afford to pay back in a year - even if they spent nothing on anything else at all.
Dealing with debt can be a daunting task. The Citizens Advice Bureau (CAB) reported handling an average of 1,006 debt-ralated issues or enquiries per day in December 2023, a decrease of around 53% from December 2022.
According to our debt index, this is not felt evenly across the country either. Those in Southampton, for example, have almost three times as much personal debt, on average, as those in Nottingham (a rise of 740% between 2020-21). On the other hand, those in Brighton, who have seen a 61% decrease in their personal debt across the same period.
Visit our loans guides section for expert advice on secured and unsecured loans, bridging loans, and top tips before you borrow.
Credit card debt UK statistics
Cutting credit card borrowing costs is one of the ways that can help you become debt free faster. However, during the UK cost of living crisis, more and more people are turning to credit cards as a way of sourcing additional money. Recent years have also seen an increased prevalence of cards aimed specifically at those experiencing cash flow problems, like credit cards for bad credit and instant decision credit cards.
Credit card statistics for 2023 indicate that at the end of November, outstanding consumer credit lending was more than £221 billion. This is an increase of £1.67 billion from October 2023 and £14.4 billion more than the same time in 2022.
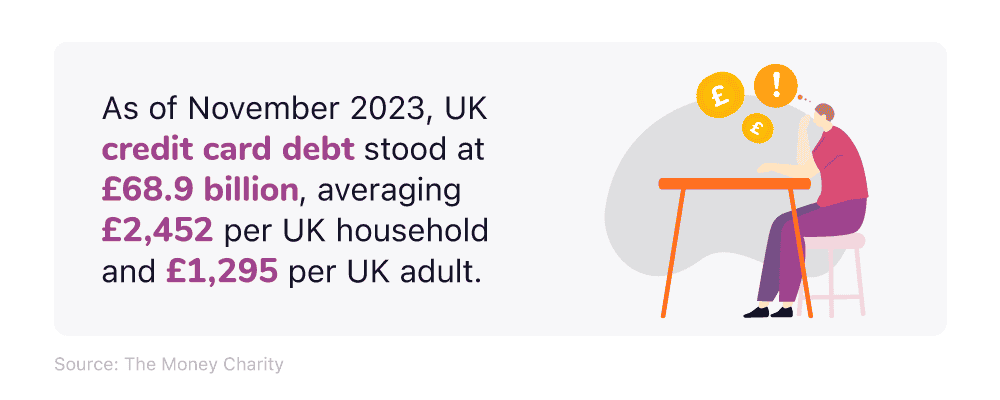
In terms of UK credit card debt statistics, the November 2023 figure stood at £68.9 billion – this works out at £2,452 per UK household, and £1,295 per UK adult. UK Finance figures show that over half (51.2%) of credit card balances were accumulating interest in October 2023.
By making only the legal minimum repayments (interest plus 1% of the outstanding balance) each month, the average credit card debt, on mid-rate interest rate, would take 26 years and 8 months to clear.
The ONS also found that 18% of people living in deprived areas of the UK reported using some form of credit in 2022, whether that be credit cards, unsecured loans, secured loans, or bank overdrafts. Conversely, the percentage of people using credit in the least deprived parts of the country fell to 8%, while the proportion for England as a whole was 13%.
Moving your credit card debt to a card charging 0% interest on balance transfers can see your monthly repayment costs drop. Similarly, moving overdraft debt to a card offering 0% interest on money transfers can be an effective way to reduce your outlay.
By comparing credit card offers available on the market, this will ensure you find one that is right for you, and your circumstances.
Control how much you spend by checking out the rates on the best prepaid credit cards today.
Insolvency statistics and bankruptcy statistics UK 2022
In terms of UK insolvency statistics, there were more than 24,418 individual insolvencies in England and Wales – a decrease of more than 6% from Q2 2023 and down 15% from Q3 2022.
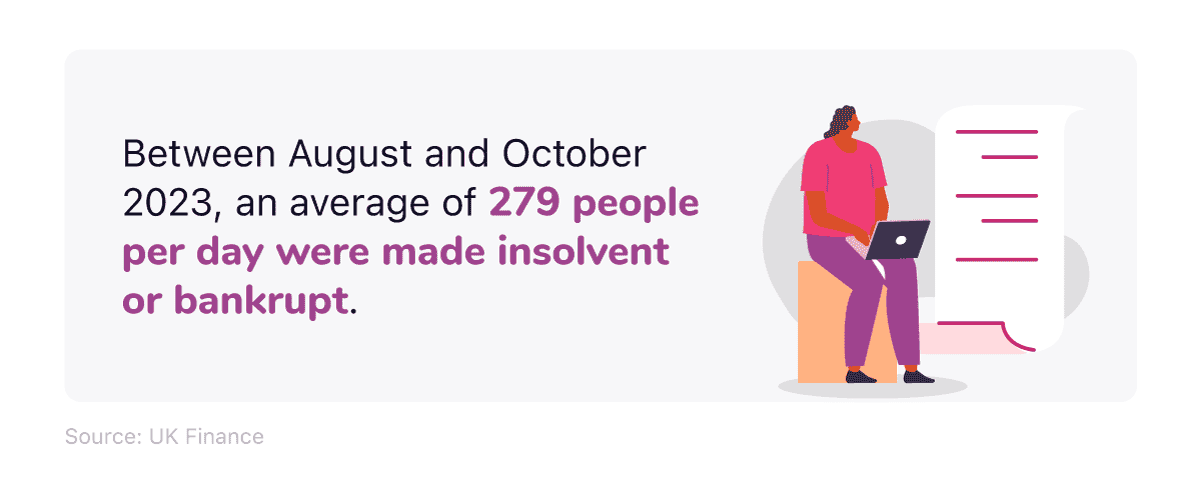
According to UK bankruptcy statistics from The Money Charity, 279 people a day across England and Wales were declared either insolvent or bankrupt in the time between August and October 2022 – the equivalent of one person every five minutes and 10 seconds. Comparative figures highlighted 22.3 insolvencies a day in Scotland, and four a day in Northern Ireland.
In the 12 months to Q3 2022, nearly 108,000 individuals became insolvent across England and Wales – roughly 0.23% of the population, or one in every 441 UK adults. By comparison, in Northern Ireland, there were 376 in Q3 2023 alone, with 2,074 in Scotland between October and December 2022.
UK county court judgement statistics for debt
Between October and December 2022, almost 2,000 daily consumer county court judgements (CCJs) were issued in England and Wales— a 4% decrease on the same period last year. According to the Registry Trust Ltd, the average value was around £5,900 per individual case.
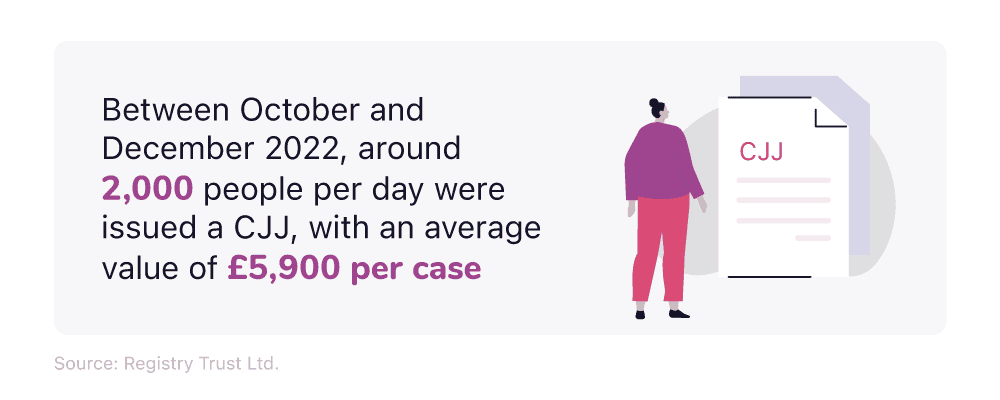
In contrast, UK county court judgement statistics indicate there were 11 a day in Northern Ireland, with an average value of over £3400, and 56 a day in Scotland, at an average of £2,967, during the same period.
UK unemployment statistics and UK redundancy statistics 2023
Employment figures varied in the UK between May 2023 and July 2023. Of all people aged over 16, nearly 32.9 million were in some form of work in the UK. This represents a 207,000-person decrease from the three months prior (February to April) but a rise of 135,000 from the same time in 2022.
The employment rate as a percentage of the UK population stands at 75.5% – a fall of 0.5% from the previous quarter. Over a fifth (21.1%) of all applicable UK residents were listed as ‘economically inactive’ (an increase of 0.1% over the three months prior, but a fall of 0.6% from one year before).
A breakdown of UK unemployment statistics (May-July 2023)
| Level or Rate | Change on previous three-month period | Change on year | Change since December 2019 to February 2020 | |
| Employment (000s, aged 16 years and above) | 32,882 | -207 | 135 | -191 |
| Employment rate (aged 16 to 64 years) | 75.50% | -0.5pp | +0.1pp | -1.1pp |
| Unemployment (000s, aged 16 years and above) | 1,464 | 159 | 240 | 100 |
| Unemployment rate (aged 16 years and above) | 4.30% | +0.5pp | +0.7pp | +0.3pp |
| Economically inactive (000s, aged 16 to 64 years) | 8,780 | 63 | -231 | 411 |
| Economic inactivity rate (aged 16 to 64 years) | 21.10% | +0.1pp | -0.6pp | +0.9pp |
| Total weekly hours (millions) | 1,040.00 | -18.5 | -1.3 | -12.2 |
| Redundancies (000s, aged 16 years and above) | 102 | 10 | 39 | -4 |
| Redundancy rate (per thousand, aged 16 years and above) | 3.6 | 0.3 | 1.3 | -0.3 |
(Source: ONS)
The UK’s unemployment rate (i.e. those who are of working age and actively seeking employment) was 4.3% in Q2 2023. This is an increase of 0.5% from the previous quarter and a rise of 0.7% from the same time in 2022. In terms of quantity, 1.464 million people within the UK are looking for employment, 159,000 more than in the previous quarter.
The number of redundancies in the three months leading to July 2023 stood at 102,000 – up 10,000 from three months earlier and 39,000 from May to July 2022.
It’s important to add, however, that unemployment figures only take account of the number of people not in work who are actively looking for it. People who are unable to work—for example, through long-term sickness—are instead classed as “economically inactive”.
UK unemployment statistics 2023
England’s overall employment rate surpassed the UK average of 75.5%, with 75.8% of working-age people employed in the period from May to July 2023 – a fall of 0.7% from the previous quarter.
The latest data figures from Scotland show an employment rate of 75.1% – 0.4 percentage points lower than the UK average and 0.7 lower than that of England. Wales has an employment rate of 74%, whereas Northern Ireland has the lowest rate, at 71.1%.
However, while England’s employment rate fell between Q1 2023 and Q2 2023, Scotland saw an increase of 0.5% while Wales experienced a 2.1% rise. Northern Ireland’s employment rate fell 1.3% over this period.
A breakdown of UK employment and unemployment statistics by region February-April 2023
| Employment rate (%) aged 16 to 64 years | Change from May to July 2022 | Unemployment rate (%) aged 16 years and over | Change from February to April 2023 | Inactivity rate (%) aged 16 to 64 years | Change from February to April 2023 | |
|---|---|---|---|---|---|---|
| UK | 75.5 | -0.5 | 4.3 | 0.5 | 21.1 | 0.1 |
| Great Britain | 75.6 | -0.5 | 4.3 | 0.5 | 20.9 | 0.1 |
| England | 75.8 | -0.7 | 4.3 | 0.5 | 20.7 | 0.3 |
| North East | 74.1 | -0.3 | 5.2 | 1.6 | 21.9 | -0.8 |
| North West | 73.6 | -1.7 | 5.3 | 2.3 | 22.2 | -0.3 |
| Yorkshire and The Humber | 74.3 | -0.1 | 2.9 | -0.9 | 23.5 | 0.8 |
| East Midlands | 76 | 0.2 | 4.1 | 0.7 | 20.6 | -0.8 |
| West Midlands | 75.1 | -0.4 | 5 | 0.1 | 20.8 | 0.3 |
| East | 77.2 | -1.2 | 4.3 | 0 | 19.2 | 1.3 |
| London | 73.5 | -2.1 | 4.8 | 0.3 | 22.7 | 2 |
| South East | 79.6 | 1 | 3.9 | 0.2 | 17.1 | -1.2 |
| South West | 77.5 | -0.9 | 3.6 | 0.5 | 19.5 | 0.6 |
| Wales | 74 | 2.1 | 3.8 | -1.1 | 23.2 | -1.2 |
| Scotland | 75.1 | 0.5 | 4.3 | 1.2 | 21.4 | -1.5 |
| Northern Ireland | 71.1 | -1.3 | 2.7 | 0.3 | 26.9 | 1.1 |
(Source: ONS)
England employment statistics by region
The South East of England has the best market in England for employment. According to Q2 2023 data, almost four-fifths (79.6%) of all employment-age people have a job in the region, a 1% increase from the previous quarter.
The South East also had the lowest economic inactivity rate at 17.1%, a fall of 1.2% since Q1 2023. Northern Ireland had the lowest unemployment rate at just 2.7% – up 0.3% from the previous quarter.
In London, the employment rate stands at 73.5%, the lowest of any region or nation across the UK. In Q1 2023, however, that figure was 2.1% higher, showing a substantial decrease in employment has occurred.
The highest unemployment rate was found in the North West, with the region’s total of 5.3% representing a 2.3% increase from the previous quarter. The North West was followed by the North East, which had an unemployment rate of 5.2% – a 1.6% increase from the previous quarter.
Rising cost of living and inflation 2023 in the UK
According to UK cost of living stats, falling petrol prices have largely contributed to pushing the UK’s inflation rate back below 5% in December 2023, as upward pressure from the rising cost of living continues.
A breakdown of UK rising cost of living and inflation statistics 2023-24
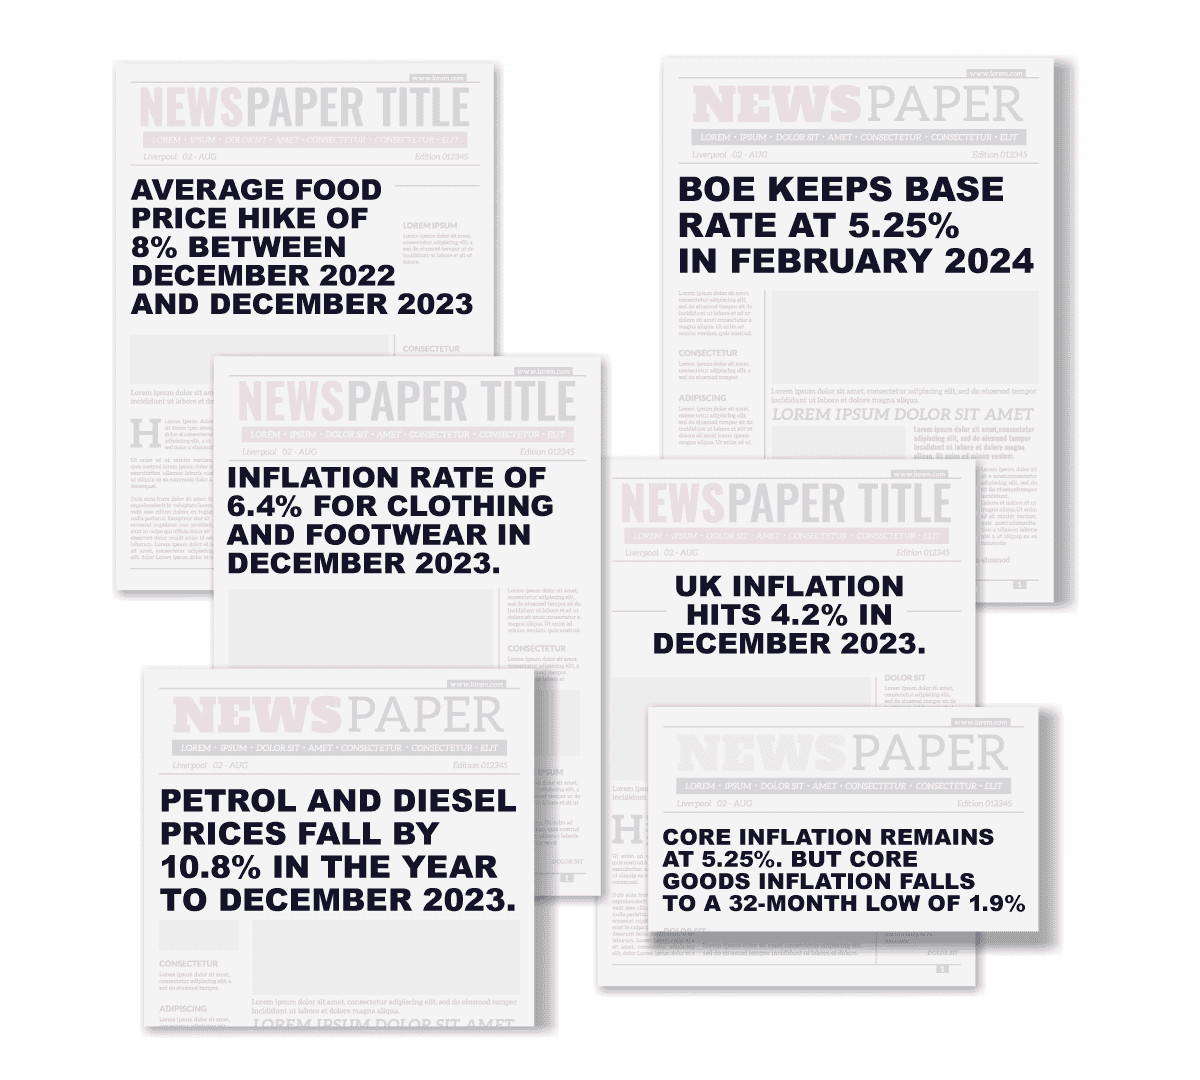
Some noticeable trends that have occurred throughout 2023-24 include the following:
Overall, the annual inflation rate for motor fuels fell to -10.8% in the year to December 2023, down from +11.5% in December 2022. The motor fuel inflation rate has tumbled overall, after going as high as +43.7% in July 2022.
The average price increase was 8% for all UK food items in the year to December 2023 – the lowest rise since April 2022
The annual inflation rate for clothing and footwear stood at 6.4% in December 2023 – up from 5.7% in November 2023
The CPI rose year on year to 4% in December 2023, up from 3.9% the previous month.
The current rate of UK inflation stands at 4.2%, recorded in December 2023. This figure is more than double than the official 2% target, which was last achieved in July 2021.
Core inflation – which removes energy, food, alcohol, and tobacco costs from the calculation, and is monitored by the Monetary Policy Committee (MPC) – stood at 5.25% in December 2023, unchanged from the previous month. Core goods inflation fell to 1.9% – the lowest since April 2021. Services inflation remained unchanged at 6%.
How inflation is measured in the UK
Inflation, as measured by the ONS, is based on the cost of a representative basket of goods and services for the average UK consumer. It’s produced by collecting the price of more than 700 goods and services each month, across the country and online. In total, approximately 180,000 individual prices are collected as part of this measure.
UK inflation and rising interest rates will vary between individuals and across different locations within the UK, depending on their spending habits, and the price they pay for various goods and services.
This year, the ONS is beginning to increase the number of prices it collects, from 180,000 to many millions each month, to allow for a more detailed insight into the changing landscape of UK inflation.
ONS inflation calculator
If you would like to find out how these changes are impacting you, the ONS inflation calculator will help show how the rising cost of living and inflation in the UK has affected your household in the past year.
UK Consumer Price Index (CPI) inflation rates 2023
What is the consumer price index (CPI)?
The Consumer Price Index (CPI) is an indicator that measures the change over time in the general cost of goods and services. It’s not a direct measure of the cost of living, as it doesn’t measure all price changes in the economy, and only reflects the end purchasing price for the consumer.
However, despite these limitations, it does indicate the rate of inflation, and a general overview of how much more or less expensive things are in a country over a given time period.
How has the consumer price index (CPI) changed in the UK over time?
In December 2023, the UK CPI inflation rate stood at 132.2. Throughout 2023, the CPI has gradually increased from as low as 126.4 in January to its peak rate in December.
A breakdown of how UK consumer price inflation rates have changed between 2021-23
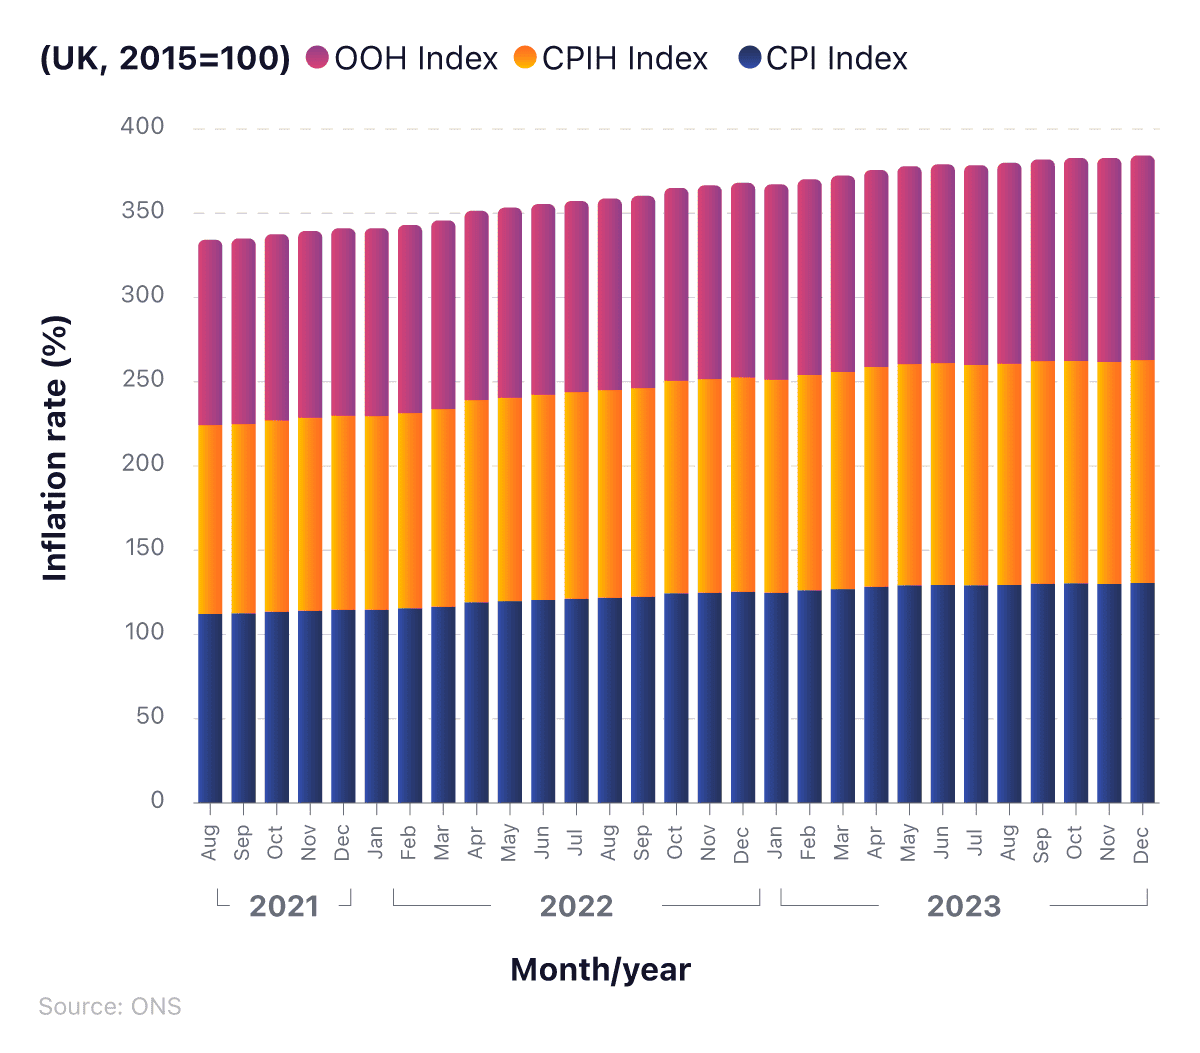
The 12-monthly CPI rate for December 2023 stood at 4% – a 0.1 percentage point rise from November 2023 (3.9%) but a 6.5 percentage point fall from December 2022 (10.5%).
Throughout 2023, UK monthly CPI inflation rate changes fluctuated between -0.6% and +1.2%, with the latest figure of 0.2% in December representing a 0.6 percentage point rise from the previous month.
By comparison, the CPIH is a more comprehensive measure of price changes over time, as it includes Owner Occupiers’ Housing Costs (OOH)—i.e. any costs associated with running a home. During 2023, the CPIH rose from 124.8 in January to 130.5 in December, with the 12-month rate falling from 8.8% to 4.2% over this period.

The OOH also increased in 2023, but not as much by comparison to the CPI or CPIH. The rate rose from 115.9 in January to a high of 121.6 in December. In this same period, the 12-month rate increased from 3.9% to 5.3%.
A breakdown of UK CPI inflation rates between 2012 and 2023
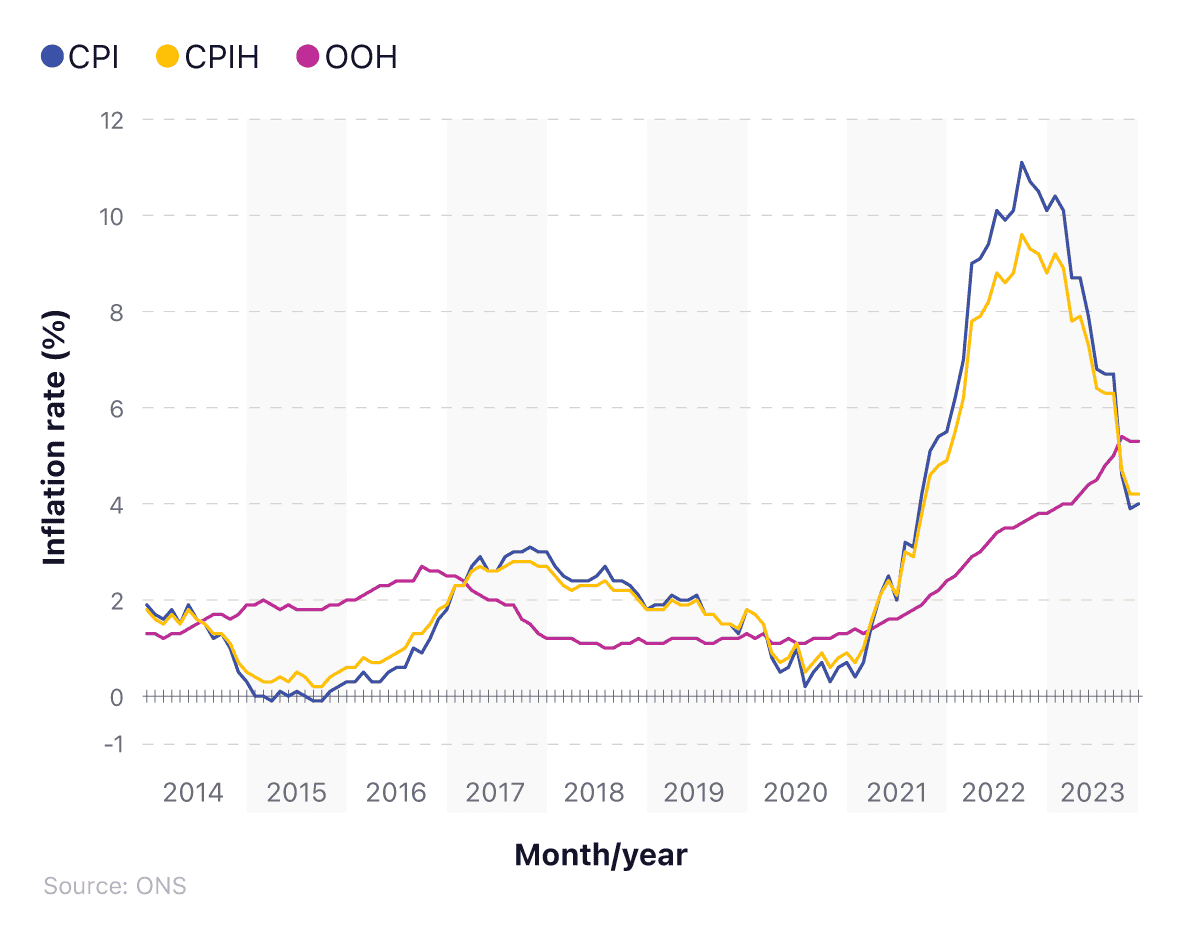
The recent spike in CPI and CPIH is not indicative of the long-term trends for the UK. Between August 2012 and July 2021, both experienced fluctuations between 0% and 2.3%. CPI values dropped slightly into the negative for September and October 2015, but were restored once again thereafter. During the same period, CPIH dropped to its lowest at 0.2%.
Up until March 2022, the OOH rate has steadily alternated between 0.1% and 2.7%, after which it steadily increased to its peak of 3.5% in August 2022.
Since then, CPIH has fluctuated, reaching a peak of 9.6% in October 2022 before falling throughout 2023. The UK CPI inflation rate also reached its peak in the same month at 11.1%, but this figure has reduced consistently, reaching 4% in December 2023. The OOH rate is far more stable by comparison, but has been slowly rising since September 2022 from 3.5% to 5.4% in November 2023, before dropping back marginally to 5.3% in December 2023.
A breakdown of UK CPI inflation rate changes for transport and motor fuels between 2013 and 2023
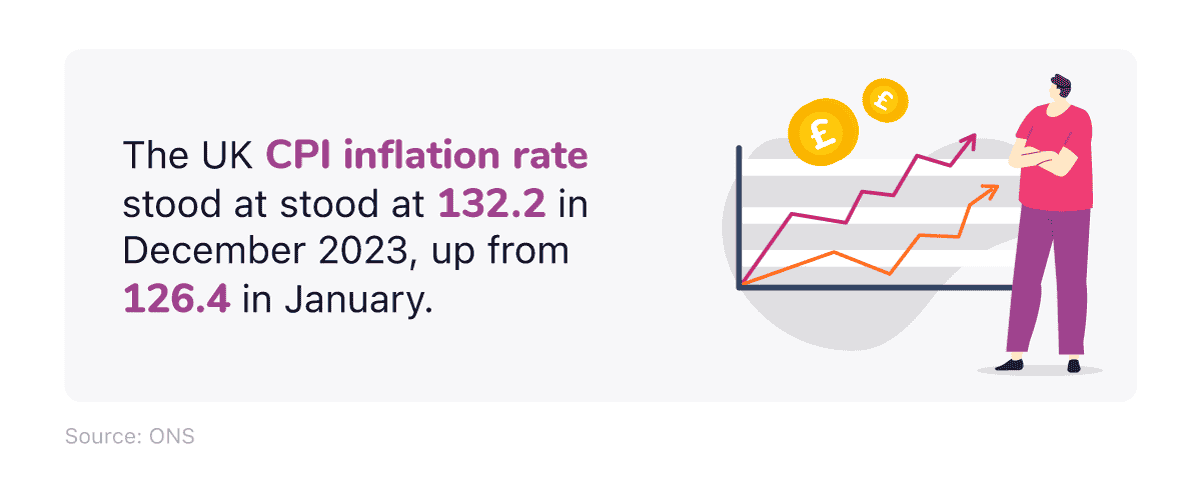
Since August 2012, the 12-monthly motor fuel inflation rate has experienced a large degree of volatility, dipping to -16.6% and -16.7% in February 2015 and May 2020 respectively.
September 2013 to August 2016 saw a period of almost three years with fluctuating negative motor fuel inflation rates, compared to the same time the previous year.
From March 2021, there was a relatively fast upward trend, growing from 3.5% to a peak of 43.7% in July 2022. As of August 2022, the rate for motor fuel stood at 32.1%. Since then, this rate has decreased considerably month-on-month, falling from 26.5% in September 2022 to just 7.7% in January 2023.
The drop continued throughout 2023, falling below 0 in March (-0.5%) before reaching a low of -24.9% in July. The most recent rate of -10.8% for December 2023 represents a month-on-month fall of 0.2%.
By contrast, the inflation rate for transport in the UK has kept broadly in line with the general rate for CPIH, ranging from -2.8% in January 2015, to 6.6% in February 2017.
The rate gradually increased from 7.3% in June 2021 to a height of 15.2% some 12 months later. In August 2022, the rate dropped slightly, to 12.4%, before decreasing in line with the rate for motor fuels. The rate would drop significantly throughout 2023, falling from 3.4% in January to -1.3% in December.
Are you a driver looking to save during the cost of living? Use our comparison tool to find the best deals on car insurance, breakdown cover, gap insurance, and many other motor insurance plans.
A breakdown of the UK CPI inflation rate changes for food and non-alcoholic beverages between 2014 and 2023
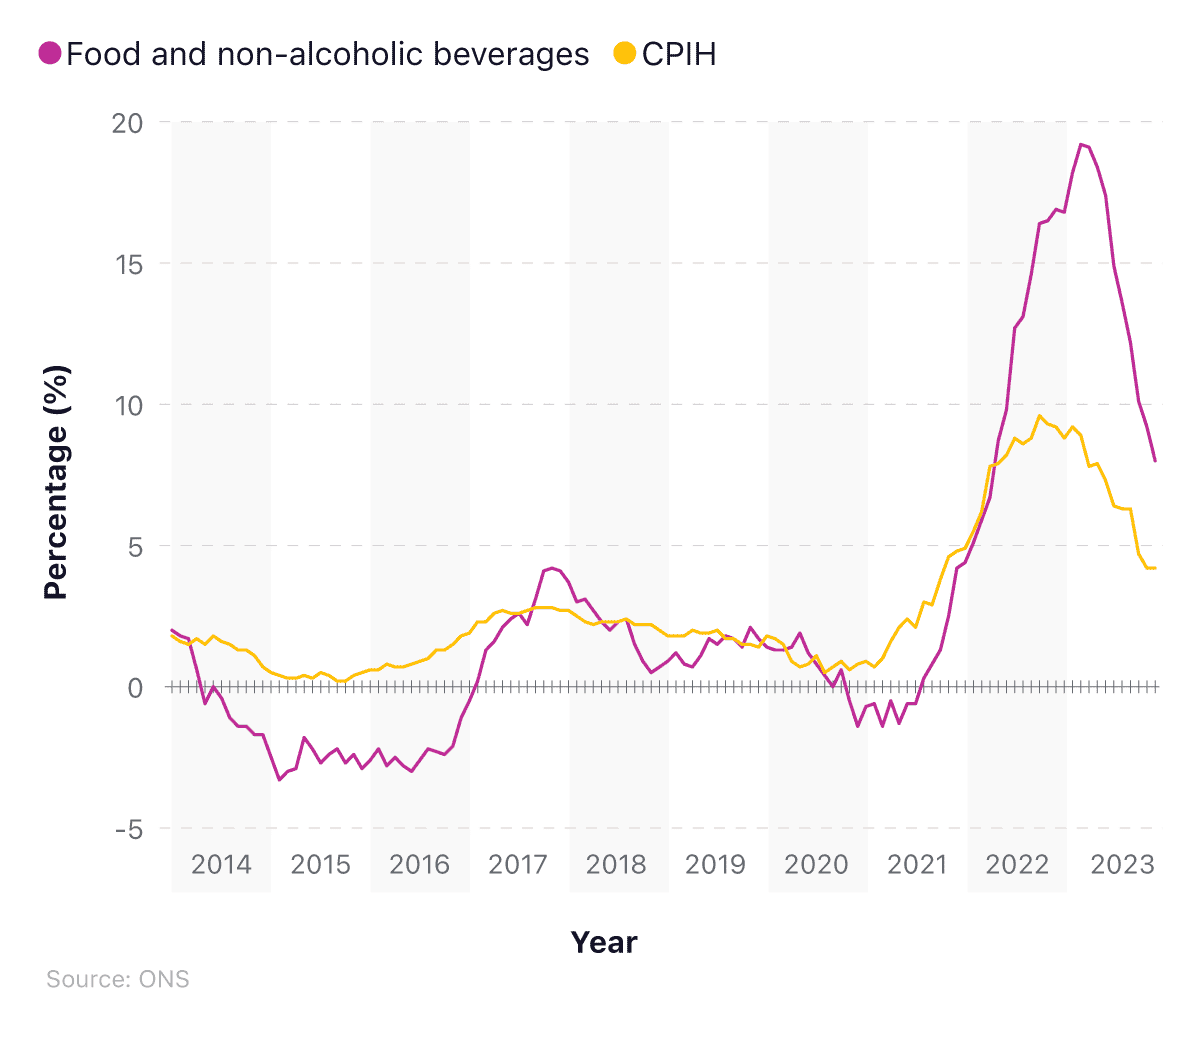
The food and non-alcoholic inflation rate for the UK fluctuated over the last decade. Between August 2012 and April 2014, this rate remained positive, alternating between 0.6% and 4.6%.
However, May 2014 to January 2017 saw a period of negative 12-monthly change, ranging from -0.5% in January 2017, to -3.3% in February 2015. Positive growth resumed up until October 2020, after which a period of nine months saw a negative change for the first time since the start of 2017. From August 2021, the rate skyrocketed, reaching 13.1% in August 2022. These rises peaked at 19.2% in March 2023, before falling throughout the rest of the year. The latest rate of 8% for December 2023 is the lowest recorded since April 2022.
A breakdown of UK inflation statistics for goods, services, and CPIH (excluding energy, food, alcohol, and tobacco) between 2013 and 2023
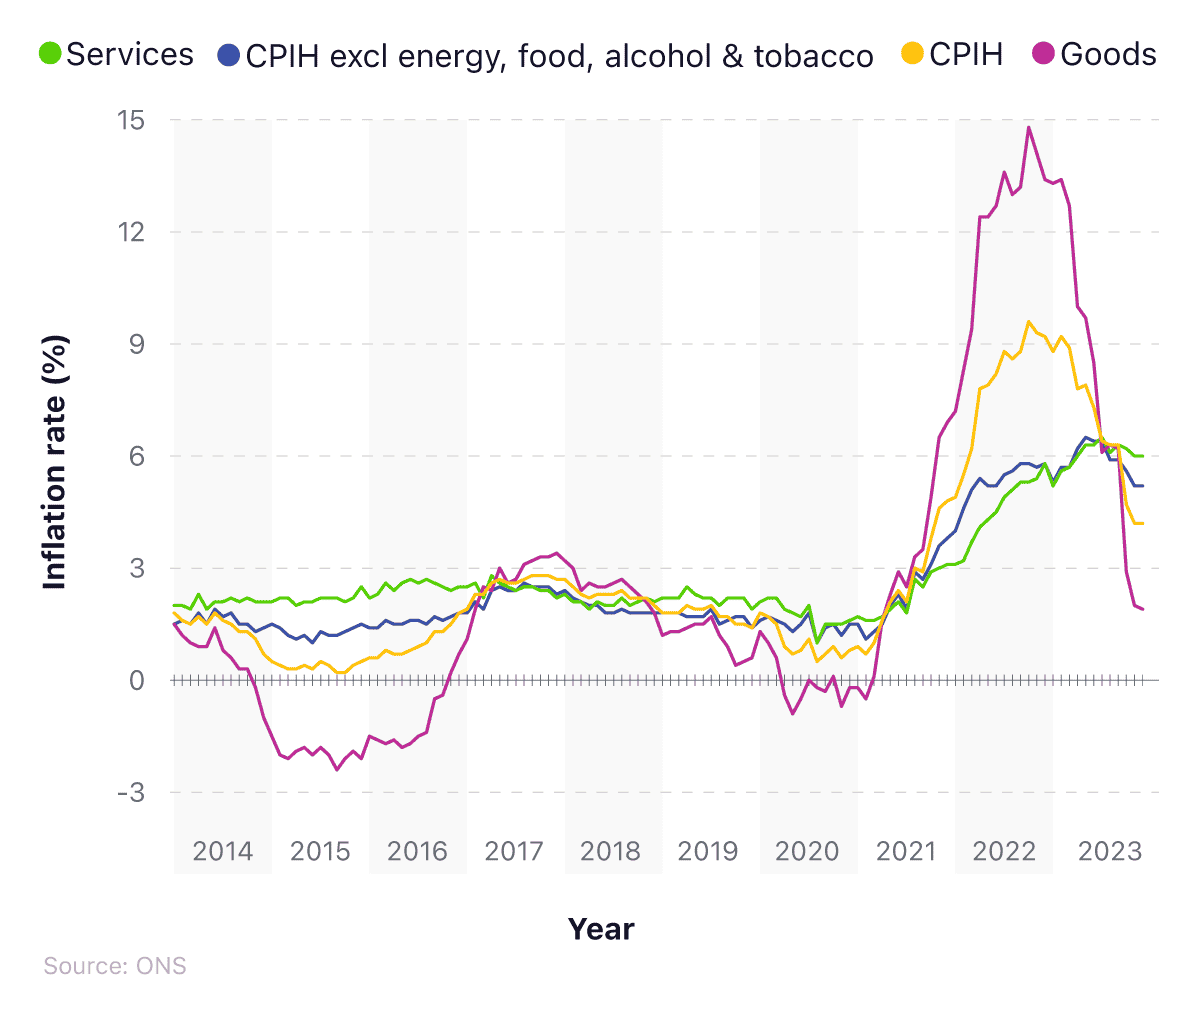
The inflation rate for UK services has remained relatively stable over the past decade. Between August 2012 and October 2021, the rate generally remained somewhere between 1.9% and 2.9%, despite dropping to a low of 1% in August 2020. From November 2021, it rose from an initial peak of 3% in November 2021, to a second peak of 5.1% in August 2022. Since then, this rate has slowly risen from 5.3% in September 2022 to 5.8% in December 2022.
In January 2023, the rate dropped to 5.2%, before increasing to 6.5% in July. As of December 2023, the inflation rate for UK services stood at 6% for the second month in a row.
For UK goods, the inflation rate has been slightly more turbulent. Since August 2012, this rate has largely remained positive, with a sustained period between November 2014 and October 2016, where numbers dropped into negative values—the lowest point being -2.4% in September 2015.
UK cost of living stats show that, since March 2021, the rate of inflation on UK goods has remained positive, growing from 0.1% in the same month to a height of 13.6% in July 2022. As of August 2022, the 12-monthly rate stood at 13%.
Despite rising to a high of 14.8% in October 2022, this rate has subsequently decreased, reaching 13.3% in January 2023, before falling further throughout 2023 to arrive at 1.9% in December – the lowest rate since April 2021.
A breakdown of the contributions from UK households to the annual CPIH inflation rate between 2020 and 2023
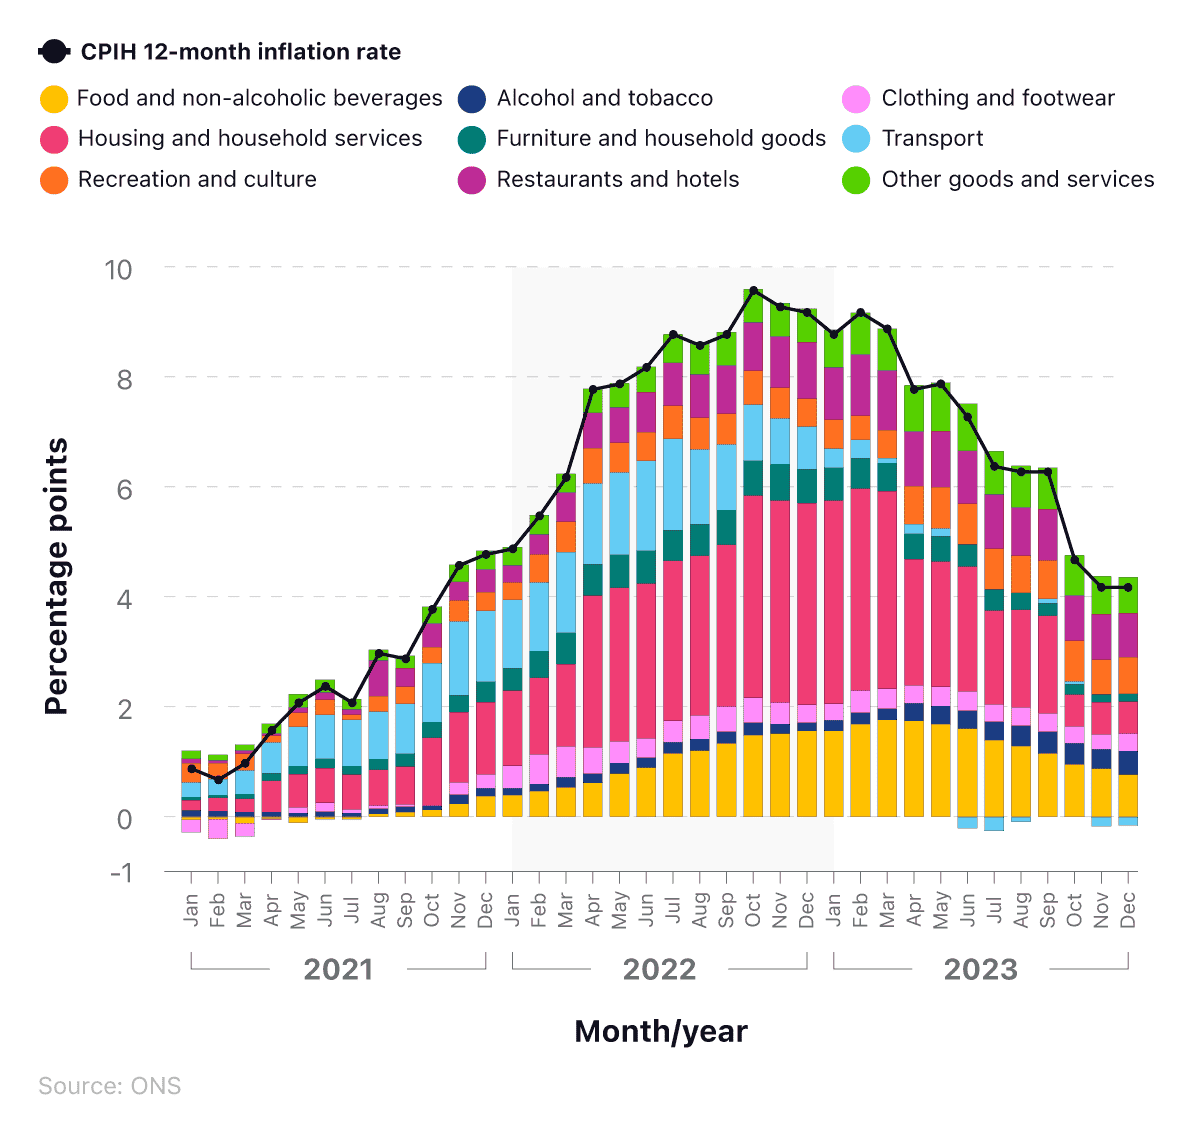
The CPIH rate increased dramatically since August 2020, from 0.5% to a peak of 8.8% in July 2022. In August 2022, it dropped slightly to 8.6%. Since then, it rose up to a peak of 9.6% in October 2022, before falling again to 8.8% in January 2023. This figure would continue to fall throughout 2023, reaching lows of 4.2% in December.
As of December 2023, the biggest contributor towards the UK’s 12-month CPIH rate of 4.2% was restaurants and hotels, with a total of 0.8 percentage points. This was followed by food and non-alcoholic beverages (0.76), then recreation and footwear (0.67).
Between December 2021 and September 2023, the largest contributor to the UK’s CPIH 12-monthly inflation rate was housing. However, this decreased significantly towards the end of 2023, going from 1.77 percentage points in September to just 0.58 in December.
The vast majority of contributions across all categories have largely been positive, with some notable periods of negative change.
Between August 2020 and April 2021, clothing and footwear dropped into negative values, with a low of -0.35 percentage points in the 12-monthly inflation rate. Since then, it has remained in positive values, reaching a peak of 0.57 in March 2022.
Similarly, between November 2020 and July 2021, food and non-alcoholic beverages dipped into the negatives, reaching a low of -0.11 percentage points in December 2020 and March 2021. Since July 2021, this has been restored to positive values, reaching a height of 2.19 in March 2023 before falling below 1 by December. Transport’s contribution of -0.15pp in December 2023 was the second consecutive month the sector had recorded a negative value.
A breakdown of contributions to changes in annual CPIH inflation rate between November 2023 and December 2023
| Percentage points | |
|---|---|
| Food and non-alcoholic beverages | 0.09 |
| Alcohol and tobacco | 0.04 |
| Clothing and footwear | 0.03 |
| Housing and household services | 0.01 |
| of which owner occupiers housing costs | 0.01 |
| Furniture and household goods | 0 |
| Health | 0 |
| Transport | 0 |
| Communication | 0 |
| Recreation and culture | -0.01 |
| Education | -0.03 |
| Restaurants and hotels | -0.04 |
| Miscellaneous goods and services | -0.11 |
UK cost of living stats show that, between November 2023 and December 2023, the largest positive contribution made to the annual CPIH inflation rate was from food and non-alcoholic beverages, at 0.09 percentage points. This is followed by alcohol and tobacco (0.04), then clothing and footwear (0.03).
Significant negative contributions were experienced from restaurants and hotels and miscellaneous goods and services at -0.04 and -0.11 percentage points, respectively.
A breakdown of the contribution of housing components to the annual UK CPIH inflation rate between 2016 and 2023
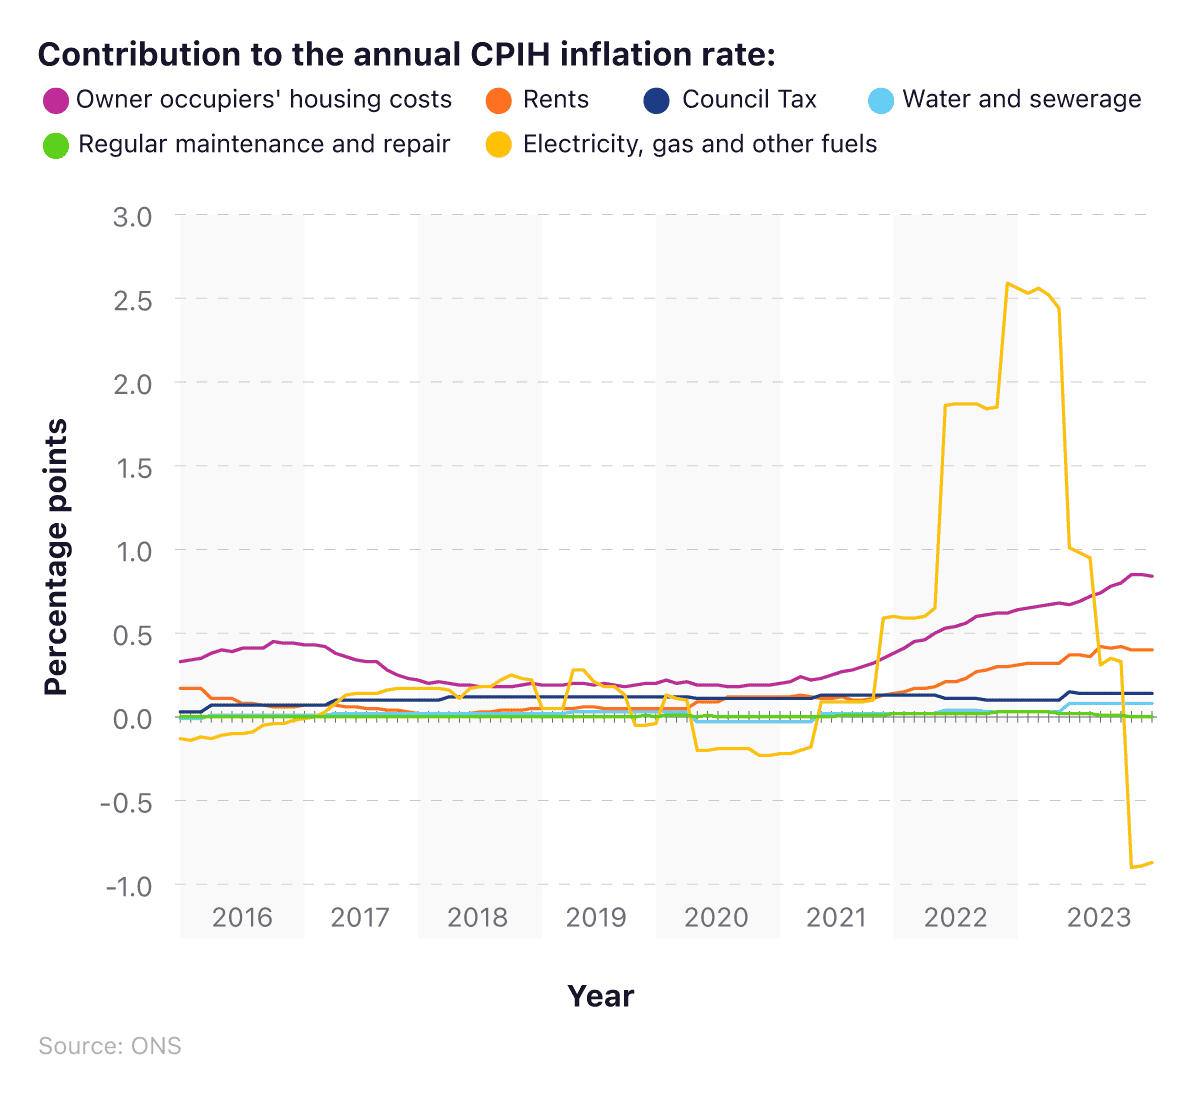
Between October 2021 and June 2023, the largest contributor to the annual CPIH inflation rate for housing has been electricity, gas, and other fuels. In August 2022, this was 1.84 percentage points for that month, compared to just 0.03 in March 2017. By January 2023, the respective figure 2.56.
Since the summer of 2023, the contribution of electricity, gas, and other fuels has fallen consistently, accounting for just 0.31percentage points in July, before hitting negative values in October (-0.9 percentage points). The latest value of 0.87 for December 2023 marks the third consecutive month electricity, gas, and other fuels have recorded a negative value.
The biggest housing-related contributor to the CPIH December 2023 was occupiers’ housing costs (OOH) at 0.84 percentage points. Additionally, this was the sixth consecutive month that occupiers’ housing costs were the biggest contributor to housing inflation.
Impact of rising cost of living and inflation on UK households
According to an ONS survey from January 2024, more than half (52%) of adults in Great Britain reported an increase in their cost of living within the last month.
For those who stated their cost of living had risen, the most common reasons given were:
Increased price of food shopping (90%)
Rising energy bills (85%)
Increased cost of fuel (41%).
Of those surveyed in January 2024, over four in 10 (39%) claimed they found it very or somewhat difficult to afford their energy bills – down from 49% in May 2023.
A breakdown of actions taken by UK adults to cope with the cost of living crisis (17th-28th January 2024)

According to an ONS study, around three in five adults (62%) have said they’ll be cutting back on their cost of living by reducing any non-essential spending, while more than two in five (45%) will be aiming to use less energy in their homes.
Four in 10 (40%) said they were spending less on food shopping and essentials, with just over half (51%) claiming they’d be shopping around more in an attempt to reduce costs.
Additionally, three in 10 (30%) respondents said they’d be cutting back on non-essential journeys in their private vehicles, with over a quarter (28%) saying they’ll use their savings account as a way to fund the rising cost of living in the UK.
18% have opted for additional sources of credit, such as credit cards, loans, and/or overdrafts, as a way of funding these additional costs, with over one in 10 (11%) saying they’ll not be doing anything different in the face of a cost of living crisis.
Compare rates on cash isas, instant access accounts, fixed rate bonds, and many other savings accounts using our easy comparison tool.
Buy now pay later statistics UK 2022
Buy now pay later (BNPL) schemes have long been a popular way for customers to buy goods and essential items. This type of pay structure allows a customer to purchase the product immediately without paying the full cost upfront. As such, BNPL schemes can be a common means of purchasing for customers during times when finances are tight.
A breakdown of buy now pay later statistics UK 2022 by age group
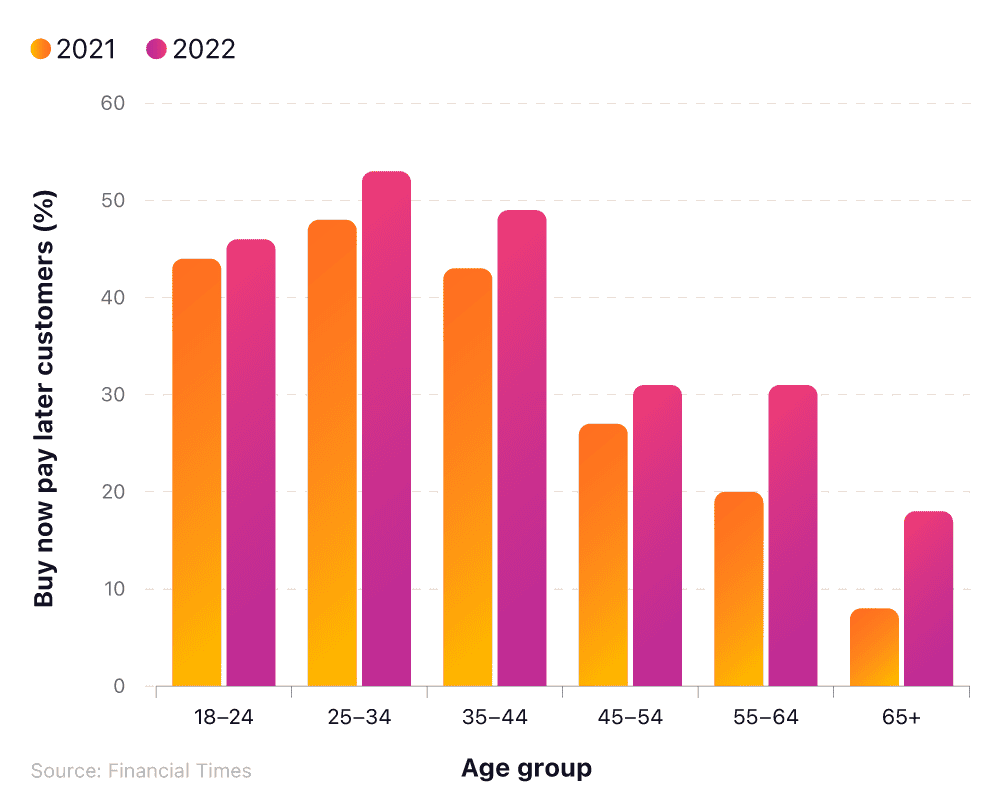
UK cost of living statistics show a significant rise across all age groups in terms of the number of people expecting to use BNPL schemes. Those aged between 25-34 were the most likely to use this type of payment plan, with over half (53%) expecting to use BNPL schemes within the next 12 months. This represents a rise of 6% from the previous year.
35-44-year-olds were the next most common age group most likely to use BNPL schemes in 2022, with just under half of the respondents (49%) saying they intend to use one this year. This age group was followed by 18-24 year olds who saw their figures rise marginally from 44% to 46% between 2021-22.
Despite recording the lowest percentages, the two oldest age groups in the study reported the highest rises from 2021-22. Those aged 55-64 are now 11% more likely to use BNPL schemes in 2022, with expected numbers rising from 20% to 31% in the last year. Similarly, those aged 65+ saw their figures rise by 10% (from 8% to 18%).
A breakdown of buy now pay later statistics UK 2022 by age groups and those affected by late fees
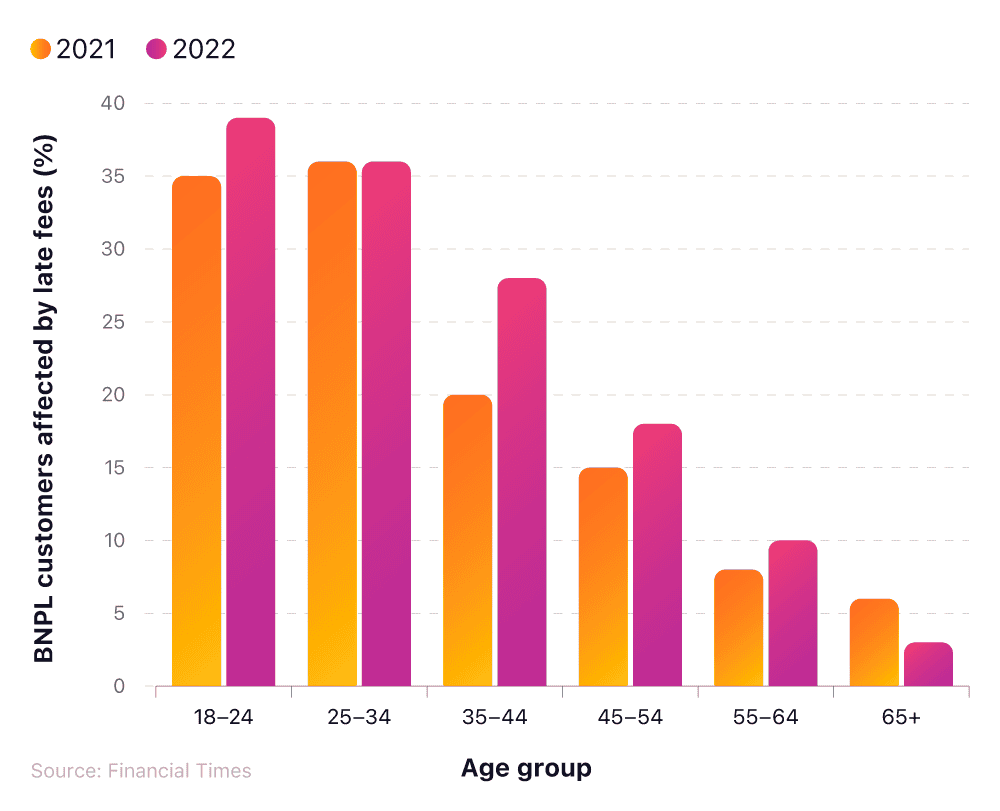
Buy now pay later statistics show that the youngest age group think they are the most likely to incur financial penalties for missed or late payments. Around 4 in 10 respondents (38%) aged 18-24 claim they were hit by late payment penalties in 2022 – up 3% from 2021.
25-34 olds are the next most likely to think they will be penalised, with their total of 36% identical to the previous year’s figures.
The figures show a direct correlation between age and expected payment penalties, with every older age group reporting fewer charges than the previous group. As the group that reports the lowest percentage of late charges (4%), those aged 65+ were also the only group that said they saw a reduction in late payment charges from 2021 (down 3%).
UK food bank statistics
Recent UK food bank statistics show that the number of people who use food banks in the UK fell by around 16% between 2020/21 and 2021/22.
After continued annual rises in food bank usage for over a decade, the 2022 figures of 2.17 million represent a fall of around 420,000 from the peak numbers recorded in 2020/21. It’s worth noting that the 2020/21 figures may have been disproportionately enhanced by the fallout from the COVID-19 pandemic, with this year recording a rise of around 35% from the previous year.
A breakdown of UK food bank usage statistics over time (2015-22)
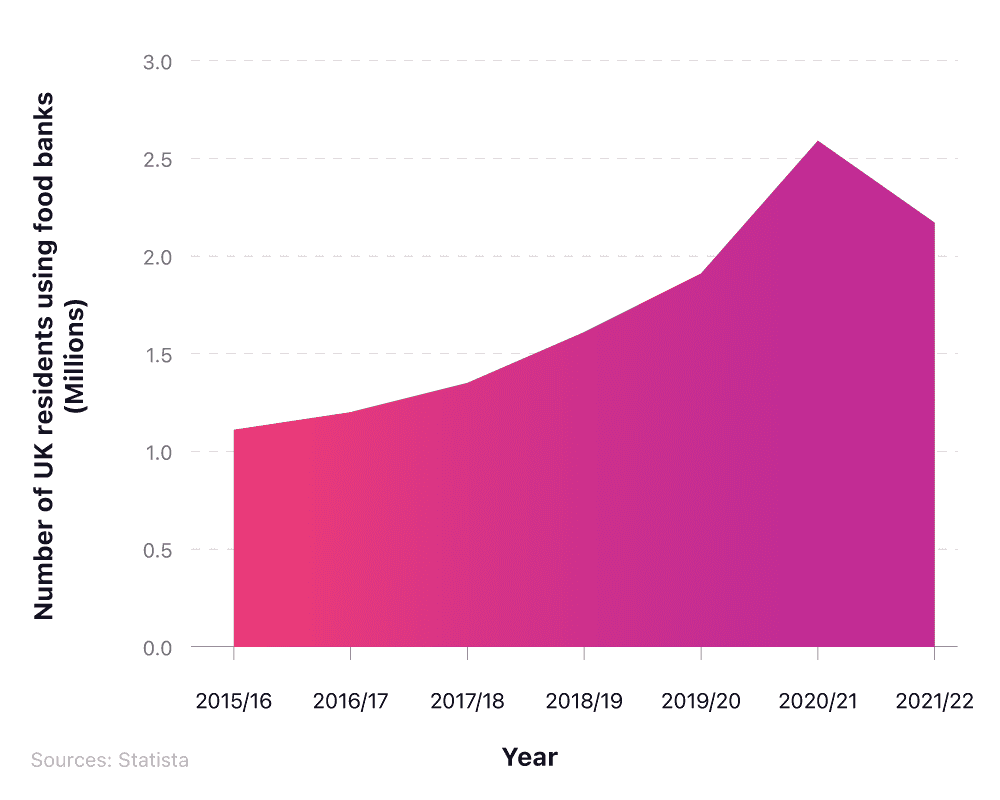
The latest figures recorded mean that food bank usage in 2022 was around 15% higher than it was two years previously, and almost double the figures recorded for 2015/16 (1.1 million).
Money.co.uk cost of living survey (September-October 2022)
We polled 2,061 people aged 16+ in the UK to find some of the most recent, and relevant, cost of living stats for 2022.
We asked people about their current financial situation, any concerns they have, and how the rising cost of living has impacted their mental health. We also asked about their spending habits, how their income and outgoings have changed over the last year, what government support they were seeking, if any, and more.
1. How much has your annual salary increased in the last 12 months?
| All | 16-24 | 25-34 | 35-44 | 45-54 | 55+ | |
| 1 - 5% | 20.52% | 9.27% | 25.70% | 30.51% | 28.35% | 15.93% |
| 5.01 - 10% | 9.22% | 11.92% | 15.64% | 11.78% | 9.06% | 4.41% |
| 10.01 - 15% | 5.58% | 8.61% | 11.17% | 8.16% | 5.51% | 0.98% |
| 15.01 - 20% | 3.54% | 7.62% | 8.94% | 3.02% | 1.18% | 0.61% |
| 20.01 - 25% | 1.94% | 1.99% | 5.59% | 3.02% | 1.18% | 0.12% |
| More than 25% | 0.15% | 0.33% | 0.00% | 0.30% | 0.39% | 0.00% |
| It remained the same | 15.53% | 11.59% | 14.25% | 22.05% | 21.26% | 13.11% |
| It has decreased (pay cut) | 2.04% | 0.66% | 1.40% | 3.02% | 3.15% | 2.08% |
| I do not work | 38.67% | 43.05% | 12.01% | 13.60% | 27.95% | 62.25% |
| Prefer not to say | 2.81% | 4.97% | 5.31% | 4.53% | 1.97% | 0.49% |
(Source: money.co.uk)
Around a fifth of people surveyed saw an increase of 1-5% in their salary between 2021-22, with almost one in 10 stating their wages have gone up between 5-10%. Only 2% noticed a drop in their incomes over the last 12 months, compared to more than 15% claiming their income has stayed about the same. A 1-5% pay rise was the most common response across all age groups, with the greatest percentage amongst 35-44 year olds (30%).
2. What is currently your biggest financial concern?
| All | 16-24 | 25-34 | 35-44 | 45-54 | 55+ | |
|---|---|---|---|---|---|---|
| Paying monthly bills (water, gas, electricity) | 44.93% | 21.19% | 40.22% | 46.83% | 49.21% | 53.68% |
| I don't have a biggest financial concern | 12.71% | 6.29% | 5.59% | 6.95% | 9.45% | 21.57% |
| Groceries | 10.14% | 13.25% | 9.22% | 10.27% | 10.24% | 9.31% |
| Personal savings | 9.66% | 24.17% | 14.53% | 6.04% | 7.09% | 4.41% |
| Paying rent | 8.44% | 17.55% | 11.45% | 8.46% | 4.72% | 4.90% |
| Paying mortgage | 8.05% | 6.29% | 11.45% | 13.90% | 13.39% | 3.19% |
| Prefer not to say | 1.94% | 4.97% | 1.96% | 1.51% | 1.97% | 0.98% |
| Care costs for child-dependent | 1.65% | 3.64% | 2.79% | 2.72% | 1.18% | 0.12% |
| Care costs for an adult-dependent | 1.16% | 2.32% | 1.96% | 1.21% | 1.18% | 0.37% |
| Other | 1.31% | 0.33% | 0.84% | 2.11% | 1.57% | 1.47% |
(Source: money.co.uk)
Almost 45% of people surveyed stated that paying their monthly energy bills was their greatest financial concern during the 2022 cost of living crisis. Around one in 10 claimed they were most worried about paying for groceries and being able to save money. Incidentally, 12% of people claimed they don’t have a biggest concern.
More than half (53%) of the over 55s are concerned about paying their energy bills. However, more than one in five also believe they don’t have a biggest concern—the most of any age group. By contrast, only a fifth of 16-24 year olds are worried about paying their water, gas, and electricity bills. However, almost a quarter (24%) are fearful of their personal savings.
Those in the 25-34 age bracket have the greatest amount of concerns, with only 6% stating they didn’t have any big financial worries from the list provided.
| £15,000 or less | £15,001 - £25,000 | £25,001 - £35,000 | £35,001 - £45,000 | £45,001 - £55,000 | £55,001 and over | I do not wish to disclose this information | |
|---|---|---|---|---|---|---|---|
| Paying monthly bills (water, gas, electricity) | 48.09% | 45.89% | 50.00% | 39.69% | 41.59% | 35.37% | 36.36% |
| I don't have a biggest financial concern | 3.28% | 6.33% | 7.10% | 7.73% | 8.85% | 19.51% | 7.58% |
| Groceries | 13.66% | 10.44% | 7.74% | 9.28% | 7.08% | 7.32% | 7.58% |
| Personal savings | 12.57% | 10.13% | 9.03% | 14.43% | 14.16% | 8.54% | 12.12% |
| Paying rent | 10.38% | 13.29% | 9.03% | 7.73% | 4.42% | 3.66% | 10.61% |
| Paying mortgage | 8.74% | 11.08% | 11.94% | 13.92% | 15.04% | 18.29% | 4.55% |
| Prefer not to say | 1.64% | 0.32% | 0.00% | 1.03% | 0.00% | 2.44% | 16.67% |
| Care costs for child-dependent | 0.55% | 0.63% | 2.90% | 3.09% | 2.65% | 2.44% | 1.52% |
| Other [please specify] | 0.55% | 0.95% | 1.29% | 1.03% | 2.65% | 1.22% | 1.52% |
| Care costs for an adult-dependent | 0.55% | 0.95% | 0.97% | 2.06% | 3.54% | 1.22% | 1.52% |
(Source: money.co.uk)
As wages increase, the percentage of respondents who don’t have any financial concerns also increases. Only 3% of those earning less than £15,000 claimed to have no worries, contrasted to almost 20% for those earning above £55,000.
Paying monthly bills remains the most common financial worry for people in 2022. 50% of those earning between £25,000 and £30,000 admitted this was a cause for concern, compared to 35% of the highest income bracket (more than £55,000 a year). Incidentally, almost half (48%) of those earning under £15,000 were worried about paying their household bills.
The cost of food shopping is a concern for almost 14% of those in the lowest wage bracket, compared to around 7% for the top earners. Those earning between £45,000 and £55,000 are most worried about their savings (14%) and paying a mortgage (15%).
Interestingly, almost 9% of those in the lowest wage group are worried about keeping up with mortgage repayments, compared to 18% for the wealthiest group in society.
3. Over the past 12 months, have you had to rely on anything to pay everyday bills?
| All | 16-24 | 25-34 | 35-44 | 45-54 | 55+ | |
|---|---|---|---|---|---|---|
| I did not have to rely on anything | 44.10% | 22.19% | 27.65% | 33.23% | 48.03% | 62.62% |
| Dipped into savings | 22.32% | 20.53% | 26.82% | 23.87% | 21.65% | 20.59% |
| Credit card | 14.70% | 12.91% | 24.86% | 21.15% | 15.75% | 7.97% |
| Borrowing from family members or friends | 12.52% | 26.16% | 19.83% | 11.78% | 10.63% | 5.15% |
| Overdraft | 12.13% | 17.22% | 16.20% | 20.24% | 11.42% | 5.39% |
| Government support | 9.17% | 12.91% | 10.34% | 9.67% | 10.63% | 6.62% |
| Pay later services (Klarna etc.) | 6.99% | 10.93% | 12.85% | 7.85% | 5.51% | 3.06% |
| Payday loan | 5.05% | 8.28% | 10.61% | 7.55% | 3.54% | 0.86% |
| Prefer not to say | 3.64% | 8.28% | 3.91% | 2.72% | 3.15% | 2.33% |
| Other | 0.63% | 0.99% | 0.00% | 0.60% | 1.57% | 0.49% |
(Source: money.co.uk)
Over the past year, under half (44%) of people surveyed didn’t have to rely on any additional support to pay their bills. More than a fifth (22%) admitted to dipping into their savings, while nearly 15% used a credit card. Around 12% either borrowed money from others, or went into their overdraft, in order to cover the cost of their everyday bills.
Generally as people get older, the less they rely on additional sources of money to pay their bills. The most financially secure age group were those aged 55+, with more than 60% able to self-fund their bills, compared to only 22% for the 16-24 bracket.
Almost a quarter of 25-34 year olds used a credit card in the last 12 months to cover bills, compared to less than 8% for the over 55s. Those between 16-24 were more likely to borrow from friends and/or family (26%), whereas 45-54 year olds opted to use their savings (22%).
Receive expert advice on your borrowing by reading the articles in our credit card guides section.
4. How much do any dependents (a child, spouse or a relative) cost you per month? If you have more than one dependent, answer with the average cost per dependent.
| All | 16-24 | 25-34 | 35-44 | 45-54 | 55+ | |
|---|---|---|---|---|---|---|
| £0 | 9.56% | 9.27% | 6.70% | 6.04% | 7.48% | 12.99% |
| £1 - £50 | 4.61% | 6.62% | 4.75% | 4.83% | 7.09% | 2.94% |
| £50.01 - £100 | 10.29% | 15.56% | 12.29% | 13.90% | 9.84% | 6.13% |
| £100.01 - £150 | 11.11% | 15.23% | 17.60% | 16.01% | 10.63% | 4.90% |
| £150.01 - £200 | 7.81% | 8.28% | 10.61% | 12.39% | 8.66% | 4.29% |
| £200.01 - £250 | 8.98% | 5.96% | 13.13% | 17.82% | 11.02% | 4.04% |
| More than £250 | 2.23% | 0.99% | 3.07% | 3.02% | 3.94% | 1.47% |
| I do not have a dependent | 39.74% | 30.79% | 26.82% | 19.64% | 33.07% | 58.95% |
| Prefer not to say | 5.68% | 7.28% | 5.03% | 6.34% | 8.27% | 4.29% |
(Source: money.co.uk)
From our survey, 21% of those who have dependents claimed this was costing them an extra £50-£150 a month, whereas almost 10% stated having dependents didn’t bring with it an additional monthly expense.
Almost 18% of those between 35-44 incurred an extra £200-£250 a month by having dependents, compared to just 6% for 16-24 year olds.
5. How much has the rising cost of living affected your mental health in the past 12 months?
| All | 16-24 | 25-34 | 35-44 | 45-54 | 55+ | |
|---|---|---|---|---|---|---|
| It has not affected my mental health at all | 26.44% | 8.94% | 9.22% | 15.71% | 26.38% | 44.85% |
| It has not really affected my mental health | 27.51% | 24.83% | 25.42% | 27.49% | 30.31% | 28.55% |
| It has affected my mental health | 33.14% | 43.05% | 48.32% | 41.09% | 31.89% | 19.98% |
| It has severely affected my mental health | 9.02% | 13.25% | 12.57% | 11.18% | 8.66% | 5.15% |
| Affected (Net) | 42.16% | 56.29% | 60.89% | 52.27% | 40.55% | 25.12% |
| Not affected (Net) | 53.95% | 33.77% | 34.64% | 43.20% | 56.69% | 73.41% |
| Prefer not to say | 3.88% | 9.93% | 4.47% | 4.53% | 2.76% | 1.47% |
(Source: money.co.uk)
42% of people surveyed stated that the rising cost of living was having an adverse effect on their mental health. The worst affected groups were 16-24 and 25-34, with 56% and 60% of respondents respectively admitting their mental health had suffered across the past 12 months due to the pressure of rising costs.
Generally, the older groups in society were less affected, in terms of their mental health, with only 25% of those 55s agreeing with this statement. In fact, almost 45% of those aged 55 and above said rising cost of living had no impact on their mental health at all, compared to only 9% for 16-24 and 25-34 year olds.
Around 13% of those between 16-24 and 25-34 stated rising living costs was severely affecting their mental health, compared to just 5% of over 55s.
| £15,000 or less | £15,001 - £25,000 | £25,001 - £35,000 | £35,001 - £45,000 | £45,001 - £55,000 | £55,001 and over | I do not wish to disclose this information | |
|---|---|---|---|---|---|---|---|
| Affected | 46.99% | 48.10% | 48.39% | 43.30% | 44.25% | 42.68% | 37.88% |
| Not affected | 51.37% | 50.32% | 49.68% | 52.58% | 52.21% | 52.44% | 39.39% |
| Prefer not to say | 1.64% | 1.58% | 1.94% | 4.12% | 3.54% | 4.88% | 22.73% |
(Source: money.co.uk)
When broken down into wage brackets, less than half of UK people claimed that their mental health has been impacted by the 2022 cost of living crisis.
Those earning between £15,000-£25,000, and £25,000-£35,000, were slightly more affected than others (approximately 48%), whereas those earning £55,000+ were least impacted (almost 43%).
6. What type of business, if any, would you be most likely to stop using if the cost-of-living crisis worsened?
| All | 16-24 | 25-34 | 35-44 | 45-54 | 55+ | |
|---|---|---|---|---|---|---|
| Takeaways | 26.83% | 24.83% | 29.61% | 30.51% | 29.53% | 24.02% |
| Pubs and Restaurants | 19.26% | 12.91% | 18.44% | 19.64% | 22.05% | 20.96% |
| None | 14.60% | 8.28% | 7.54% | 7.55% | 13.39% | 23.28% |
| Leisure centres/Gyms | 5.73% | 6.95% | 5.03% | 6.34% | 5.51% | 5.39% |
| Hairdressers | 5.00% | 6.62% | 7.26% | 5.14% | 3.94% | 3.68% |
| Theatres | 4.85% | 7.28% | 5.87% | 6.04% | 3.15% | 3.55% |
| Retail shops | 4.85% | 7.62% | 6.42% | 4.83% | 3.94% | 3.43% |
| Cafés | 4.37% | 4.64% | 5.03% | 5.74% | 4.33% | 3.43% |
| Large food shops | 3.64% | 5.30% | 3.63% | 3.93% | 4.33% | 2.70% |
| Small shops | 3.54% | 3.31% | 2.51% | 3.32% | 6.30% | 3.31% |
| Museums | 2.77% | 6.62% | 1.96% | 2.42% | 1.97% | 2.08% |
| Private healthcare | 2.38% | 2.98% | 3.63% | 2.11% | 0.79% | 2.21% |
| Private nurseries (childcare) | 1.26% | 2.65% | 3.07% | 1.21% | 0.39% | 0.25% |
| Other | 0.92% | 0.00% | 0.00% | 1.21% | 0.39% | 1.72% |
(Source: money.co.uk)
When surveyed about their spending habits, almost 27% of people said they would likely give up takeaways if the cost of living crisis worsened. This was the most popular choice for every age bracket in our survey. After this, a significant proportion (almost one in five) said they would forgo pubs and restaurants in order to cut back on spending.
Interestingly, just under 15% of respondents stated they would give up nothing. Almost a quarter of those aged 55+ admitted to this, compared to under 8% for the 25-34 and 35-44 year olds.
7. How much, if at all, do you feel your overall monthly bills have increased in the past 12 months? [food bills, travel and transport, household bills etc]
| All | 16-24 | 25-34 | 35-44 | 45-54 | 55+ | |
|---|---|---|---|---|---|---|
| £0 – they have not increased | 2.86% | 4.64% | 3.35% | 2.42% | 4.72% | 1.59% |
| £1- £20 | 7.52% | 8.28% | 5.31% | 2.72% | 5.12% | 10.91% |
| £20.01 - £40 | 18.58% | 21.52% | 16.76% | 12.39% | 16.14% | 21.57% |
| £40.01 - £60 | 18.68% | 22.52% | 19.83% | 17.82% | 12.99% | 18.87% |
| £60.01 - £80 | 13.34% | 14.24% | 13.97% | 14.20% | 12.99% | 12.50% |
| £80.01 - £100 | 25.91% | 11.92% | 27.37% | 34.44% | 33.07% | 24.75% |
| More than £100 | 6.65% | 2.32% | 8.10% | 10.27% | 9.45% | 5.27% |
| Prefer not to say | 6.45% | 14.57% | 5.31% | 5.74% | 5.51% | 4.53% |
(Source: money.co.uk)
More than a quarter of people surveyed claimed that their monthly bills had increased somewhere between £80 and £100 within the past year. This also happened to be the most popular response for all age groups, apart from those aged 16-24. For this group, almost 23% said their cost of bills had increased between £40 and £60 a month.
Around 38% noticed a relatively nominal rise of between £20 and £60 a month, whereas 10% of those aged 35-44 and 45-54 observed a rise of more than £100 a month on their bills.
| Employment status | Mean average rise in bills over the last 12 months |
|---|---|
| Working full time | £76.36 |
| Working part-time | £74.43 |
| Retired | £59.47 |
| Full time homemaker | £86.25 |
| Student | £54.67 |
| Unemployed | £55.65 |
| Other | £102.45 |
(Source: money.co.uk)
When surveyed, those that were full-time homemakers have seen the biggest rise in bills within the last year, increasing by an average of £86.25. Very little separates the rise in bills between full-time and part-time workers (£76.36 vs £74.43).
Students have seen the smallest increase in their bills within the past 12 months, rising by an average of £54.67 from those surveyed, compared to £55.62 for the unemployed.
8. In the past 12 months, have you claimed any Government benefits?
| All | 16-24 | 25-34 | 35-44 | 45-54 | 55+ | |
|---|---|---|---|---|---|---|
| I have not claimed any Government benefits | 66.42% | 48.01% | 53.91% | 63.14% | 67.72% | 79.66% |
| Universal Credit | 13.54% | 22.85% | 18.16% | 16.01% | 12.20% | 7.48% |
| Warm Homes Discount | 10.33% | 11.26% | 14.25% | 9.37% | 8.66% | 9.19% |
| Household Support Fund | 6.21% | 9.93% | 8.10% | 5.74% | 7.48% | 3.80% |
| Help with childcare | 4.85% | 9.27% | 10.34% | 9.06% | 1.57% | 0.12% |
| Prefer not to say | 3.54% | 6.95% | 4.75% | 2.11% | 4.72% | 1.96% |
| Other | 2.09% | 0.66% | 1.40% | 1.51% | 1.97% | 3.19% |
(Source: money.co.uk)
In the past year, two-thirds of people from our survey had not claimed any government benefits, suggesting people were either managing to cope financially without any intervention, have chosen to not seek government assistance, or perhaps did not know they were eligible to claim.
Nearly 14% applied for universal credit. The split between age groups was vast, with almost 23% for 16-24, yet only 7% for the over 55s.
Around one in 10 people claimed a Warm Homes Discount, with the most popular age group being 25-34, at 14%. In addition to this, approximately 10% of those people between 16-44 were claiming some form of financial support to help with childcare costs.
| Work full time | Work part time | Retired | Home-maker / full time parent | Student | Unemployed | Other | |
|---|---|---|---|---|---|---|---|
| I have not claimed any Government benefits | 71.87% | 63.47% | 82.44% | 49.58% | 58.33% | 30.43% | 12.82% |
| Universal Credit | 10.48% | 16.06% | 1.78% | 21.01% | 22.22% | 40.58% | 33.33% |
| Warm homes discount | 9.23% | 7.51% | 8.40% | 19.33% | 6.48% | 18.12% | 38.46% |
| Household support fund | 5.47% | 5.96% | 2.80% | 11.76% | 6.48% | 13.04% | 17.95% |
| Help with childcare | 6.95% | 6.48% | 0.76% | 3.36% | 4.63% | 1.45% | 0.00% |
| Prefer not to say | 2.05% | 3.11% | 2.80% | 7.56% | 8.33% | 5.07% | 17.95% |
| Other | 0.57% | 2.33% | 3.05% | 2.52% | 0.93% | 6.52% | 10.26% |
(Source: money.co.uk)
Unemployed people are most likely to seek government support during the cost of living crisis. More than 70% have claimed some form of benefit within the past 12 months to help support them with rising costs, with more than 40% claiming universal credit, and 18% opting for the Warm Homes Discount.
Approximately half of home-makers and full time parents have claimed some form of Government within the past year, with universal credit and Warm Homes Discount, again, the two most popular (21% and 19%, respectively).
The group least likely to claim government benefits to help during the cost of living crisis were those who have retired. This applied to only 18% of retired people surveyed in our study, with Warm Homes Discount the most common option (8%).
Struggling during the cost of living? Check out our guide to ensure you’re receiving all the benefits you’re entitled to.
9. Which measures, if any, are you actively taking due to the rising cost of living in the UK?
| All | 16-24 | 25-34 | 35-44 | 45-54 | 55+ | |
|---|---|---|---|---|---|---|
| I am spending less on non-essentials | 55.46% | 35.76% | 54.47% | 56.80% | 54.33% | 62.99% |
| I am using less fuel (such as gas and electricity) in my home | 44.20% | 26.49% | 38.55% | 41.69% | 46.85% | 53.43% |
| I am spending less on food shopping and essentials | 38.62% | 30.13% | 43.58% | 39.58% | 41.73% | 38.24% |
| I am shopping around more | 36.92% | 14.90% | 36.03% | 41.09% | 43.70% | 41.67% |
| I am cutting back on non-essential journeys in my vehicle | 36.88% | 21.52% | 34.64% | 37.46% | 39.76% | 42.40% |
| I am using my savings | 22.85% | 24.50% | 23.74% | 21.75% | 19.69% | 23.28% |
| I am using credit more than usual (such as credit cards, loans, or overdrafts) | 12.37% | 14.24% | 18.72% | 17.22% | 12.20% | 6.99% |
| I am not taking any measures due to the cost of living | 10.72% | 11.59% | 5.31% | 6.65% | 12.20% | 13.97% |
| I am borrowing more money from friends and/or relatives | 9.17% | 16.56% | 14.53% | 9.67% | 9.06% | 3.92% |
| Other | 0.34% | 0.00% | 0.00% | 0.00% | 0.39% | 0.74% |
(Source: money.co.uk)
More than half of people (55%) said they were cutting their cost of living expenses by reducing money spent on non-essential items. This was a particularly popular choice for those aged 55+, where almost 63% said this was their preferred coping strategy, compared to around 35% for the 16-24s.
44% of people said they would look to cut down on domestic energy consumption. This option was around twice as popular for the over 55s as it was for the under 24s (approximately 53% vs 26%).
Looking for ways of cutting back on your expenditure? Check out our guide on smartphone apps that can help you save money during the cost of living crisis.
Nearly 44% of those aged 25-34 said they would spend less on food shopping and other essential items, while roughly the same percentage of 45-54 stated they would shop around more before making their purchasing decisions.
In addition, 42% of those aged 55+ claimed they would cut back on non-essential journeys (compared to just 21% for the 16-24s).
Interestingly, around one in 10 people admitted they wouldn’t be taking any measures in 2022 due to the rising cost of living. This was the case for 14% of over 55s, compared to just 5% of 25-34 year olds.
| £15,000 or less | £15,001 - £25,000 | £25,001 - £35,000 | £35,001 - £45,000 | £45,001 - £55,000 | £55,001 and over | |
|---|---|---|---|---|---|---|
| I am spending less on non-essentials | 67.21% | 60.13% | 52.90% | 45.88% | 53.98% | 42.68% |
| I am using less fuel (such as gas and electricity) in my home | 42.08% | 44.94% | 43.23% | 37.63% | 49.56% | 30.49% |
| I am spending less on food shopping and essentials | 48.09% | 42.41% | 38.39% | 29.90% | 38.94% | 31.71% |
| I am shopping around more | 38.80% | 39.56% | 39.68% | 34.54% | 41.59% | 28.05% |
| I am cutting back on non-essential journeys in my vehicle | 36.07% | 40.19% | 38.06% | 39.69% | 38.94% | 24.39% |
| I am using my savings | 27.87% | 23.73% | 20.65% | 20.62% | 24.78% | 25.61% |
| I am using credit more than usual (such as credit cards, loans, or overdrafts) | 5.46% | 16.14% | 17.10% | 20.10% | 18.58% | 18.29% |
| I am not taking any measures due to the cost of living | 7.10% | 7.59% | 8.39% | 6.19% | 6.19% | 15.85% |
| I am borrowing more money from friends and/or relatives | 7.65% | 8.86% | 9.03% | 12.89% | 11.50% | 6.10% |
| Other | 0.55% | 0.00% | 0.00% | 0.52% | 0.00% | 0.00% |
(Source: money.co.uk)
When broken down by income group, the most popular measure that people are taking to mitigate the impact of the cost of living crisis is spending less on non-essential items. However, there is significant variation between wage brackets. For those earning less than £15,000 a year, about two-thirds (67%) have opted for this strategy, compared to almost 43% for those earning more than £55,000 a year.
Almost 50% of those earning between £45,000-£55,000 a year are cutting back on domestic fuel consumption, compared to just 30% for those with an annual income of £55,000 and above.
48% of those in the lowest wage bracket are actively spending less each week on food, contrasted by almost 30% for those earning between £35,000 and £45,000.
Almost 40% of people are cutting back on non-essential journeys, apart from the wealthiest wage group, where the corresponding figure is less than a quarter (24%). This is also the age group who are least likely to shop around more when it comes to purchasing (28%), whereas 42% of those earning £45,000-£55,000 are most likely to shop around for a better price.
Only 5% of the lowest income group are turning to credit cards as a way of funding the rising cost of living. This is offset by somewhere between 15-20% for the other wage groups.
15% of those in the wealthiest group (earning in excess of £55,000 a year) admit to not taking any measures to cope with rising costs. This is around double the percentage for all other wage brackets in our study.
10. Roughly how much would you say the average cost of your weekly food shop has changed over the past 12 months?
| All | 16-24 | 25-34 | 35-44 | 45-54 | 55+ | |
|---|---|---|---|---|---|---|
| Increased by less than £10 a week | 2.62% | 0.99% | 0.28% | 0.60% | 0.79% | 5.64% |
| Increased by £10-20 a week | 37.26% | 23.18% | 29.89% | 26.59% | 30.31% | 52.21% |
| Increased by £21-30 a week | 21.45% | 21.52% | 26.54% | 23.87% | 24.02% | 17.40% |
| Increased by £31-40 a week | 14.75% | 19.54% | 18.72% | 21.75% | 15.35% | 8.21% |
| Increased by £41-50 a week | 10.77% | 15.56% | 14.80% | 14.20% | 12.20% | 5.39% |
| Increased by more than £50. | 0.87% | 1.32% | 0.84% | 0.91% | 3.15% | 0.00% |
| Decreased over the past 12 months. | 0.49% | 0.66% | 0.84% | 0.00% | 0.39% | 0.49% |
| No increase or decrease each week | 4.03% | 6.29% | 3.07% | 3.93% | 5.12% | 3.31% |
| Unsure | 7.76% | 10.93% | 5.03% | 8.16% | 8.66% | 7.35% |
(Source: money.co.uk)
Within the past 12 months, most people (37%) noticed a rise of between £10 and £20 a week on their cost of food shopping, which also happened to be the most popular response across all age groups. About half (52%) of the over 55s said their food bills had gone up by as much as £20 across the past year, compared to 23% for 16-24 year olds.
More than a quarter (27%) aged 25-34 said theirs had gone up by £21-£30 a week, compared to nearly 22% of 35-44 year olds, who observed an average weekly rise of £31-£40.
15% of 16-24 year olds said their food shopping had risen by as much as £50 within the last 12 months, yet the corresponding figure for those aged 55+ was just 5%.
Cost of living comparison by country
Throughout 2021 and 2022, consumer price inflation increased across many countries. One of the driving factors for this was pandemic-related supply shortages, as the global economy recovered from a recession. This increased the demand for products, services, and materials – one of which is consumer goods.
Throughout 2023, consumer price inflation has steadily fallen across many of the worlds leading economies, with the fall in global energy prices a key factor in this.
A breakdown of inflation rates for major economies of the world between 2014 and 2023
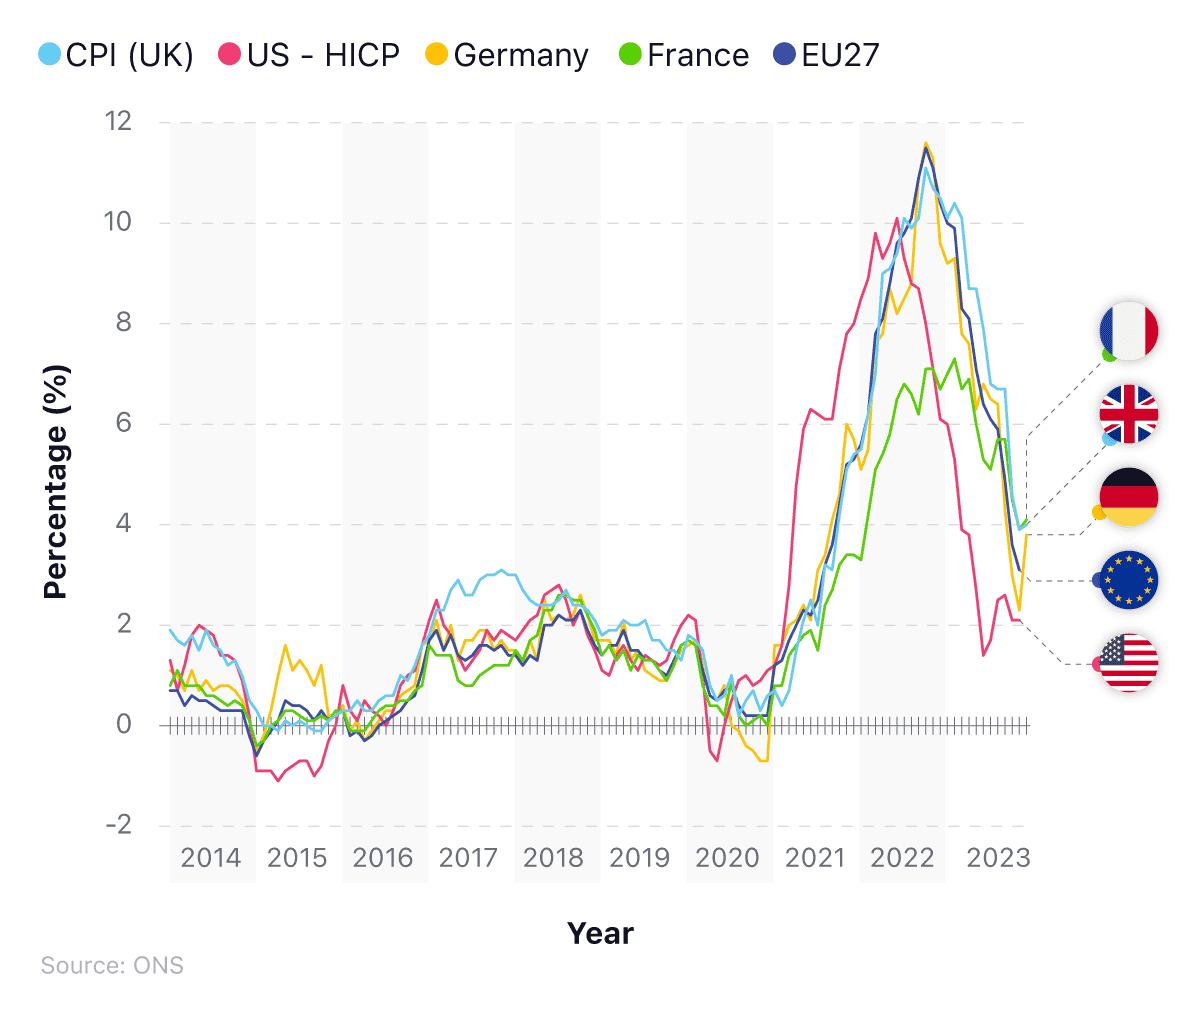
Among countries with a similar level of economic standing, the UK has one of the highest rates of inflation. In December 2023, this figure was 4%, a 6.5 percentage point decrease since December 2022. In Germany, the inflation rate stood at 3.8% in December 2023 while in France it was at 4.1%. In November 2023, the US inflation rate stood at 2.1% – nearly half that of the UK in the same month (3.9%)
Between November 2012 and November 2014, the UK’s rate of inflation was higher than that of France, Italy, Germany, and the USA. During this time, inflation fluctuated between 1% and 2.7%, yet prices remained higher in the UK than their economic counterparts.
A similar pattern occurred between April 2017 and March 2018. This time, inflation peaked at 3.1% in November 2017 – a figure relatively high for this economic period. Since October 2021, the UK’s rate of inflation increased dramatically, from 4.2% to 10.1% in January 2023, before falling steadily throughout 2023.
A similar story is observed in France, where inflation almost doubled from 3.2% in October 2021 to 7% in January 2023, before falling back down to 4.1% by December 2023. Similarly, in Germany, the rate of inflation in March 2022 was 7.6%. However, in October 2022 that figure increased hugely to 11.6% before falling throughout 2023, reaching 2.3% in November. Germany’s latest figure of 3.8% for December 2023 marks a 1.5 month-on-month percentage point rise.
The Eurozone average inflation rate was 3.1% in November 2023 – 0.8% lower than the UK rate for the same month.
A breakdown of consumer price inflation rates between major economies of the world in 2023
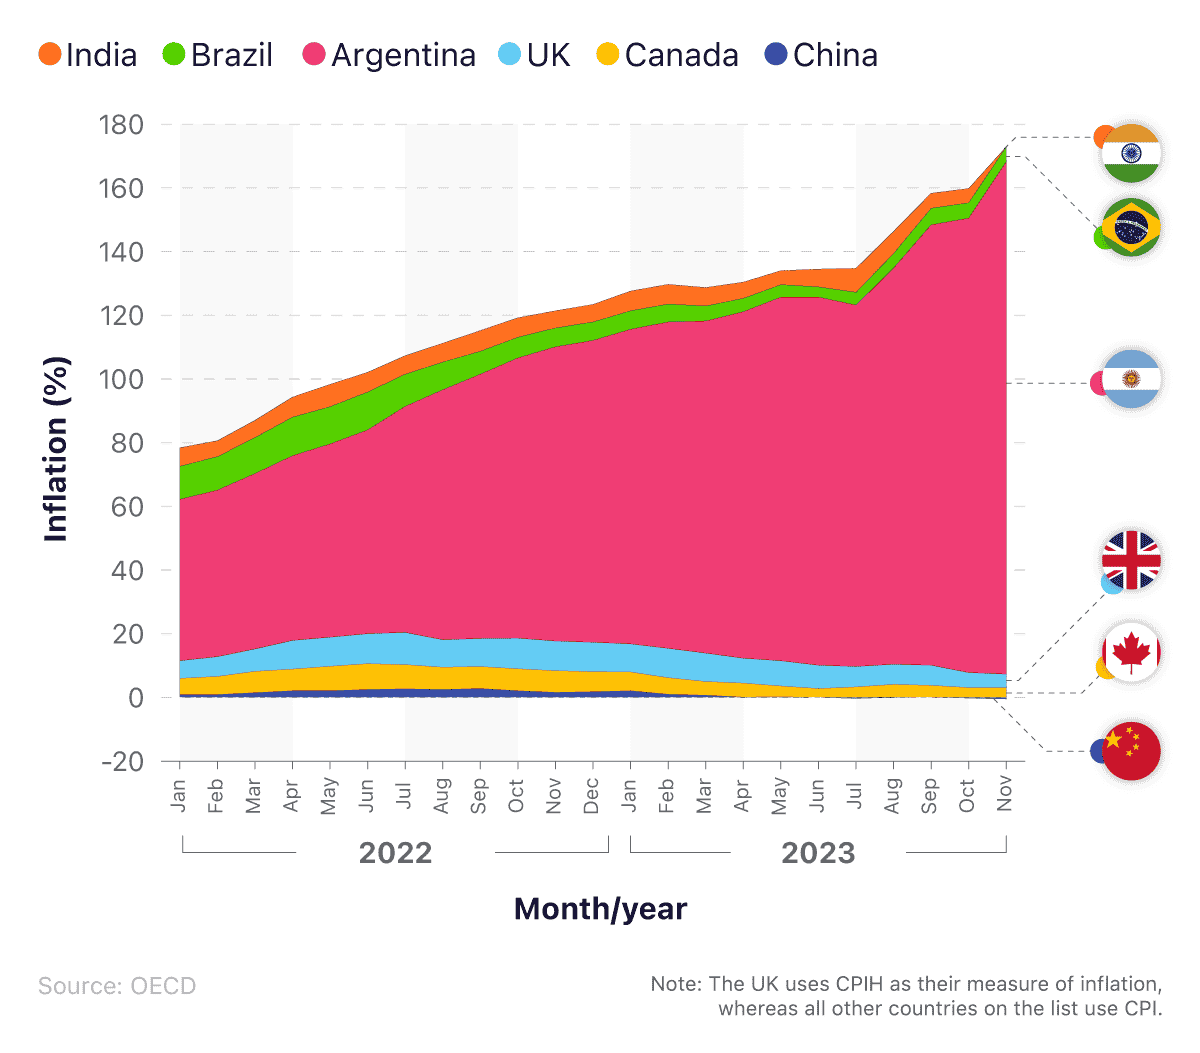
In November 2023, the average OECD rate of inflation was 5.4% – 2.4 percentage points higher than the G7 rate for the same month.
Turkey had the highest rate of inflation recorded by a country in the OECD in 2023. At 62% in November 2023, this is over 20 times what was seen in countries like Germany or the US during this time. No other OECD nation where data was recorded stood close to the figure seen in Turkey, with Colombia’s rate of 10.15% the second highest rate of inflation in any OECD nation.
Argentina had the highest non-OECD G20 inflation rate globally, at 160.92%, for November 2023 – more than double the total of any other nation where data is recorded.
China’s inflation rate was -0.5% in November 2023, the lowest globally. Similarly, Saudi Arabia's 1.7% inflation rate was lower than many comparative economies.
Glossary of cost of living key terms
12-month inflation rate
The most common approach to measuring inflation is the 12-month, or annual inflation rate, by comparing prices for the latest month with the same month a year ago. This takes into account any seasonal upward and downward movement in the price of various goods and services.
Bankruptcy
Bankruptcy is a legal status that occurs when a debtor declares they cannot afford to pay the money they owe. When you're bankrupt, your non-essential assets and excess income are used to pay off creditors with most or all debts written off.
Buy now pay later (BNPL) schemes
A buy now pay later (BNPL) scheme is a form of credit agreement. It is a type of loan that is offered to a customer at the point of sale, which allows them to make a purchase on credit without using a credit card. In most circumstances, there will be no interest or charges on the amount borrowed for a specific period of time, providing you keep up with the repayment agreement. Popular examples in the UK include PayPal, Klarna, and Shopify.
Consumer price inflation
The rate at which the price of household goods and services increases or decreases, as estimated by using price indices.
Consumer Prices Index (including owner occupiers’ housing costs) (CPIH)
The CPIH is the most comprehensive measure of UK inflation. It extends the Consumer Prices Index (CPI) by including any costs associated with owning, maintaining, and living in a home. This is known as the Owner Occupiers’ Housing Costs (OOH), along with council tax.
Consumer Prices Index (CPI)
The CPI is a measure of price inflation in line with international standards and European regulations, and is what the UK government uses in their targets for inflation. However, unlike the CPIH, it doesn’t take into account any costs associated with running a home.
Retail Prices Index (RPI)
The RPI measures the change in the cost of a representative sample of retail goods and services in the UK. However, it does not meet the required designation as a national statistic, and is used purely as a comparative measure to show change over time in the retail sector.
Minimal Standard of Living (MSL)
As defined by the Joseph Rowntree Foundation, a “decent” or “minimal” standard of living is not just having enough money to survive, but to also live with dignity. It’s calculated by specifying particular goods and services needed by different households to meet their needs. This measure is more than just food, clothing, and shelter; it’s about having what you need in order to have the opportunities, and choices, necessary to actively participate in society. This definition has changed over time, due to the rising costs associated within living in the UK, as well as what is deemed ‘acceptable’ by society at a given point in time. The 2022 definitions includes:
Housing
Domestic fuel
Food and drink
Clothing
Household goods and services
Health and personal care
Transport and travel
Social and cultural participation
Entertainment and connection
Gifts, celebrations, and charitable donations
Leisure and recreation
Eating out and takeaways
Holidays
Cost of living FAQs
What is causing the UK cost of living crisis?
According to the Bank of England, the UK cost of living crisis is being driven by multiple factors. Demand for goods and services is high, supply has been bottle-necked, and the ongoing conflict between Russia and Ukraine is driving up energy prices. Coupled with the hangover from the Covid-19 pandemic, this has created a perfect storm in the world of economics, causing a record increase in inflation.
Will the cost of living go down?
The Bank of England expects inflation to have peaked in December 2022 at 11%. It was standing at 4.2% in December 2023, with some analysts anticipating further falls in 2024.
How is inflation calculated?
Inflation is calculated by the ONS and is based on the cost of a representative basket of goods and services for a typical UK customer. Over 700 goods and services are taken into account each month across 180,000 products—although this is increasing to many millions in the coming year.
What is the average monthly retirement expenses?
The average monthly retirement expenses for someone in the UK varies depending on that person’s earnings. According to the Pensions and Lifetime Savings Association, in order for a UK retiree to have a minimum standard of living they need to be earning at least £12,800 a year. This will provide them with monthly retirement expenses of around £200 for food and £580 for clothing and personal costs, as well as some left over for DIY maintenance of the home and a couple of short, domestic holidays a year.
How does inflation affect consumer goods prices?
Inflation reduces the purchasing power of money because more of it is needed to buy the same items. UK inflation stood at 4.2% in December 2023 – a fall from 10.1% in December 2022. However, the annual growth in regular earnings stood at 7.3% from August to October 2023, meaning the growth in people’s wages were outstripping the rises in inflation.
Who is affected most by the UK cost of living crisis?
Low-income households are disproportionately most affected by the UK cost of living crisis, primarily because energy costs make up a greater proportion of their household budgets. According to the Institute for Fiscal Studies (IFS), the poorest 10% of UK households had an average annual inflation rate of 10.9% in May 2022, compared to just 7.9% for the wealthiest 10%. Wealthier households are more likely in a position to absorb additional costs, whereas this option is less possible for those with a smaller household budget.
How much money do you need to live comfortably in the UK?
According to the Joseph Roundtree Foundation, a single person living in the UK in 2023 needed to earn at least £29,500 to reach a minimum acceptable standard of living. This figure increased to a combined income of almost £56,000 for a couple with two children.
How much does it cost to live on your own?
According to the Minimum Income Calculator, a person living on their own will need to earn somewhere between £24,000 and £32,500 a year in order to live a decent standard of living. This will give you between £390 and £535 a week on which to live off. The cost of living will depend on many factors, such as where you live, the type of house you reside in, and how much you consume.
How much debt does the average UK person have?
The average UK adult has around £4,163 of unsecured personal debt. Of this, around £1,295 is debt linked to credit card borrowing.
How much does it cost to run a house per month in the UK?
The average cost of running a house in the UK in 2023 was £2,701 per year, with £1,264 on electricity, £1,238 on gas, and £199 on water rates. This is an average and will change depending on many factors, including where you live in the country, the type of property you live in, and how many people reside there.
Sources
https://www.bankofengland.co.uk/monetary-policy/the-interest-rate-bank-rate
https://commonslibrary.parliament.uk/research-briefings/
https://assets.publishing.service.gov.uk/media/649c694bbb13dc000cb2e2e0/table_261.xlsx
https://researchbriefings.files.parliament.uk/documents/CBP-9428/CBP-9428.pdf
https://themoneycharity.org.uk/money-statistics/
https://www.zoopla.co.uk/discover/property-news/rental-market-report/
https://researchbriefings.files.parliament.uk/documents/CBP-9491/CBP-9491.pdf
https://www.ofgem.gov.uk/energy-price-cap
https://www.rac.co.uk/drive/advice/fuel-watch/
https://www.statista.com/statistics/1180471/household-water-company-bills-united-kingdom-uk/
https://www.zoopla.co.uk/discover/property-news/the-cheapest-places-to-rent-a-home-in-the-uk/
https://www.jrf.org.uk/cost-of-living/a-minimum-income-standard-for-the-united-kingdom-in-2023
https://www.savethestudent.org/money/surveys/student-money-survey-2022-results.html#spend
https://www.minimumincome.org.uk/
https://www.ft.com/content/524a7e1e-4ff0-48d6-b9b1-973a9dd4e8d9
https://www.statista.com/statistics/382695/uk-foodbank-users/
https://researchbriefings.files.parliament.uk/documents/SN02885/SN02885.pdf
https://www.ons.gov.uk/economy/inflationandpriceindices/timeseries/l55o/mm23
https://www.thetimes.co.uk/money-mentor/mortgage-property/when-will-interest-rates-go-down-uk
https://ifs.org.uk/news/inflation-hits-9-poorest-households-facing-even-higher-rates
https://www.instituteforgovernment.org.uk/explainers/cost-living-crisis
https://www.ukfinance.org.uk/system/files/2024-01/Card%20Spending%20Update%20-%20October%202023.pdf
https://www.gov.uk/county-court-judgments-ccj-for-debt
https://commonslibrary.parliament.uk/research-briefings/
https://blog.ons.gov.uk/2021/11/17/made-to-measure-how-we-estimate-inflation-across-the-uk/
https://blog.ons.gov.uk/2022/01/26/measuring-the-changing-prices-and-costs-faced-by-households/
https://www.bankofengland.co.uk/monetary-policy-report/2023/february-2023
https://www.bbc.co.uk/news/live/business-62968429
https://www.bls.gov/news.release/cpi.nr0.htm
https://www.ons.gov.uk/economy/inflationandpriceindices/bulletins/consumerpriceinflation/may2022
https://www.bbc.co.uk/news/business-62920969
https://www.bbc.co.uk/news/business-63285246
https://www.bbc.co.uk/news/business-57764601
https://data.oecd.org/price/inflation-cpi.htm
https://www.oecd.org/sdd/prices-ppp/consumer-prices-oecd-01-2023.pdf
Data for ‘UK free school meal statistics 2023’ (Accessed 15/02/2023)
https://www.gov.scot/publications/healthy-living-survey-schools-meals-and-pe-supplementary-data/
Data for ‘Predicted price changes to UK items 2023’
https://www.ons.gov.uk/economy/inflationandpriceindices/datasets/consumerpriceinflation
Predicted increase in household expenditure for 2024 (exclusive data)
https://www.ons.gov.uk/economy/inflationandpriceindices/datasets/consumerpriceinflation
Read more like cost of living statistics 2024
The cost of living crisis is affecting all of us in different ways, whether you're looking for tips and tricks on how to heat your home for less, or a credit card to help manage monthly expenses, our credit card experts have put together these guides to help navigate you through these turbulent times.

10 ways to cut the cost of your weekly shop
Whether you blame Brexit or Coronavirus or both, the cost of filling your supermarket trolley is only going up. Find out how you can stop your food bills spiralling with our top 10 tips.
Read More
How to get your first credit card
Here is how to prepare yourself for your first credit card application.
Read More
How to heat your home for less
Getting your home properly insulated can drive down the cost of your energy bills significantly as well as help protect the environment — we show you how to do it without breaking the bank.
Read More
Can you transfer money from a credit card to your bank account
If you want to borrow a small sum of cash to repay a debt, or clear an overdraft, you can use a money transfer credit card to move cash into your current account.
Read more about transfering money from a credit card
What is the difference between Visa and MasterCard?
MasterCard and Visa work very similarly to one another. They are payment networks, which process payments when you spend using your credit, debit or prepaid card.
Read More
Help with the cost of living
How to lower your personal cost of living, where to find extra cash and what to do if you can't pay the bills
Read More
About Lucinda O'Brien
As a trained journalist, Lucinda has spent the past 10 years writing and editing content for regional and national titles, including The Mirror, WalesOnline and Manchester Evening News. She is now a personal finance editor and specialises in savings, helping people to make confident financial decisions so they can save for what matters most.