Agrivoltaics Align with Green New Deal Goals While Supporting Investment in the US’ Rural Economy


1
Water Resources Engineering, Oregon State University, Corvallis, OR 97331, USA
2
Biological and Ecological Engineering, Oregon State University, Corvallis, OR 97331, USA
3
Discipline of Biosciences and Biomedical Engineering, Indian Institute of Technology-Indore, Khandwa Road, Simrol, Indore, Madhya Pradesh 453552, India
*
Author to whom correspondence should be addressed.
Sustainability 2021, 13(1), 137; https://doi.org/10.3390/su13010137
Submission received: 16 November 2020
/
Revised: 20 December 2020
/
Accepted: 22 December 2020
/
Published: 25 December 2020
(This article belongs to the Special Issue Supply Chain Management for Sustainable Agribusiness)
Abstract
:Agrivoltaic systems combine solar photovoltaic energy production with agriculture to improve land-use efficiency. We provide an upper-bound reduced-order cost estimate for widespread implementation of Agrivoltaic systems in the United States. We find that 20% of the US’ total electricity generation can be met with Agrivoltaic systems if less than 1% of the annual US budget is invested into rural infrastructure. Simultaneously, Agrivoltaic systems align well with existing Green New Deal goals. Widescale installation of Agrivoltaic systems can lead to a carbon dioxide (CO2) emissions reduction equivalent to removing 71,000 cars from the road annually and the creation of over 100,000 jobs in rural communities. Agrivoltaics provide a rare chance for true synergy: more food, more energy, lower water demand, lower carbon emissions, and more prosperous rural communities.
1. Introduction
Growing populations and increasingly severe climate change impacts diminish the capacity of the United States to sufficiently meet the food, energy, and water needs of all citizens [1]. The Green New Deal resolution (GND) has been offered as one response to these challenges, presenting a set of goals to keep global temperature rise below 1.5 degrees while also creating millions of jobs, investing in the industry and infrastructure of the United States, and addressing how climate change exacerbates existing socioeconomic inequalities [2]. The GND failed to advance in the US senate in 2019 and has been criticized as impractical, expensive, and too optimistic. Still, the resolution and its underlying principles remain a locus of discussion, bringing the intersectionality of economic prosperity, environmental health, and citizens’ quality of life to the forefront of national and international discourse.
Agrivoltaic (AV) systems, which optimize solar harvesting potential by co-locating agricultural production with photovoltaic (PV) solar energy production, provide benefits that align with the GND’s goals. AV systems have been shown to improve land-use efficiency, water use efficiency, and PV panel efficiency; the impact of AVS on crop yields remains a major point of study [3,4,5]. The concept of Agrivoltaics was first introduced in the early 1980s by Goetzberger and Zastrow [6]. They posited that solar energy collectors and agriculture could coexist on the same piece of land, and that this combined use would actually enhance the benefits extracted from the land, precluding the need for land-use conflict between these two forms of solar harvesting. Four decades later, land-use conflicts between food and energy production remain a growing concern [7]. In recent years, solar development costs have steadily decreased [8] and the volume of solar energy generation has consistently increased [9]. Although effective harvesting of solar energy has been highlighted as one of the most promising techniques for meeting the resource challenges of the 21st century [10], utility scale solar requires large tracts of land [11]. Simultaneously, more than 11 million acres of farmland were transitioned to other forms of land-use between 2001 and 2016 [12]. These factors have led to legislation which aims to maintain agricultural lands, and a surge in both commercial and research interests in AV systems.
To date, the majority of AV research has focused on relatively small scale, experimental trials. The panel architecture and form of the AV systems varies depending on the goals of the project. Planting pollinator habitat beneath traditional arrays or grazing livestock beneath the panels are two approaches that require minimal changes to traditional PV panel architecture. Pollinators provide an essential service for agricultural production [13,14] and livestock benefit from the shade provided by the panels [15,16]. Crop production in AV systems often requires adjustments to the PV panel architecture. Spacing between panels is widened to increase the penetration of solar radiation and the panel height is increased, or tracking panels are installed, to facilitate the use of traditional agricultural machinery [5]. Although there is a growing consensus that crop-producing AV systems have the greatest potential in arid environments [4,17,18], research is ongoing to determine which crop types are best suited for AV conditions and what the optimal panel infrastructure and configuration may be [19]. Studies from a research site in Montpellier, France found that lettuce crops grown in AV conditions yielded on average 81–99% of the yield recorded in the full-sun control plot, with some cultivars in AV conditions exceeding control plot yields [20]. Later studies in the same region have built on this work, finding that lettuce in AV conditions had a 20% reduction in water consumption and experienced a delay of 3–7 days in plant maturity [21]. A study from an experimental farm in Ichihara City, Japan found that corn grown in AV conditions had 4.9% more biomass and 5.6% higher yields than the full-sun control [22]. Data from an experimental site in Tuscon, Arizona showed increased fruit production of chiltepin pepper and cherry tomato when grown in AV conditions, and a slight decrease in fruit production of jalapeño peppers when compared with the control [4]. Studies have also explored the impact of AV systems on agave plants in California [23], wine grapes in India [24], and java tea in Malaysia [25], among others. Additionally, stakeholders interested in AV systems are able to draw from the wider body of knowledge related to other dual-use systems, such as agroforestry [3] or intercropping [26,27], and from general agronomical knowledge about the relationships between crops and shading [28].
Although many research gaps still remain, the current body of work indicates that AV systems may represent a way to reduce greenhouse gas (GHG) emissions and broadly support the food, energy, and water security of the United States. In this article we present a reduced-order analysis of the upper-bound cost for widescale adoption of AV systems in the United States and find that if approximately 1% of the U.S. annual federal budget is invested in rural infrastructure, significant progress in the GND goals can be achieved. The potential benefits of AV systems align with all of the five major GND goals and many of the 14 subgoals and projects, referred to as the ‘Green New Deal mobilization’ [2]. AV systems are distinctly well suited to support subgoal ‘G’ which calls for a reduction in GHG emissions from agriculture. A more thorough exploration of the alignment of AV benefits and GND goals can be found in Table 1.
2. Materials and Methods
This section will briefly walk through the five segments of this analysis: (1) Array costs (2) Land requirements (3) CO2 emissions (4) Employment estimates (5) Lithium-ion storage costs. A Jupyter notebook file containing the full calculation including assumptions, data sources, and python code is provided along with this article and is openly available in the Supplementary Materials Section. The notebook includes an interactive aspect, allowing users to alter key assumptions and explore their impacts. An in-browser accessible version of the notebook can be accessed at https://mybinder.org/v2/gh/proctork/Reduced-Order-Agrivoltaic-Cost-Estimate/HEAD.
2.1. Array Costs
The National Renewable Energy Laboratory (NREL) projects that 80% of the US’ electricity demand in 2050 can be met with renewable technologies, with solar PV contributing 12.7% of the total [34]. In the interest of an upper-bound estimate, we assessed the cost to meet 20% of the total US electricity generation in 2019 using utility-scale AV systems. Given that domestic electricity generation in 2019 was 4120 terawatt-hours (TWh) [35], this analysis assesses the cost to generate 824 TWh of electricity annually using utility-scale AV systems. Required nameplate capacity was calculated using Equation (1) assuming a capacity factor (comparison of net generation with total available capacity) of 24.5% [36]. Rapid installation of 20% additional generation capacity would have substantial economic and energetic impacts, spiking the demand for materials and labor associated with PV, and driving electricity prices down as a result of the energy supply surge. Fully untangling these potential impacts is beyond the scope of this reduced-order analysis; for this calculation we assume that the total installation will commence over a ten year install period, mitigating some of the potential impacts. Panels are assumed to have a 25 year life span with a 0.5% rate of degradation per year [37]. Thus, given the 10 year install period, the assessed total project life is 35 years.
Total cost was calculated using Equation (2). Utility-scale solar costs often range from below $1/Watt (W) to ~$1.50/W. Modifications that allow for AV production, such as solar tracking or elevated solar panel height, are anticipated to cost ~$0.25/W. Thus, we take $2/W as an upper bound value for installed capacity cost, with an additional $19/kWh/year for operation and maintenance [10]. This study assumes real costs and prices remain constant over the duration of the analysis. A comparison between AV systems and traditional systems was accomplished by assuming a cost of $1.25/W for traditional utility-scale solar installations.
where CDC = Required capacity DC aka nameplate capacity (GW), CAC = Required capacity AC (GW), Df = Derate factor DC to AC (−), EG = Energy generated AC (GWh), t = Time (hours), CF = Capacity factor (−).
where CDC = Required capacity DC aka nameplate capacity (GW), CAPEX = Capital expenditures per unit capacity ($/GW), Total O&M = Operation and maintenance over panel life ($).
2.2. Required Land
AV systems are designed to minimally inhibit agricultural operations. They have greater spacings between panels than traditional arrays and an increased area per unit of capacity. Thus, NREL’s average total required area per capacity for large photovoltaic arrays [11] was doubled for our land area calculation. It is important to note that capacity-based land requirements have wide and skewed distributions which are not adequately captured when using an average value. The actual land required per unit capacity is highly dependent on the solar radiation at the site and thus varies widely throughout the US.
2.3. Emissions Reduction
Emission reductions (Equation (3)) were calculated by comparing current emission estimates for US electricity generation [38] with Intergovernmental Panel on Climate Change (IPCC) emission estimates for large scale PV [39]. The calculation does not consider related emissions from the manufacturing or end-of-life processing of the panels.
where ∆Emission = Annual Emissions Reduction (g CO2 equivalent], CO2eq = Emissions per unit energy, for average grid production and photovoltaic production respectively (g CO2 equivalent/GWh), EG = Energy Generated AC (GWh).
2.4. Job Creation
The life cycle employment creation potential for widespread AV systems was estimated using employment factors developed with a Renewable Energy Focused Input-Output model [40]. The employment factors estimate the job creation potential in terms of employment related to construction, sustained operations, and both direct and indirect employment. These estimates refer only to jobs created as a result of PV and do not consider additional agricultural related jobs. Employment factors are presented in terms of person-years per unit energy produced and thus total employment in person-years can be estimated by multiplying the employment factor by electricity generation. For clarification, a person-year refers to the amount of work done by an individual during a working year on a specific job. For example, 30 person-years could refer to a job that 30 people work on full time for year or that 15 people work on for 2 years, etc.
2.5. Lithium-Ion Storage Costs
The variable nature and low dispatchability of solar power make energy storage an important component of successful grid integration at high penetrations. The optimal storage medium is often dependent on situation and climate [41]. In the interest of an upper-bound estimate, this reduced order estimate looks exclusively at the cost of lithium-ion standalone storage systems. NREL [42] estimates the cost for 30 min, 1, 2, and 4 h of storage when using a 60 MW battery array. The total number of 60 MW battery arrays required for each storage level was calculated and used to estimate the total storage costs, with the assumption that inverters and batteries are replaced every 10 years.
3. Results
3.1. Array Costs and Required Land
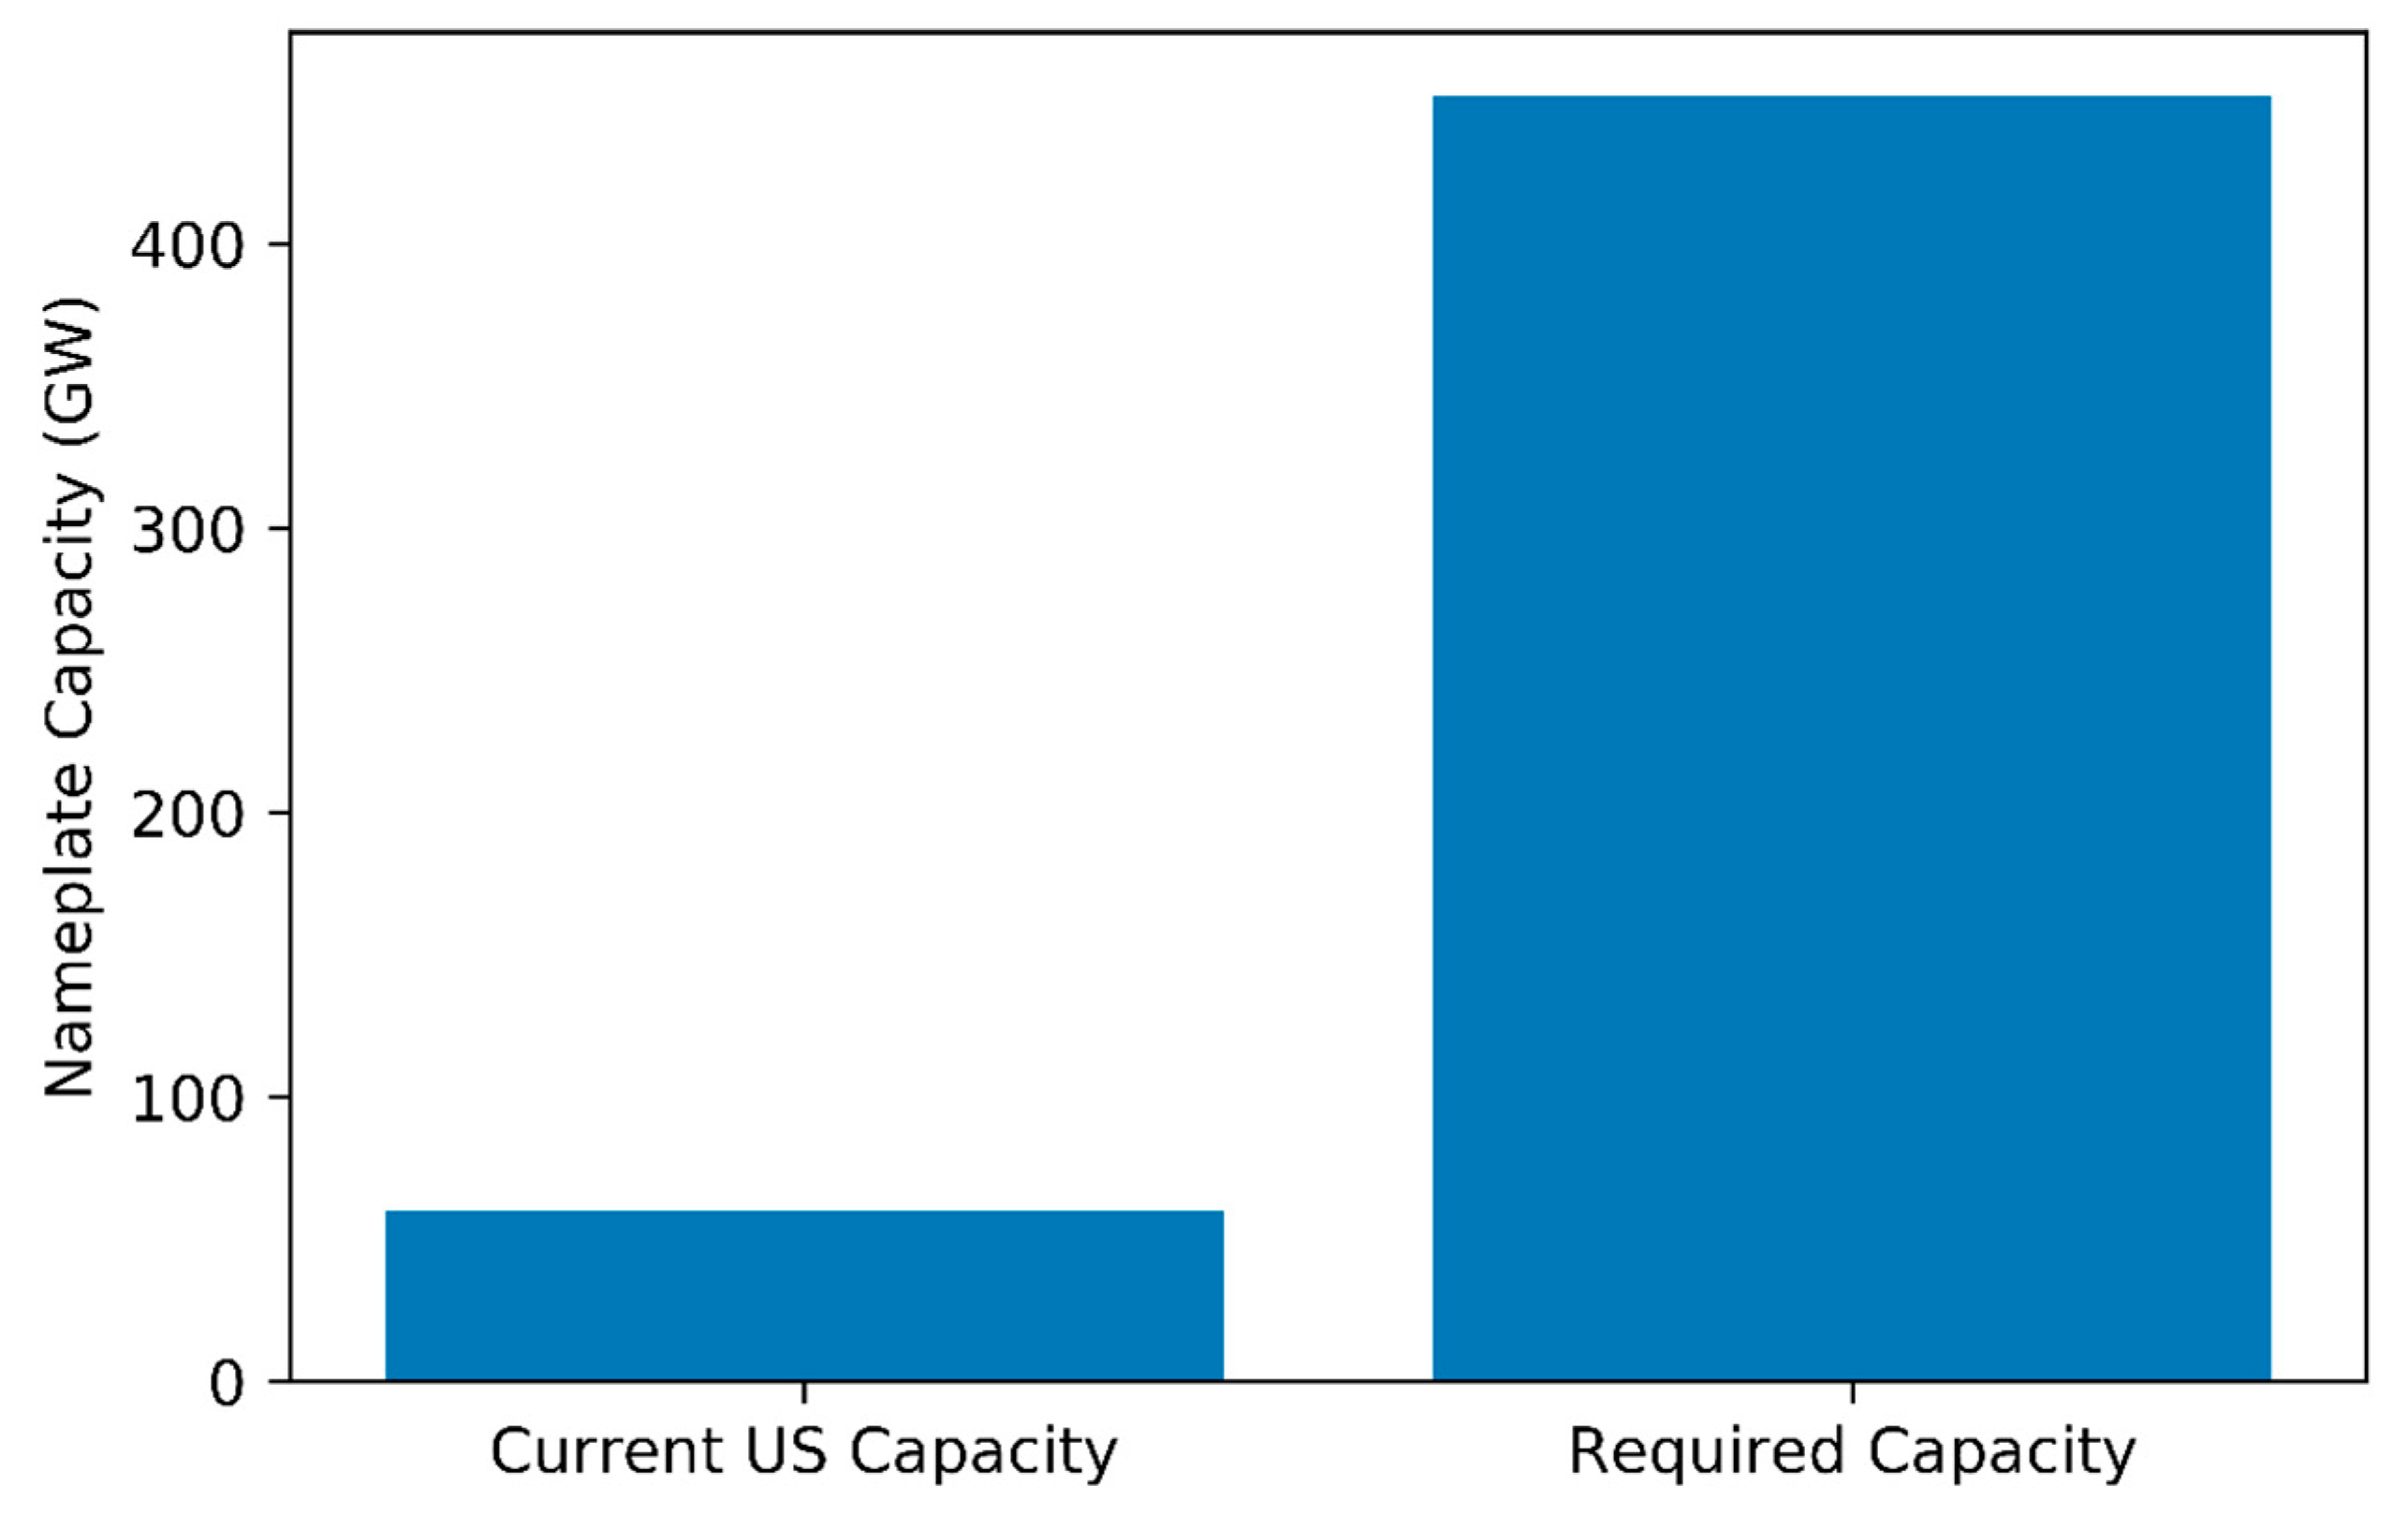
A total name plate capacity of 451.7 GW would be required to meet 20% of 2019 US electricity generation; this is a 7-fold increase over the country’s current solar capacity (Figure 1). Assuming an upper-bound cost of $2/W for installed capacity cost and $19/KWh/year for operation and maintenance, the total costs for AV arrays are estimated at $1.12 trillion over the full 35-year project life. At the average 2018 electricity retail price of 10.53 cents/ kWh [43], the AV systems would produce $2.04 trillion in revenue with a simple payback time of 17 years. The net present value (NPV) of the systems at the end of the project life was estimated for a 6% discount rate [44] ($35.72 billion), a 3% discount rate ($332.93 billion), and a 1% discount rate ($678.03 billion). Assuming a cost of $1.25/W for traditional systems, and similar operation and maintenance costs, the net difference between AV systems and traditional PV systems is estimated at $338.8 billion over the 35-year project life.
3.2. Required Land
The upper-bound area requirement for AV systems to meet 20% of 2019 US electricity generation is 34,000 square kilometers (13,000 square miles), approximately the size of Maryland or 0.94% of the US’ farmland.
3.3. Emissions Reduction
An annual CO2 emission reduction of 330,470 metric tonnes of CO2 equivalent was calculated based on the current emission estimates for US electricity generation (449 g CO2/kWh) [38] and IPCC emission estimates for large scale PV(48 g CO2/kWh) [39]. This is comparable to removing over 71,000 cars from the road annually [45].
3.4. Job Creation
The photovoltaic aspects of AV implementation alone could create a total of 2.34 million person-years of employment (117,000 employed for 20 years) with 40% of those positions in the form of sustained operation and maintenance. Whether this becomes a net increase in jobs relative to displaced energy production jobs is unclear. This estimate does not include additional agricultural job creation related to AV systems.
3.5. Lithium-Ion Storage
Costs for standalone lithium-ion storage for the AV systems using 60 MW battery arrays were estimated at between $76.96 billion for 0.5 h of storage and $322.12 billion for 4 h of storage over the 35-year project life. The total costs for AV arrays with 4 h of lithium-ion storage are estimated at $1.44 trillion over the project life. At the average 2018 electricity retail price of 10.53 cents/kWh [43], AV systems with storage would have a simple payback time of 20 years. The NPV of AV systems with storage was estimated for a 6% discount rate [44] (−$167.37 billion), a 3% discount rate ($88.99 billion), and a 1% discount rate ($387.99 billion).
3.6. Sensitivity Analysis
The relative sensitivity (Equation (4)) of six input parameters were calculated for the NPV of AV systems at the end of the project life (Table 2). Individual input parameters were perturbed by 10% with all other parameters being held at their default/base value. We find that the NPV of the system is most sensitive to changes in the electricity price, capacity factor, capital expenditures, and discount rate.
where SR is Relative Sensitivity, ∆R is the difference between base (Rb) and perturbed response value (in this case NPV), and ∆P is the difference between base (Pb) and perturbed input parameter.
4. Discussion
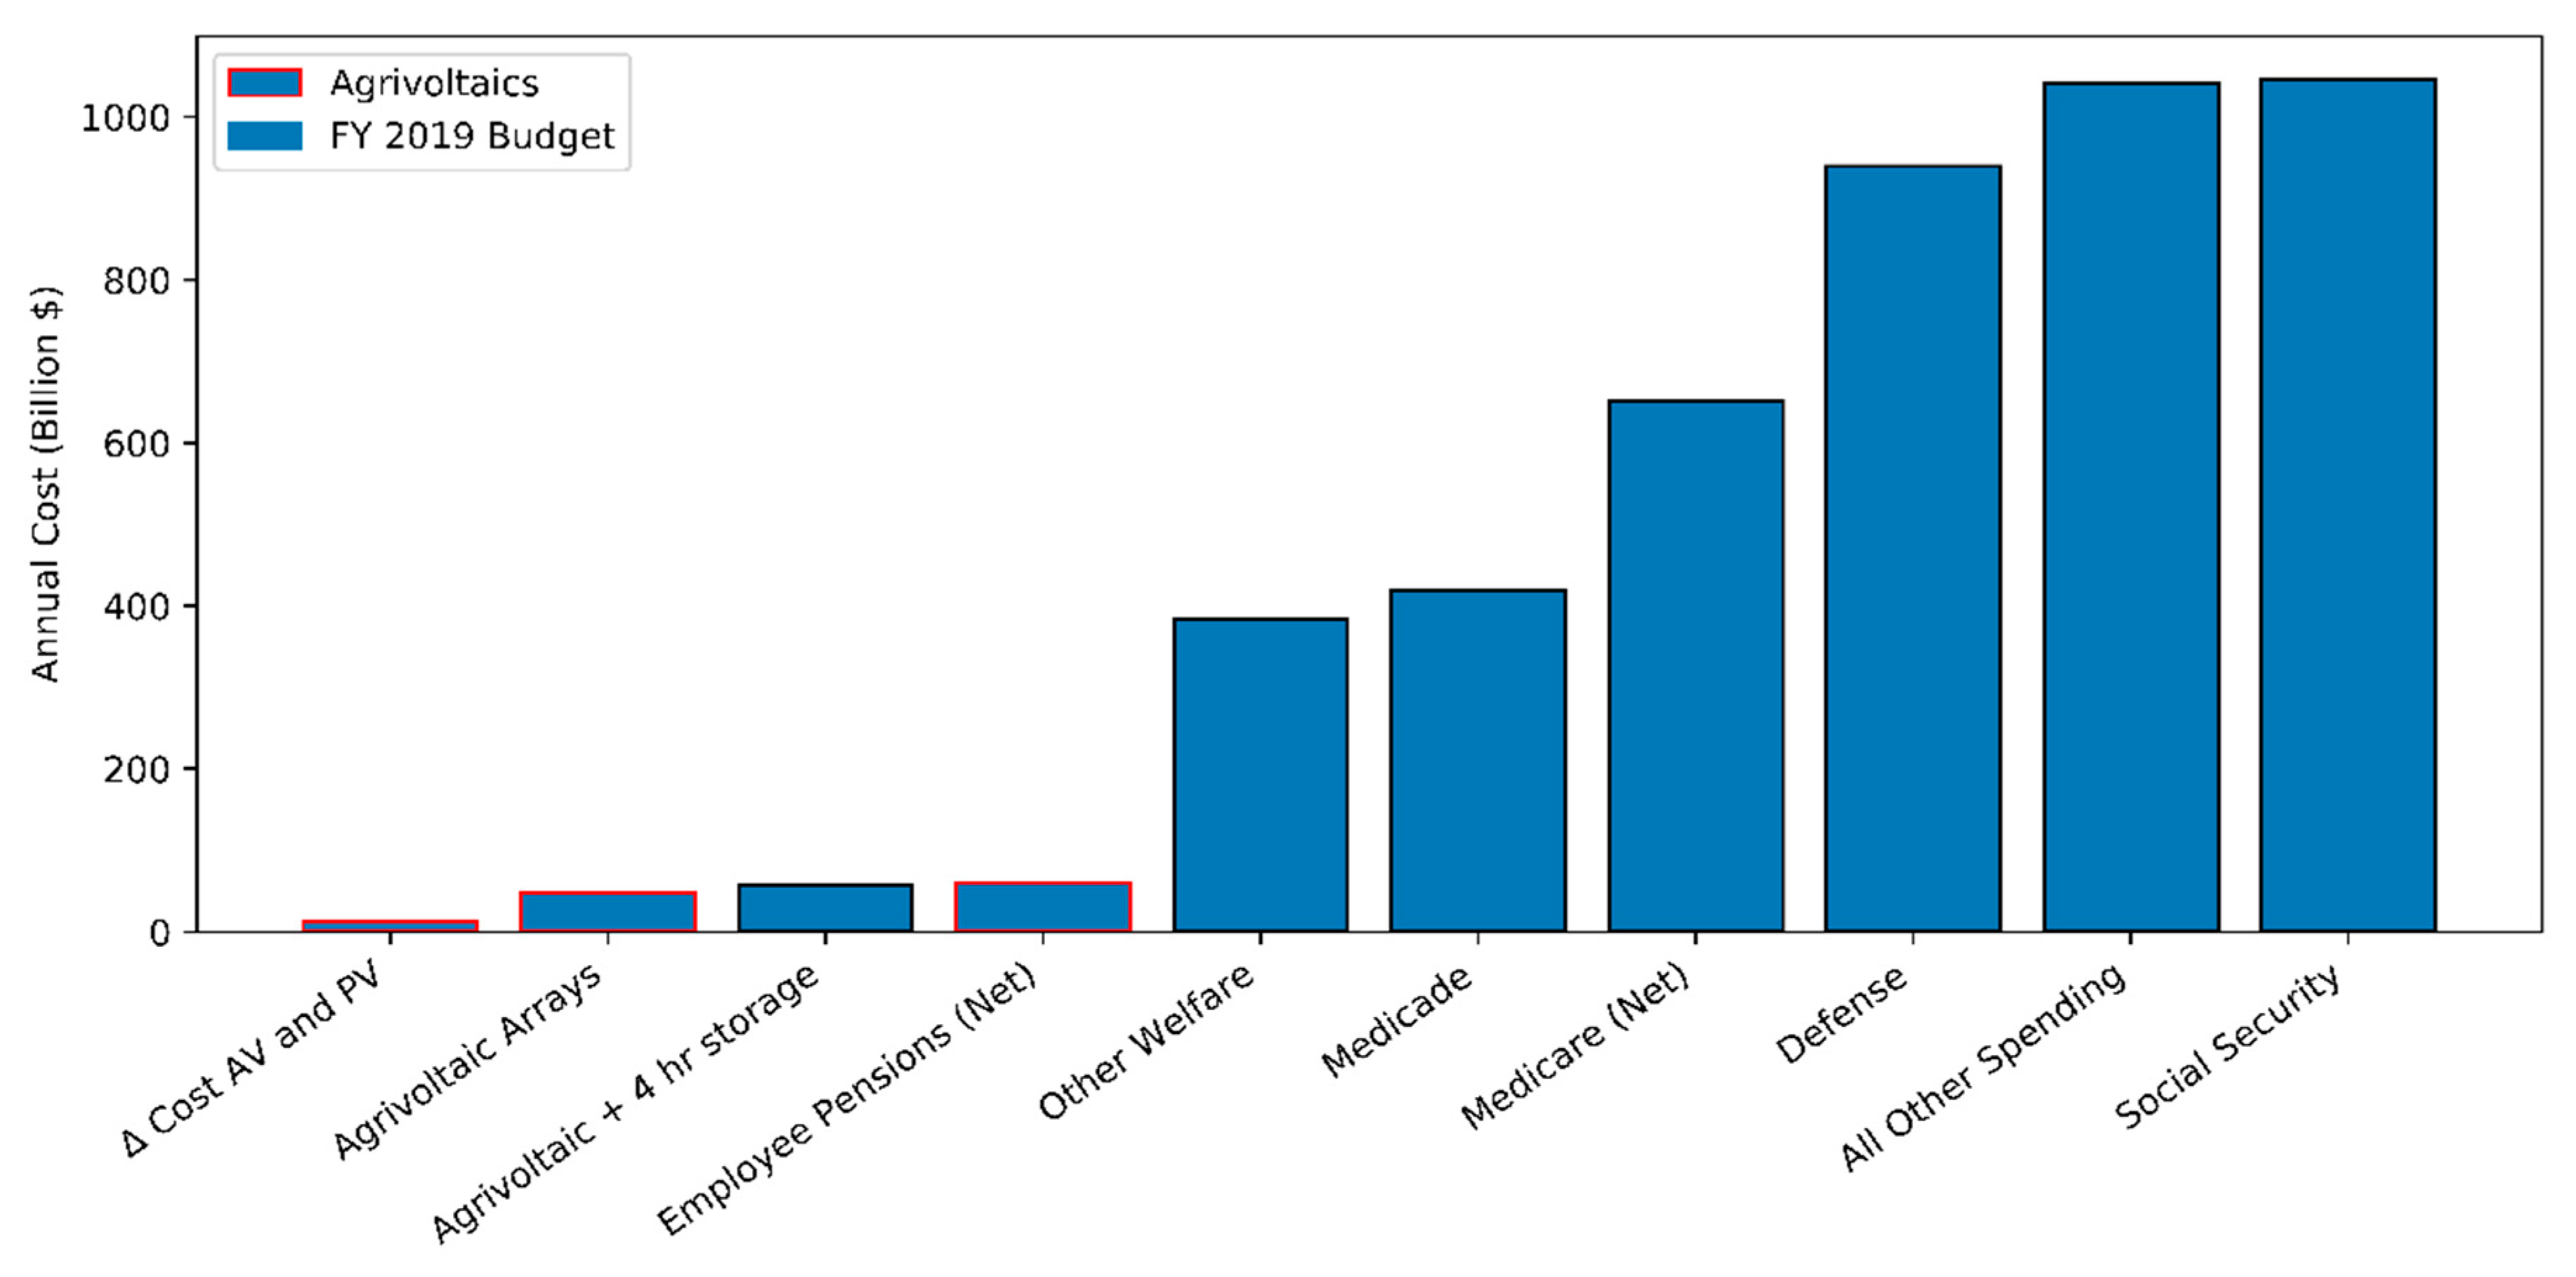
This reduced-order analysis, by definition, does not capture all the nuances that are required for widescale implementation of Agrivoltaic technologies. Yet, the upper-bound estimate is informative. The cost of $1.12 trillion over the 35-year project life, or roughly $31 billion annually (less than 1% of the United States federal fiscal year 2019 budget [46]) may at first seem prohibitive. However, this type of investment does not need to be funded entirely from government sources. Funding may come about in a distributed fashion with the private sector investing in the bulk of the construction and the federal government contributing in the form of rebates and other incentives. In Section 3.3 we estimated the cost difference between AV systems and traditional PV at $338.8 billion over the project life; this corresponds to roughly $9.4 billion annually or 0.20% of the US federal fiscal year 2019 budget (Figure 2). This is a substantial investment, but comparable to other historic large-scale infrastructure projects. Additionally, it is possible to speculate that investment in AV systems will target low cost, high benefit areas, bringing the overall cost down. For instance, in California’s San Joaquin valley, farmers are already “planting” solar panels as water supplies become increasingly scarce. AV systems may provide a valuable way for these farmers to reduce their water demand while also taking advantage of the economic opportunities presented by solar PV. The logistics of how, and if, AV infrastructure can be funded is highly dependent on political will. Areas which do not seem ideal for AV installation based on available solar radiation could become AV hotspots if substantial government incentive is applied. As an example, Germany is a leader in solar energy production [8] although a simple analysis of the available solar radiation would not suggest this.
Many of the benefits highlighted in this article are also applicable to PV and other forms of renewable energy. Widescale installation of traditional PV systems would lead to reduced GHG emissions, creation of solar related jobs, and improved resiliency to extreme climate impacts, all at a lower initial. AV systems will require greater overall area and cost per unit capacity due to the increased spacing between panels and the deviations from, and amendments to, traditional solar panel architecture. The first tradeoff for this increased cost and area per unit energy, as highlighted in the 1982 Goetzberger and Zastrow paper [6], is the overall improvement to land-use efficiency. This can be especially beneficial in locations where urban boundaries are expanding rapidly and expansion has led to both land scarcity and urban food insecurity [47].
This first tradeoff is not relevant in some situations. The US is home to vast amounts of rural land; in these locations land scarcity is less of an issue, yet there are other synergies that AV systems are able to capitalize on. Studies have found that PV potential is highest over croplands [48] and thus investment in AV systems can represent an investment in rural communities. Opportunities are created in the form of construction and operational jobs and in the services industries that support the workforce. Furthermore, the first of the GND goals calls for net-zero greenhouse gas emissions via “a fair and just transition for all communities and workers” [2]. Agrivoltaics have the potential to support a just transition in ways that other renewable energy technologies do not. The concept of a ‘Just Transition’ originated in the US labor movement of the late 1990s but has become an established framework used to discuss the transition of economic industries toward a low-carbon and climate resilient future. Just Transition literature discusses methods to support workers affected by economic restructuring and to emphasize equity and justice in the planning, implementation, and assessment of said restructuring [49,50]. Much of the current Just Transition work has focused on the coal and mining industries [49,51]; AV systems may not effectively support a Just Transition in this sense. Although clean energy industries provide more employment opportunities than fossil fuel industries [52], the fact that someone in a different state gets a solar job may not provide much solace to individual workers or communities in Appalachia, and other regions, who have lost employment.
AV systems instead may be fundamental for a Just Transition for agriculture. As mentioned in Section 1, more than 11 million acres of farmland have transitioned to other land-uses in the last two decades [12] and this figure does not account for the impacts related to the fragmentation of farmland and rural communities [53]. At the same time, the United States has an aging farmer population, an agricultural sector characterized by wide economic disparities [54], and rural communities which are facing both significant depopulation and economic development challenges, with over 22% of children in rural areas living in poverty [55]. Agrivoltaics may offer one method for supporting economic development in these communities and a pathway for farmers to remain farming when they otherwise may have needed to sell their land.
Beyond the emissions reductions and job potential outlined in Section 3, AV systems also offer further emissions reductions and employment associated with the electrification of agriculture. The electricity produced on farm could be used to run irrigation pumps, dry grain, power cold storage, create nitrogen-based fertilizers [29], and charge electric tractors, reducing overall emissions and providing a form of distributed energy storage. The GND explicitly identifies depopulated rural areas as acutely at risk from climate change impacts; investment in AV systems is one way to assert the nation’s commitment to the longevity and prosperity of these essential communities.
At a national level, Agrivoltaics would produce more renewable energy and more food while using less water, fortifying the security of all three of these critical natural resources. These systems present an opportunity to support the primary goals of the GND by allowing the US to bolster their renewable energy portfolio while simultaneously using land more efficiently and supporting the US’ rural economy. AV systems are not a panacea, but in certain areas they may offer a rare chance for true synergy: more food, more energy, lower water demand, lower carbon emissions, and more prosperous rural communities.
Supplementary Materials
The following Jupyter Notebook containing the full calculation used in this publication is available online at https://doi.org/10.7267/mc87px76j.
Author Contributions
Conceptualization, C.W.H.; methodology, K.W.P.; software, K.W.P.; validation, K.W.P., G.S.M., C.W.H.; formal analysis, K.W.P.; writing—original draft preparation, K.W.P.; writing—review and editing, K.W.P., G.S.M., C.W.H.; supervision, G.S.M., C.W.H.; funding acquisition, G.S.M., C.W.H. All authors have read and agreed to the published version of the manuscript.
Funding
This research was funded by the National Science Foundation (NSF) award NSF EAR 1740082, and by the U.S. Department of Agriculture (USDA) award OREZ-FERN-852-E.
Institutional Review Board Statement
Not applicable, this study did not involve humans or animals.
Informed Consent Statement
Not Applicable.
Data Availability Statement
The Jupyter notebook file used for the calculation presented in this study is openly available in the Oregon State University Scholars archive at https://doi.org/10.7267/mc87px76j. A browser accessible version of the notebook is also available at https://mybinder.org/v2/gh/proctork/Reduced-Order-Agrivoltaic-Cost-Estimate/HEAD.
Acknowledgments
The authors wish to express gratitude to the OSU NEWAg lab, Peter Hong, and Chiara Wychera for constructive feedback on this manuscript.
Conflicts of Interest
The authors declare no conflict of interest. The funders had no role in the design of the study; in the collection, analyses, or interpretation of data; in the writing of the manuscript, or in the decision to publish the results.
References
- Masson-Delmotte, V.; Zhai, P.; Pörtner, H.O.; Roberts, D.; Skea, J.; Shukla, P.R.; Pirani, A.; Moufouma-Okia, W.; Péan, C.; Pidcock, R.; et al. Global Warming of 1.5 °C. An IPCC Special Report on the Impacts of Global Warming of 1.5 °C above Pre-Industrial Levels and Related Global Greenhouse Gas Emission Pathways, in the Context of Strengthening the Global Response to the Threat of Climate Change; IPCC: Geneva, Switzerland, 2018. [Google Scholar]
- United States of America House of Representative. H. Res. 109: Recognizing the Duty of the Federal Government to Create a Green New Deal; United States of America House of Representative: Washington, DC, USA, 2019.
- Dinesh, H.; Pearce, J. The Potential of Agrivoltaic Systems. Renew. Sustain. Energy Rev. 2016, 54, 299–308. [Google Scholar] [CrossRef] [Green Version]
- Barron-Gafford, G.; Pavao-Zuckerman, M.; Minor, R.; Sutter, L.; Barnett-Moreno, I.; Blackett, D.; Thompson, M.; Dimond, K.; Gerlak, A.; Nabhan, G.; et al. Agrivoltaics provide mutual benefits across the food–energy–water nexus in drylands. Nat. Sustain. 2019, 2. [Google Scholar] [CrossRef]
- Weselek, A.; Ehmann, A.; Zikeli, S.; Lewandowski, I.; Schindele, S.; Högy, P. Agrophotovoltaic systems: Applications, challenges, and opportunities. A review. Agron. Sustain. Dev. 2019, 39. [Google Scholar] [CrossRef]
- Goetzberger, A.; Zastrow, A. On the Coexistence of Solar-Energy Conversion and Plant Cultivation. Int. J. Sol. Energy 1982, 1, 55–69. [Google Scholar] [CrossRef]
- Capellán-Pérez, I.; de Castro, C.; Arto, I. Assessing vulnerabilities and limits in the transition to renewable energies: Land requirements under 100% solar energy scenarios. Renew. Sustain. Energy Rev. 2017, 77, 760–782. [Google Scholar] [CrossRef] [Green Version]
- IRENA. Renewable Power Generation Costs in 2019; International Renewable Energy Agency: Abu Dhabi, UAE, 2020; ISBN 9789292602444. [Google Scholar]
- SEIA Solar Industry Data. Available online: https://www.seia.org/solar-industry-research-data (accessed on 7 July 2020).
- Gençer, E.; Miskin, C.; Sun, X.; Khan, M.R.; Bermel, P.; Alam, M.A.; Agrawal, R. Directing solar photons to sustainably meet food, energy, and water needs. Sci. Rep. 2017, 7, 3133. [Google Scholar] [CrossRef] [PubMed]
- Ong, S.; Campbell, C.; Denholm, P.; Margolis, R.; Heath, G. Land-Use Requirements for Solar Power Plants in the United States; National Renewable Energy Laboratory: Golden, CO, USA, 2013.
- Sorensen, A.A.; Freedgood, J.; Dempsey, J.; Theobald, D.M. Farms under Threat: The State of America’s Farmland; American Farmland Trust: Washington, DC, USA, 2018. [Google Scholar]
- Graham, S.M.; Ates, A.; Melathopoulos, A.; Moldenke, C.H. Pollinator-Focused Solar: Observations of Plant-Pollinator Interactions in the Agrivoltaic Understory; Oregon State University: Corvallis, OR, USA, 2020. [Google Scholar]
- Gallai, N.; Salles, J.-M.; Settele, J.; Vaissière, B.E. Economic valuation of the vulnerability of world agriculture confronted with pollinator decline. Ecol. Econ. 2009, 68, 810–821. [Google Scholar] [CrossRef]
- Veissier, I.; Van laer, E.; Palme, R.; Moons, C.P.H.; Ampe, B.; Sonck, B.; Andanson, S.; Tuyttens, F.A.M. Heat stress in cows at pasture and benefit of shade in a temperate climate region. Int. J. Biometeorol. 2018, 62, 585–595. [Google Scholar] [CrossRef]
- Maia, A.S.C.; de Culhari, E.A.; de Fonsêca, V.F.C.; Milan, H.F.M.; Gebremedhin, K.G. Photovoltaic panels as shading resources for livestock. J. Clean. Prod. 2020, 258, 120551. [Google Scholar] [CrossRef]
- Parkinson, S.; Hunt, J. Economic Potential for Rainfed Agrivoltaics in Groundwater-Stressed Regions. Environ. Sci. Technol. Lett. 2020. [Google Scholar] [CrossRef]
- Adeh, E.H.; Selker, J.S.; Higgins, C.W. Remarkable agrivoltaic influence on soil moisture, micrometeorology and water-use efficiency. PLoS ONE 2018, 13, e0203256. [Google Scholar] [CrossRef]
- Younas, R.; Imran, H.; Riaz, M.H.; Butt, N. Agrivoltaic Farm Design: Vertical Bifacial vs. Tilted Monofacial Photovoltaic Panels. arXiv 2019, arXiv191001076. [Google Scholar]
- Marrou, H.; Wery, J.; Dufour, L.; Dupraz, C. Productivity and radiation use efficiency of lettuces grown in the partial shade of photovoltaic panels. Eur. J. Agron. 2013, 44, 54–66. [Google Scholar] [CrossRef]
- Elamri, Y.; Cheviron, B.; Lopez, J.-M.; Dejean, C.; Belaud, G. Water budget and crop modelling for agrivoltaic systems: Application to irrigated lettuces. Agric. Water Manag. 2018, 208, 440–453. [Google Scholar] [CrossRef]
- Sekiyama, T.; Nagashima, A. Solar Sharing for Both Food and Clean Energy Production: Performance of Agrivoltaic Systems for Corn, A Typical Shade-Intolerant Crop. Environments 2019, 6, 65. [Google Scholar] [CrossRef] [Green Version]
- Ravi, S.; Lobell, D.B.; Field, C.B. Tradeoffs and Synergies between Biofuel Production and Large Solar Infrastructure in Deserts. Environ. Sci. Technol. 2014, 48, 3021–3030. [Google Scholar] [CrossRef]
- Malu, P.R.; Sharma, U.S.; Pearce, J.M. Agrivoltaic potential on grape farms in India. Sustain. Energy Technol. Assess. 2017, 23, 104–110. [Google Scholar] [CrossRef] [Green Version]
- Othman, N.F.; Ya’acob, M.E.; Abdul-Rahim, A.S.; Shahwahid Othman, M.; Radzi, M.A.M.; Hizam, H.; Wang, Y.D.; Ya’acob, A.M.; Jaafar, H.Z.E. Embracing new agriculture commodity through integration of Java Tea as high Value Herbal crops in solar PV farms. J. Clean. Prod. 2015, 91, 71–77. [Google Scholar] [CrossRef]
- Tsubo, M.; Walker, S. Shade Effects on Phaseolus vulgaris L. Intercropped with Zea mays L. under Well-Watered Conditions. J. Agron. Crop Sci. 2004, 190, 168–176. [Google Scholar] [CrossRef]
- Fan, Y.; Chen, J.; Cheng, Y.; Raza, M.A.; Wu, X.; Wang, Z.; Liu, Q.; Wang, R.; Wang, X.; Yong, T.; et al. Effect of shading and light recovery on the growth, leaf structure, and photosynthetic performance of soybean in a maize-soybean relay-strip intercropping system. PLoS ONE 2018, 13, e0198159. [Google Scholar] [CrossRef]
- Aroca-delgado, R.; Jos, P.; Jes, Á. Compatibility between Crops and Solar Panels: An Overview from Shading Systems. Sustainability 2018, 10, 743. [Google Scholar] [CrossRef] [Green Version]
- Liu, X.; Elgowainy, A.; Wang, M. Life cycle energy use and greenhouse gas emissions of ammonia production from renewable resources and industrial by-products. Green Chem. 2020, 22, 5751–5761. [Google Scholar] [CrossRef]
- Cox, S.; Gagnon, P.; Stout, S.; Zinaman, O.; Watson, A.; Hotchkiss, E. Distributed Generation to Support Development-Focused Climate Action; National Renewable Energy Lab: Golden, CO, USA, 2016. [CrossRef] [Green Version]
- Wiser, R.; Millstein, D.; Mai, T.; Macknick, J.; Carpenter, A.; Cohen, S.; Cole, W.; Frew, B.; Heath, G. The environmental and public health benefits of achieving high penetrations of solar energy in the United States. Energy 2016, 113, 472–486. [Google Scholar] [CrossRef] [Green Version]
- Baird, R. The Impact of Climate Change on Minorities and Indigenous Peoples; Minority Rights Group International: London, UK, 2008. [Google Scholar]
- Islam, S.; Winkel, J. Climate Change and Social Inequality; DESA Working Paper No. 152; ST/ESA/2017/DWP/152; Department of Economic & Social Affairs: New York, NY, USA, 2017. [Google Scholar]
- Hand, M.M.; Baldwin, S.; DeMeo, E.; Reilly, J.M.; Mai, T.; Arent, D.; Porro, G.; Meshek, M.; Sandor, D. Renewable Electricity Futures Study; National Renewable Energy Laboratory: Golden, CO, USA, 2012.
- Energy Information Administration. Annual Electric Generator Report EIA Form-860 d; United States Energy Information Administration: Washington, DC, USA, 2019.
- Electric Power Monthly: Table 6.07.B. Capacity Factors for Utility Scale Generators Primarily Using Non-Fossil Fuels. Available online: https://www.eia.gov/electricity/monthly/epm_table_grapher.php?t=epmt_6_07_b (accessed on 19 December 2020).
- Jordan, D.; Kurtz, S. Overview of Field Experience-Degradation Rates & Lifetimes; NREL National Renewable Energy Laboratory: Golden, CO, USA, 2015.
- Energy Information Administration. Frequently Asked Questions How Much Carbon Dioxide Is Produced Per Kilowatthour of U.S. Electricity Generation? Available online: https://www.eia.gov/tools/faqs/faq.php?id=74&t=11#:~:text=In 2018%2C total U.S. electricity,of CO2 emissions per kWh (accessed on 5 July 2020).
- IPCC. Climate Change 2014: Impacts, Adaptation, and Vulnerability. Part B: Regional Aspects. Contribution of Working Group II to the Fifth Assessment Report of the Intergovernmental Panel on Climate Change; Barros, V.R., Field, C.B., Dokken, D.J., Mastrandre, M.D., Eds.; Cambridge University Press: Cambridge, UK; New York, NY, USA, 2014. [Google Scholar]
- Hondo, H.; Moriizumi, Y. Employment creation potential of renewable power generation technologies: A life cycle approach. Renew. Sustain. Energy Rev. 2017, 79, 128–136. [Google Scholar] [CrossRef]
- Ould Amrouche, S.; Rekioua, D.; Rekioua, T.; Bacha, S. Overview of energy storage in renewable energy systems. Int. J. Hydrog. Energy 2016, 41, 20914–20927. [Google Scholar] [CrossRef]
- Fu, R.; Remo, T.; Margolis, R. 2018 U.S. Utility-Scale PhotovoltaicsPlus-Energy Storage System Costs Benchmark; National Renewable Energy Laboratory: Golden, CO, USA, 2018.
- Energy Information Administration State Electricity Profile. Available online: https://www.eia.gov/electricity/state/ (accessed on 7 February 2020).
- Freyman, T.; Tran, T. Renewable Energy Discount Rate Survey Results—2018. Available online: https://www.grantthornton.co.uk/insights/renewable-energy-discount-rate-survey-2018/ (accessed on 7 July 2020).
- US EPA Greenhouse Gas Emissions from a Typical Passenger Vehicle. Available online: https://nepis.epa.gov/Exe/ZyPDF.cgi?Dockey=P100U8YT.pdf (accessed on 1 July 2020).
- United States Office of Management and Budget Budget of the United States Government. Available online: https://www.govinfo.gov/app/collection/budget/2019/BUDGET-2019-TAB (accessed on 8 September 2020).
- Majumdar, D.; Pasqualetti, M.J. Dual use of agricultural land: Introducing ‘agrivoltaics’ in Phoenix Metropolitan Statistical Area, USA. Landsc. Urban Plan. 2018, 170, 150–168. [Google Scholar] [CrossRef]
- Hassanpour, E.; Good, S.; Calaf, M.; Higgins, C. Solar PV Power Potential is Greatest over Croplands. Sci. Rep. 2019, 9. [Google Scholar] [CrossRef]
- Carley, S.; Konisky, D. The justice and equity implications of the clean energy transition. Nat. Energy 2020, 5. [Google Scholar] [CrossRef]
- Blattner, C. Just Transition for Agriculture? A Critical Step in Tackling Climate Change. J. Agric. Food Syst. Community Dev. 2020, 9, 1–6. [Google Scholar] [CrossRef] [Green Version]
- Carley, S.; Evans, T.P.; Konisky, D.M. Adaptation, culture, and the energy transition in American coal country. Energy Res. Soc. Sci. 2018, 37, 133–139. [Google Scholar] [CrossRef] [Green Version]
- Cameron, L.; van der Zwaan, B. Employment factors for wind and solar energy technologies: A literature review. Renew. Sustain. Energy Rev. 2015, 45, 160–172. [Google Scholar] [CrossRef] [Green Version]
- Brabec, E.; Smith, C. Agricultural land fragmentation: The spatial effects of three land protection strategies in the eastern United States. Landsc. Urban Plan. 2002, 58, 255–268. [Google Scholar] [CrossRef] [Green Version]
- Carlisle, L.; de Wit, M.M.; De Longe, M.S.; Calo, A.; Getz, C.; Ory, J.; Munden-Dixon, K.; Galt, R.; Melone, B.; Knox, R.; et al. Securing the future of US agriculture: The case for investing in new entry sustainable farmers. Elem. Sci. Anthr. 2019, 7. [Google Scholar] [CrossRef] [Green Version]
- Pender, J.; Thomas, H.; John, C.; Tracey, F. Rural America at a Glance; 2019 Edition Economic Information Bulletin No. EIB-212; USDA Economic Research Service: Washington, DC, USA, 2019.
Figure 1.
Comparison of Current US photovoltaic (PV) capacity and required PV capacity to meet 20% of 2019 US Electricity Generation (assuming capacity factor = 24.5%).
Figure 1.
Comparison of Current US photovoltaic (PV) capacity and required PV capacity to meet 20% of 2019 US Electricity Generation (assuming capacity factor = 24.5%).

Figure 2.
Comparison of Amortized Agrivoltaic costs with United States Federal Fiscal Year 2019 Budget [46].
Figure 2.
Comparison of Amortized Agrivoltaic costs with United States Federal Fiscal Year 2019 Budget [46].


Table 1.
Alignment of Agrivoltaic Benefits with Green New Deal Goals.
| Green New Deal Goal (Text Directly Quoted from US H. Res. 109 [2]) | Alignment with Agrivoltaic Systems |
|---|---|
| “ (A) to achieve net-zero greenhouse gas emissions through a fair and just transition for all communities and workers” |
|
| “(B) to create millions of good, high-wage jobs and ensure prosperity and economic security for all people of the United States;” |
|
| “(C) to invest in the infrastructure and industry of the United States to sustainably meet the challenges of the 21st century;” |
|
“(D) to secure for all people of the United States for generations to come—
|
|
| “(E) to promote justice and equity by stopping current, preventing future, and repairing historic oppression of indigenous peoples, communities of color, migrant communities, deindustrialized communities, depopulated rural communities, the poor, low-income workers, women, the elderly, the unhoused, people with disabilities, and youth (referred to in this resolution as “frontline and vulnerable communities”)” |
|
Table 2.
Sensitivity analysis for net present value (NPV). Base NPV = $35.72 billion.
| Input Parameter | Base Value | Perturbed Value | Response NPV (Billion $) | Relative Sensitivity |
|---|---|---|---|---|
| Electricity Generation (GWh) | 824,000 | 906,400 | 39.29 | 1 |
| Capacity Factor (−) | 0.245 | 0.270 | 107.57 | 20.12 |
| Capex ($/watt) | 2 | 2.20 | −34.76 | −19.73 |
| O & M ($/kWh/year) | 19 | 20.90 | 27.16 | −2.40 |
| Discount rate (−) | 0.06 | 0.066 | −3.54 | −10.99 |
| Project Life (year) | 25 | 27.5 | 58.09 | 6.26 |
| Electricity price ($/kWh) | 0.1053 | 0.1158 | 118.33 | 23.13 |
Publisher’s Note: MDPI stays neutral with regard to jurisdictional claims in published maps and institutional affiliations. |
© 2020 by the authors. Licensee MDPI, Basel, Switzerland. This article is an open access article distributed under the terms and conditions of the Creative Commons Attribution (CC BY) license (http://creativecommons.org/licenses/by/4.0/).
Share and Cite
MDPI and ACS Style
Proctor, K.W.; Murthy, G.S.; Higgins, C.W. Agrivoltaics Align with Green New Deal Goals While Supporting Investment in the US’ Rural Economy. Sustainability 2021, 13, 137. https://doi.org/10.3390/su13010137
AMA Style
Proctor KW, Murthy GS, Higgins CW. Agrivoltaics Align with Green New Deal Goals While Supporting Investment in the US’ Rural Economy. Sustainability. 2021; 13(1):137. https://doi.org/10.3390/su13010137
Chicago/Turabian StyleProctor, Kyle W., Ganti S. Murthy, and Chad W. Higgins. 2021. "Agrivoltaics Align with Green New Deal Goals While Supporting Investment in the US’ Rural Economy" Sustainability 13, no. 1: 137. https://doi.org/10.3390/su13010137
Note that from the first issue of 2016, this journal uses article numbers instead of page numbers. See further details here.