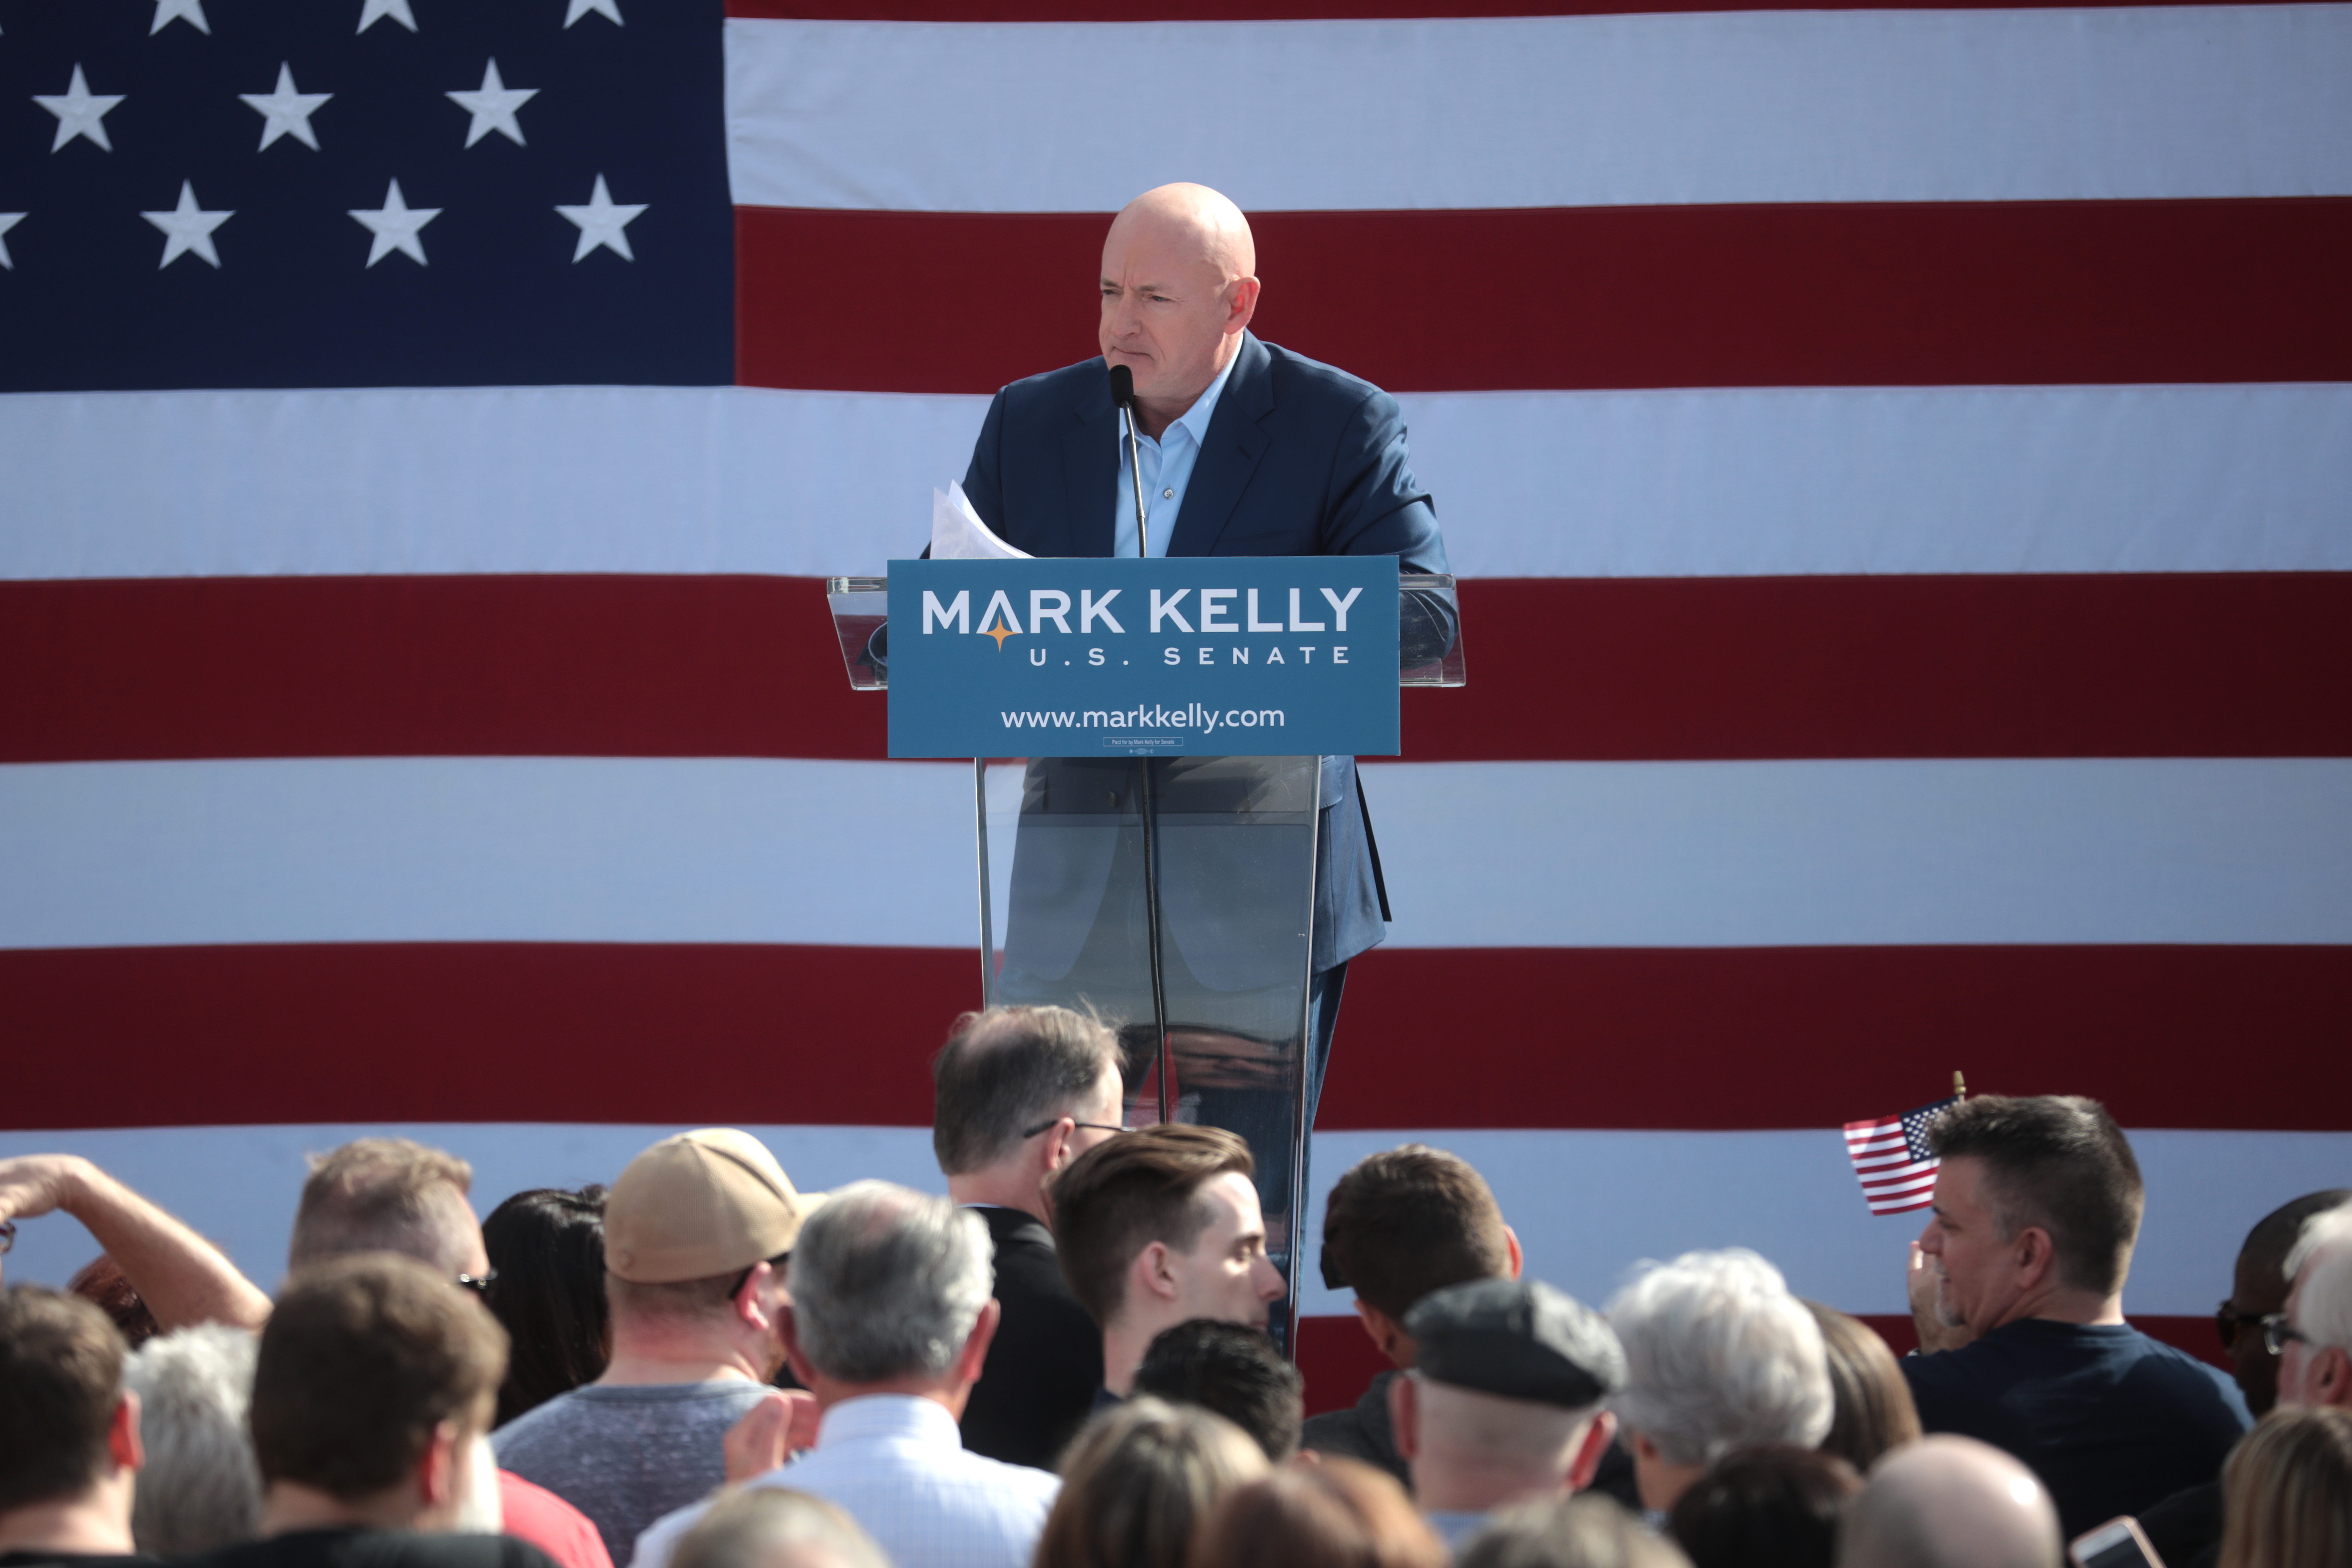
Photo Gage Skidmore/flickr
Dem Ad Volume Higher Overall;
Record Breaking Number of Federal Ads by Groups
(MIDDLETOWN, CT) October 20, 2022 – Outside group advertising on television in federal races is breaking records, according to a new analysis by the Wesleyan Media Project. In just the last two weeks alone, the Republican super PAC, Congressional Leadership Fund, has targeted ads in 42 different U.S. House races, while the Democratic super PAC, House Majority PAC, has been active in 27.
Table 1 shows the groups that have sponsored the most ads in the past two weeks and the races in which they are active. Topping the list is the pro-GOP Congressional Leadership Fund, which has sponsored over 30,000 television ads in the past two weeks across 42 different House races. The pro-Democratic House Majority PAC, by contrast, has aired about 12,500 ads and is active in 27 House races.
“Certainly, Republicans see a wider playing field in the House in 2022 than do Democrats, and their main super PAC, the Congressional Leadership Fund, has more than doubled the ad volumes from the main Democratic super PAC, House Majority PAC, over the past two weeks” said Travis Ridout, co-director of the Wesleyan Media Project. “But a focus on ad activity from these two groups obscures that fact that, overall, pro-Democratic ads have outnumbered pro-Republican ads in the House.”
Between October 3 and 16, pro-Democratic ads in the House numbered 112,000 compared to 86,000 pro-Republican ads.
“Republicans have been much more reliant on ads aired by groups, but group dollars don’t go as far on television because only candidates are entitled to television stations’ lowest unit rate costs,” said Erika Franklin Fowler, co-director of the Wesleyan Media Project. “So even though Congressional Leadership Fund is spending heavily on broadcast in 42 races, pro-Republican ads only outnumber pro-Democratic ones in 17 of those races.”
Table 1: Top Group Sponsors (October 3 to October 16)
| Sponsor | Affiliation | Airings | Races | Group type |
|---|---|---|---|---|
| Congressional Leadership Fund | Republican | 30,073 | AZ06, CA13, CA22, CA47, CA49, CO08, CT05, FL27, IA01, IA02, IA03, IL17, IN01, KS03, ME02, MI03, MI07, MI08, MN02, NC13, NE02, NH01, NJ07, NM02, NV01, NV03, NY19, NY22, OH01, OH13, OR04, OR05, PA07, PA08, PA17, RI02, TX28, TX34, VA02, VA07, WA08, WI03 | Super PAC/partial |
| Senate Leadership Fund | Republican | 22,022 | AK-Sen, GA-Sen, NC-Sen, NH-Sen, NV-Sen, OH-Sen, PA-Sen, WI-Sen | Super PAC/partial |
| Senate Majority PAC | Democrat | 13,922 | AZ-Sen, NC-Sen, NH-Sen, NV-Sen, PA-Sen, WI-Sen | Super PAC/partial |
| House Majority PAC | Democrat | 12,554 | AZ04, CA13, CA22, CA49, CO08, CT05, IL13, IN01, ME02, MI03, NC01, NC13, NE02, NH01, NM02, NV01, NV03, NV04, NY22, OH01, OH09, OR06, PA07, PA17, RI02, VA07, WA08 | Carey PAC/partial |
| Put MI First | Democrat | 3,549 | MI-Gov | State IE Comm./full |
| FF PAC | Democrat | 3,042 | AZ-Gov, NV-Gov, PA-Sen | Carey PAC/partial |
| Alliance For Common Sense | Democrat | 2,934 | WI-Gov | 527/partial |
| Kansas Values Institute | Democrat | 2,800 | KS-Gov | 501c/none |
| Georgia Honor | Democrat | 2,592 | GA-Sen | Super PAC/partial |
| Coulda Been Worse LLC | Democrat | 2,339 | TX-Gov | Corp./none |
| A Stronger New Mexico | Democrat | 2,203 | NM-Gov | 527/full |
| Club For Growth Action | Republican | 2,009 | NC-Sen, NV-Sen, UT-Sen | Super PAC/partial |
| Right Direction Wisconsin Pac | Republican | 2,006 | WI-Gov | State PAC/full |
| People Who Play by The Rules PAC | Republican | 1,960 | IL-Gov | State IE Comm./full |
| Women Vote | Democrat | 1,521 | IL13, WA-Sen | Super PAC/partial |
| Wisconsin Truth PAC | Republican | 1,373 | WI-Sen | Super PAC/full |
| Save America Fund | Democrat | 1,294 | OH-Sen | Super PAC/full |
| Alliance For a Better Minnesota Action Fund | Democrat | 1,236 | MN-Gov | State IE Comm./full |
| Better Maine | Democrat | 1,142 | ME-Gov | State PAC/partial |
| Imagine This Oklahoma | Democrat | 1,086 | OK-Gov | State IE Comm./full |
| The Oklahoma Project | Democrat | 1,076 | OK-Gov | State SuperPAC/full |
| LCV Victory Fund | Democrat | 1,037 | CO-Sen* | Super PAC/partial |
| *The LCV Victory Fund also sponsored 241 ads in the NH Senate race that were co-sponsored with Environmental Defense Fund Action Votes, which is not included in the total above. Figures are from October 3, 2022, to October 16, 2022. Numbers include broadcast television for all sponsors. Group type and disclosure status come from OpenSecrets. CITE SOURCE OF DATA AS: Kantar/CMAG with analysis by the Wesleyan Media Project. |
||||
On the Senate side, the pro-Republican Senate Leadership Fund has sponsored 22,000 airings over the past two weeks in eight Senate campaigns. The pro-Democratic Senate Majority PAC has sponsored just under 14,000 airings in six Senate races. The two groups are active in many of the same races.
“With many Republican candidates in competitive races falling short of their Democratic rivals in fundraising, outside groups supporting Republicans have had to set up,” said Brendan Glavin, Senior Data Analyst at OpenSecrets.
In partnership with OpenSecrets, the Wesleyan Media Project also tracks outside group ad spending by the type of donor disclosure. We classify groups as full-disclosure groups (meaning they disclose contributor lists to the relevant reporting agency at the federal or state level), non-disclosing dark money groups (which are not required to disclose publicly their donors; these are most often 501c4 non-profits), and partial-disclosure groups (those that disclose donors but also accept contributions from dark money sources). The top four outside groups in the past two weeks are partial disclosing ones, three of which register with the Federal Election Commission as super PACs. Of the 22 groups listed in Table 1 (which shows groups that aired at least 1,000 television spots in the last two weeks), nine are full disclosure, 11 are partial disclosing, and two are non-disclosing dark money groups.
Historically High Group Activity as Money Pours into House Races
The Wesleyan Media Project also examined outside group efforts in the six previous election cycles, for the full cycle up to October 16 in each cycle. The percentage of total ads sponsored by groups is shown in Table 2, which focuses on broadcast television spots.
One change from past years is that groups are sponsoring a much greater percentage of House ads this year, as Table 2 shows. Over 35 percent of broadcast television ads in House races in this election cycle have come from groups, breaking the previous record of 21 percent in 2018. The percentage of ads sponsored by groups in Senate and gubernatorial races in the current cycle is comparable to past cycles, though the Senate percentage—almost 41 percent—is the highest in data going back to 2012.
Table 2: Percentage of Ads Sponsored by Groups
| Cycle | U.S. House | U.S. Senate | Gov |
|---|---|---|---|
| 2012 | 17.7% | 30.4% | 29.5% |
| 2014 | 17.3% | 38.8% | 22.2% |
| 2016 | 12.2% | 39.7% | 21.0% |
| 2018 | 21.1% | 37.2% | 16.5% |
| 2020 | 21.0% | 33.6% | 21.0% |
| 2022 | 35.4% | 40.6% | 18.1% |
| Figures are from January 6, 2021, to October 16, 2022. Numbers include broadcast television for all sponsors. CITE SOURCE OF DATA AS: Kantar/CMAG with analysis by the Wesleyan Media Project. |
|||
“The huge uptick in group advertising this cycle is a consequence of many factors,” said Michael Franz, co-director of the Wesleyan Media Project. “Some groups earlier in the cycle waded into primary campaigns in the House given redistricting, which forced many representatives into new districts or member-on-member contests. We’re also seeing a lot of battles within the Republican Party between the traditional wing and the Trump wing. And, of course, control of both the House and Senate is up for grabs, drawing a lot of investments in close races in the general election.”
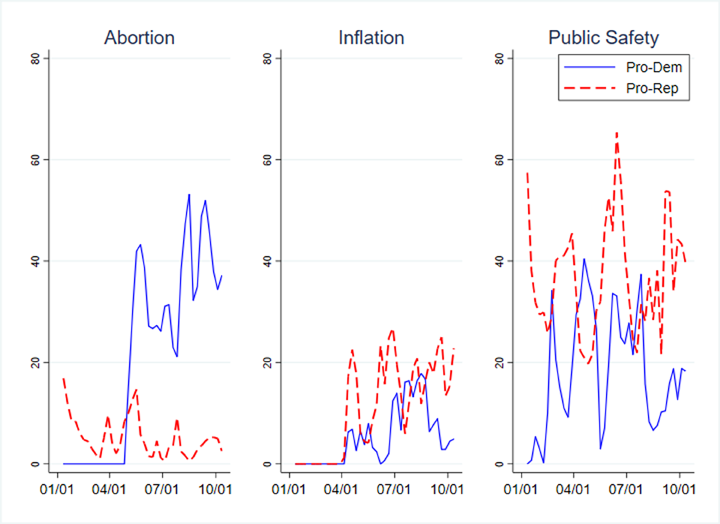
GOP Ads Silent on Abortion; Dems Back Off Inflation Discussion
Democrats are not backing down from discussion of the issue of abortion, while Republicans have ramped up discussion of inflation. Figure 1 shows the percentage of ads in each week since January 1 that mention the issues of abortion, inflation and public safety, with red lines indicating pro-Republican messaging and blue lines indicating pro-Democratic messaging. Abortion has been mentioned in about 40 percent of pro-Democratic ads in federal races in the past two weeks, while Republican discussion of the issue has been extremely low. Ads for both parties discussed inflation during the early summer, but since then, pro-Democratic ads have avoided mentions of inflation while pro-Republican ads have increased their discussion of inflation. Both parties have been discussing public safety, though the issue has risen in importance in Republican ads over the past six weeks.
Figure 1: Discussion of Issues in Federal Races by Party over Time
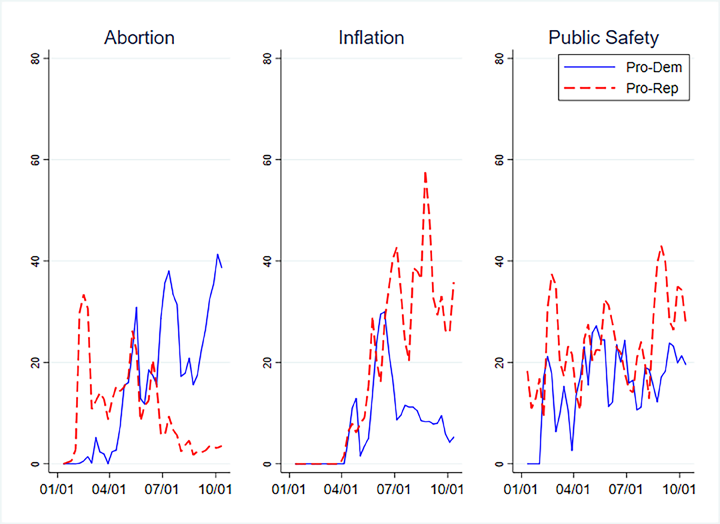
Figures are percentages of each sides’ advertising from January 1, 2022, to October 16, 2022. Numbers include broadcast television for all sponsors.
CITE SOURCE OF DATA AS: Kantar/CMAG with analysis by the Wesleyan Media Project.
*For an additional aggregation of “inflation” in ad audio, see here.
Figure 2 depicts the same data for races for governor. Here the difference in discussion of abortion by party is even more stark, with no Democratic discussion of the issue until May when it rocketed to a high level. Pro-Democratic ads quite frequently discussed inflation during the summer, but discussion has declined since that point, while mentions of inflation in pro-Republican ads remains at a higher level. Public safety has dominated issue mentions in pro-Republican gubernatorial ads, though pro-Democratic ads have not shied away from the issue.
Figure 2: Discussion of Issues in Governor Races by Party over Time
Figures are percentages of each party’s advertising from January 1, 2022, to October 16, 2022.
Numbers include broadcast television for all sponsors.
CITE SOURCE OF DATA AS: Kantar/CMAG with analysis by the Wesleyan Media Project.
Las Vegas, Portland, Philly Top Media Markets
The Las Vegas media market has seen more ad airings in House, Senate and gubernatorial races over the past two weeks (more than 18,000) than any other media market. This is thanks to several competitive races in the state, including a race for Senate, governor and three competitive House races. Portland, Oregon, is number two on the list. Oregon is home to several competitive House races and a competitive three-way race for governor.
Table 3: Top Media Markets (October 3 to October 16)
| Media Market | U.S. Senate Airings | U.S. House Airings | Gov Airings | Total |
|---|---|---|---|---|
| Las Vegas | 7,556 | 7,121 | 3,520 | 18,197 |
| Portland, OR | 552 | 6,398 | 4,581 | 11,531 |
| Philadelphia | 5,543 | 4,363 | 1,210 | 11,116 |
| Phoenix | 5,884 | 1,923 | 2,957 | 10,764 |
| Denver | 3,931 | 3,427 | 2,218 | 9,576 |
| Fresno | 0 | 9,343 | 0 | 9,343 |
| Albuquerque | 26 | 4,102 | 4,787 | 8,915 |
| Milwaukee | 4,490 | 242 | 4,171 | 8,903 |
| Atlanta | 5,543 | 0 | 3,223 | 8,766 |
| Seattle | 3,698 | 4,756 | 0 | 8,454 |
| Reno | 5,326 | 0 | 3,094 | 8,420 |
| Portland, ME | 1,591 | 3,464 | 2,746 | 7,801 |
| Chicago | 390 | 3,622 | 3,614 | 7,626 |
| Boston | 4,511 | 2,003 | 931 | 7,445 |
| Hartford | 1,457 | 2,645 | 3,149 | 7,251 |
| Green Bay | 4,075 | 0 | 3,112 | 7,187 |
| Kansas City | 1,866 | 3,278 | 1,756 | 6,900 |
| Tucson | 2,984 | 2,087 | 1,810 | 6,881 |
| Bakersfield | 0 | 6,793 | 0 | 6,793 |
| El Paso | 0 | 2,719 | 3,842 | 6,561 |
| Figures are from October 3, 2022, to October 16, 2022. Numbers include broadcast television for all sponsors. CITE SOURCE OF DATA AS: Kantar/CMAG with analysis by the Wesleyan Media Project. |
||||
Warnock, Kelly Top Candidate Spenders; Digital Ads More Prominent in Some but Not All Races
As has been the case for much of the year, two incumbent Democratic Senators, Raphael Warnock in Georgia and Mark Kelly in Arizona, are the leading spenders on advertising (Table 4). Warnock’s campaign has spent an estimated $9.09 million on ads (including television, radio, and digital) over the past two weeks, with 22 percent of his spending on digital ads. Warnock’s Republican opponent, Herschel Walker, has spent $3.56 million. Kelly has spent $7.23 million on ads over the past two weeks, vastly more than his Republican opponent, Blake Masters, who has spent $1.28 million on ads.
In Nevada, the Democratic incumbent Catherine Cortez Masto is in a very competitive race and has spent over $4 million on ads in the past two weeks, most of it on broadcast television spots. Her opponent, Adam Laxalt, has spent about half that total, $2.16 million. Neither candidate has spent a significant amount on Facebook or Google ads. This is in comparison to the Democratic challenger in Wisconsin, Mandela Barnes, who has spent over $1 million on digital ads in the previous two weeks (in addition to nearly $4 million on television and radio ads).
Table 4: Ad Spending by Candidate Sponsors in Senate Races (October 3 to October 16)
| Sponsor | Party | State | TV Broadcast Cost (in $Ms) | Other TV & Radio Cost (in $Ms) | Facebook Cost (in $Ms) | Google Cost (in $Ms) | Total Cost (in $Ms) | % Digital |
|---|---|---|---|---|---|---|---|---|
| Warnock, Raphael | DEM | GA | 4.46 | 2.6 | 0.76 | 1.27 | 9.09 | 22% |
| Kelly, Mark | DEM | AZ | 5.28 | 1.48 | 0.23 | 0.25 | 7.23 | 7% |
| Barnes, Mandela | DEM | WI | 3.12 | 0.68 | 0.29 | 0.76 | 4.86 | 22% |
| Fetterman, John | DEM | PA | 3.23 | 0.64 | 0.24 | 0.6 | 4.71 | 18% |
| Masto, Catherine Cortez | DEM | NV | 3.84 | 0.05 | 0.06 | 0.19 | 4.15 | 6% |
| Oz, Mehmet | REP | PA | 3.75 | 0.22 | 0.02 | 0.13 | 4.13 | 4% |
| Rubio, Marco | REP | FL | 3.15 | 0.56 | 0.04 | 0.24 | 3.99 | 7% |
| Walker, Herschel | REP | GA | 2.01 | 1.31 | 0.05 | 0.19 | 3.56 | 7% |
| Ryan, Tim | DEM | OH | 2.36 | 0.61 | 0.15 | 0.42 | 3.55 | 16% |
| Demings, Val | DEM | FL | 2.65 | 0.28 | 0.34 | 0.23 | 3.49 | 16% |
| Hassan, Maggie | DEM | NH | 1.95 | 1.1 | 0.05 | 0.19 | 3.29 | 7% |
| Schumer, Chuck | DEM | NY | 1.69 | 1.1 | 0.07 | 0.11 | 2.97 | 6% |
| Johnson, Ron | REP | WI | 1.72 | 0.94 | 0.03 | 0.15 | 2.84 | 6% |
| Beasley, Cheri | DEM | NC | 1.76 | 0.42 | 0.04 | 0.35 | 2.57 | 15% |
| Laxalt, Adam | REP | NV | 1.29 | 0.75 | 0.02 | 0.11 | 2.16 | 6% |
| Bennet, Michael | DEM | CO | 1.52 | 0.27 | 0.18 | 0.11 | 2.08 | 14% |
| Busch Valentine, Trudy | DEM | MO | 1.14 | 0.46 | 0.01 | 0.29 | 1.9 | 16% |
| Murray, Patty | DEM | WA | 0.94 | 0.57 | 0.06 | 0.22 | 1.79 | 16% |
| Smiley, Tiffany | REP | WA | 0.95 | 0.46 | 0.01 | 0.06 | 1.47 | 5% |
| Vance, JD | REP | OH | 1.03 | 0.28 | 0 | 0.12 | 1.43 | 8% |
| Budd, Ted | REP | NC | 1.06 | 0.15 | 0 | 0.09 | 1.3 | 7% |
| Masters, Blake | REP | AZ | 1.08 | 0.09 | 0.05 | 0.06 | 1.28 | 9% |
| Duckworth, Tammy | DEM | IL | 0.8 | 0.28 | 0.07 | 0 | 1.15 | 6% |
| Kennedy, John | REP | LA | 0.6 | 0.37 | 0.04 | 0.08 | 1.09 | 11% |
| Grassley, Chuck | REP | IA | 0.74 | 0 | 0 | 0.01 | 0.75 | 1% |
| Blumenthal, Richard | DEM | CT | 0.34 | 0.37 | 0 | 0.02 | 0.72 | 2% |
| O'Dea, Joe | REP | CO | 0.63 | 0.03 | 0.01 | 0.04 | 0.71 | 7% |
| Scott, Tim | REP | SC | 0.29 | 0.32 | 0.01 | 0.06 | 0.68 | 10% |
| Schmitt, Eric | REP | MO | 0.67 | 0 | 0 | 0 | 0.67 | 0% |
| Paul, Rand | REP | KY | 0.27 | 0.31 | 0.01 | 0.04 | 0.63 | 7% |
| Crapo, Mike | REP | ID | 0.31 | 0.27 | 0.01 | 0.03 | 0.62 | 7% |
| Young, Todd | REP | IN | 0.38 | 0.16 | 0 | 0.06 | 0.61 | 11% |
| Bolduc, Don | REP | NH | 0.38 | 0.17 | 0 | 0.01 | 0.57 | 2% |
| Franken, Michael | DEM | IA | 0.35 | 0.05 | 0.08 | 0.03 | 0.51 | 21% |
| McMullin, Evan | UN | UT | 0.36 | 0.06 | 0.04 | 0.02 | 0.48 | 14% |
| Murkowski, Lisa | REP | AK | 0.23 | 0.1 | 0.06 | 0.08 | 0.47 | 30% |
| Lee, Mike | REP | UT | 0.32 | 0.03 | 0.03 | 0.04 | 0.42 | 16% |
| Hoeven, John | REP | ND | 0.35 | 0.03 | 0 | 0 | 0.37 | 0% |
| Wyden, Ron | DEM | OR | 0.24 | 0.03 | 0.02 | 0.03 | 0.32 | 15% |
| Mullin, Markwayne | REP | OK | 0.18 | 0 | 0 | 0 | 0.18 | 0% |
| Boozman, John | REP | AR | 0.11 | 0.02 | 0 | 0 | 0.14 | 0% |
| Horn, Kendra | DEM | OK | 0.03 | 0.03 | 0 | 0 | 0.07 | 4% |
| Mixon, Luke | DEM | LA | 0.06 | 0 | 0 | 0 | 0.06 | 3% |
| Welch, Peter | DEM | VT | 0.03 | 0.01 | 0 | 0.02 | 0.06 | 32% |
| Thune, John | REP | SD | 0.05 | 0 | 0 | 0 | 0.06 | 7% |
| Tshibaka, Kelly | REP | AK | 0.02 | 0 | 0 | 0.01 | 0.03 | 19% |
| McDermott, Tom | DEM | IN | 0 | 0.02 | 0 | 0 | 0.02 | 9% |
| Schatz, Brian | DEM | HI | 0 | 0 | 0 | 0 | 0.01 | 100% |
| Booker, Charles | DEM | KY | 0 | 0 | 0.01 | 0 | 0.01 | 100% |
| Meuser, Mark | REP | CA | 0 | 0 | 0.01 | 0 | 0.01 | 100% |
| Malloy, Gerald | REP | VT | 0 | 0 | 0 | 0 | 0.01 | 3% |
| Lankford, James | REP | OK | 0 | 0 | 0 | 0 | 0.01 | 13% |
| TV and radio figures are from October 3, 2022, to October 16, 2022. Figures include coordinated spending between candidates and parties. Numbers include broadcast television, local and national cable, radio, and satellite television. Facebook figures are from October 2, 2022, to October 15, 2022. Google figures are from October 2, 2022, to October 15, 2022. Spending figures smaller than $5,000 will show as $0 in this table. Table includes candidates heading into the general election with at least $5,000 in total spending across these sources. Candidate status provided by OpenSecrets and the Wesleyan Media Project. CITE SOURCE OF DATA AS: Kantar/CMAG (for TV and radio) and the Google and Facebook Ad Libraries (for digital) with analysis by the Wesleyan Media Project. |
||||||||
Additionally, the Wesleyan Media Project is looking at the content of digital ads placed on Facebook. For this report, WMP examined general election Senate candidates and their Facebook ads in the first half of October. A longer description of the methodology of the estimates in Table 5 is provided at the end of this report. WMP assessed whether each of the Facebook ads purchased by Senate candidates to determine whether they were likely intended to persuade voters to cast a ballot for or against a candidate or were intended to raise money. The analysis also examines the geographic reach of these ads, reporting the percentage of impressions on Facebook that were in the candidate’s state.
There is a lot of variation across candidates in the goal and audience of their Facebook ads. Half of Georgia Senator Raphael Warnock’s ads on Facebook in October were fund-raising messages, with 7 in 10 impressions outside of Georgia. Democrat Val Demings in Florida is even more focused on fund-raising in her paid Facebook ads, with only 15 percent of her ads coded as persuasion messages versus 82 percent focused on raising money. Of top spenders, Mandela Barnes in Wisconsin and Mark Kelly in Arizona are comparatively more focused on persuading voters over raising money, but only Barnes has a larger in-state audience than out-of-state audience.
Table 5: Facebook Ad Spending by Senate Candidates (October 2 to October 15)
| Sponsor | Party | State | Pct Goal Persuade | Pct Goal Fundraising | Pct In-State | Est. Spend from Fb Ad Library Report |
|---|---|---|---|---|---|---|
| Warnock, Raphael | DEM | GA | 26% | 50% | 31% | 755,724 |
| Demings, Val | DEM | FL | 15% | 82% | 28% | 335,725 |
| Barnes, Mandela | DEM | WI | 72% | 26% | 58% | 292,061 |
| Fetterman, John | DEM | PA | 26% | 73% | 45% | 240,407 |
| Kelly, Mark | DEM | AZ | 54% | 46% | 44% | 227,252 |
| Bennet, Michael | DEM | CO | 74% | 26% | 78% | 176,647 |
| Ryan, Tim | DEM | OH | 34% | 66% | 44% | 149,968 |
| Franken, Michael T | DEM | IA | 7% | 93% | 10% | 79,616 |
| Schumer, Charles E | DEM | NY | 100% | 0% | 100% | 72,840 |
| Duckworth, L. Tammy | DEM | IL | 73% | 27% | 63% | 67,060 |
| Cortez Masto, Catherine | DEM | NV | 42% | 53% | 44% | 61,719 |
| Murkowski, Lisa | REP | AK | 98% | 0% | 100% | 60,715 |
| Murray, Patty | DEM | WA | 71% | 26% | 97% | 58,933 |
| Hassan, Maggie | DEM | NH | 46% | 54% | 48% | 52,241 |
| Walker, Herschel | REP | GA | 30% | 62% | 41% | 52,045 |
| Masters, Blake | REP | AZ | 100% | 0% | 100% | 46,184 |
| Kennedy, John Neely | REP | LA | 59% | 12% | 71% | 42,522 |
| Rubio, Marco | REP | FL | 8% | 82% | 29% | 41,978 |
| McMullin, Evan | UN | UT | 31% | 67% | 46% | 40,993 |
| Beasley, Cheri | DEM | NC | 60% | 40% | 43% | 35,645 |
| Johnson, Ron | REP | WI | 94% | 4% | 95% | 34,207 |
| Lee, Mike | REP | UT | 7% | 75% | 45% | 29,343 |
| Oz, Mehmet Dr | REP | PA | 0% | 85% | 12% | 18,678 |
| Wyden, Ronald Lee | DEM | OR | 100% | 0% | 89% | 15,693 |
| Laxalt, Adam | REP | NV | 100% | 0% | 100% | 15,672 |
| Scott, Timothy E | REP | SC | 58% | 0% | 41% | 13,197 |
| Smiley, Tiffany | REP | WA | 100% | 0% | 100% | 11,399 |
| Crapo, Michael D | REP | ID | 100% | 0% | 100% | 11,231 |
| O'Dea, Joseph Matthew | REP | CO | 23% | 77% | 88% | 11,212 |
| Paul, Rand | REP | KY | 90% | 5% | 88% | 8,144 |
| Booker, Charles | DEM | KY | 0% | 100% | 21% | 7,088 |
| Busch Valentine, Trudy | DEM | MO | 0% | 96% | 35% | 6,990 |
| Meuser, Mark | REP | CA | 100% | 0% | 96% | 6,938 |
| See the About the Data section for a description of the methodology used to produce this table. Figures are from October 2, 2022, to October 15, 2022. Table includes candidates heading into the general election with at least $5,000 in total spending as reported by Facebook. Candidate status provided by OpenSecrets and the Wesleyan Media Project. CITE SOURCE OF DATA AS: Facebook Ad Libraries (for digital) with analysis by the Wesleyan Media Project. |
||||||
Table 6 looks at the balance of broadcast television ads in all Senate campaigns over the last two weeks. Georgia tops the list with over 17,600 spots, closely followed by Pennsylvania with 17,400. In nine of the top 10 Senate races, the Democratic candidate has more ads on the air than the Republican, including ads from supportive outside groups.
Outside groups have sponsored more than half of the ads in the Pennsylvania Senate race over the last two weeks, and pro-GOP groups have sponsored about half or more of the pro-Republican ads in eight of the top ten Senate races by ad volume.
Table 6: Volume of TV Airings in U.S. Senate Races (October 3-16)
| State | Airings | Pro-Dem Airings | Pro-GOP Airings | Pro-Dem Advantage | % Group Airings | % Pro-Dem Group Airings | % Pro-GOP Group Airings |
|---|---|---|---|---|---|---|---|
| GA | 17,644 | 10,161 | 7,483 | 2,678 | 35.5% | 26.3% | 48.0% |
| PA | 17,414 | 10,568 | 6,846 | 3,722 | 54.9% | 58.3% | 49.7% |
| WI | 15,416 | 8,910 | 6,506 | 2,404 | 48.7% | 38.3% | 62.8% |
| NV | 12,882 | 7,362 | 5,520 | 1,842 | 37.1% | 27.0% | 50.5% |
| OH | 11,650 | 5,943 | 5,707 | 236 | 43.3% | 21.8% | 65.7% |
| NC | 10,685 | 5,615 | 5,070 | 545 | 42.4% | 28.2% | 58.2% |
| AZ | 9,486 | 7,467 | 2,019 | 5,448 | 34.8% | 25.0% | 71.0% |
| NH | 8,647 | 5,095 | 3,552 | 1,543 | 59.8% | 41.7% | 85.7% |
| FL | 7,692 | 2,566 | 5,126 | -2,560 | 7.6% | 0.0% | 11.5% |
| WA | 5,800 | 3,790 | 2,010 | 1,780 | 27.1% | 30.3% | 21.0% |
| CO | 5,798 | 4,166 | 1,632 | 2,534 | 50.8% | 50.6% | 51.3% |
| MO | 4,127 | 2,787 | 1,340 | 1,447 | 0.0% | 0.0% | 0.0% |
| UT | 4,031 | 0 | 1,790 | -1,790 | 26.8% | 0.0% | 60.3% |
| IA | 3,779 | 1,172 | 2,607 | -1,435 | 0.0% | 0.0% | 0.0% |
| AK | 3,389 | 356 | 3,033 | -2,677 | 79.6% | 100.0% | 77.2% |
| NY | 3,028 | 3,028 | 0 | 3,028 | 0.0% | 0.0% | 0.0% |
| ID | 3,025 | 0 | 3,025 | -3,025 | 0.0% | 0.0% | 0.0% |
| LA | 2,388 | 239 | 2,149 | -1,910 | 0.0% | 0.0% | 0.0% |
| OR | 1,793 | 1,793 | 0 | 1,793 | 0.0% | 0.0% | 0.0% |
| CT | 1,457 | 1,166 | 291 | 875 | 20.0% | 0.0% | 100.0% |
| IN | 1,051 | 0 | 1,051 | -1,051 | 0.0% | 0.0% | 0.0% |
| KS | 1,028 | 0 | 1,028 | -1,028 | 0.0% | 0.0% | 0.0% |
| ND | 1,011 | 0 | 1,011 | -1,011 | 0.0% | 0.0% | 0.0% |
| KY | 756 | 0 | 756 | -756 | 0.0% | 0.0% | 0.0% |
| OK | 707 | 87 | 620 | -533 | 0.0% | 0.0% | 0.0% |
| IL | 577 | 577 | 0 | 577 | 0.0% | 0.0% | 0.0% |
| SC | 509 | 0 | 509 | -509 | 0.0% | 0.0% | 0.0% |
| SD | 433 | 0 | 433 | -433 | 0.0% | 0.0% | 0.0% |
| HI | 322 | 322 | 0 | 322 | 0.0% | 0.0% | 0.0% |
| AR | 307 | 0 | 307 | -307 | 6.5% | 0.0% | 6.5% |
| VT | 283 | 223 | 60 | 163 | 0.0% | 0.0% | 0.0% |
| AK | 21 | 0 | 21 | -21 | 0.0% | 0.0% | 0.0% |
| Figures are from October 3-16, 2022. Numbers include broadcast television. Table does not show 2,241 airings promoting independent candidate Evan McMullin in Utah. CITE SOURCE OF DATA AS: Kantar/CMAG with analysis by the Wesleyan Media Project. |
|||||||
Pro-Democratic Ads More Positive in Senate Contests; Pro-Republican Pure Attacks Decreasing
Figure 3 shows both the volume of pro-Democratic and pro-Republican Senate ads by tone—promotional (positive), contrast or attack (negative)—and the percentage of total ads by party that fall into each category. One thing that stands out is that pro-Democratic ads have outnumbered pro-Republican ads in each of the past six weeks. Pro-Republican ads have also taken on a more negative tone than the pro-Democratic ads, a finding that is not uncommon for the party out of power. Interestingly, though, the percentage of pro-Republican ads that are pure negative or attack ads has declined over the past few weeks, with an increasing percentage of contrast ads.
Figure 3: Weekly Volume and Percentage of Senate Advertising by Tone
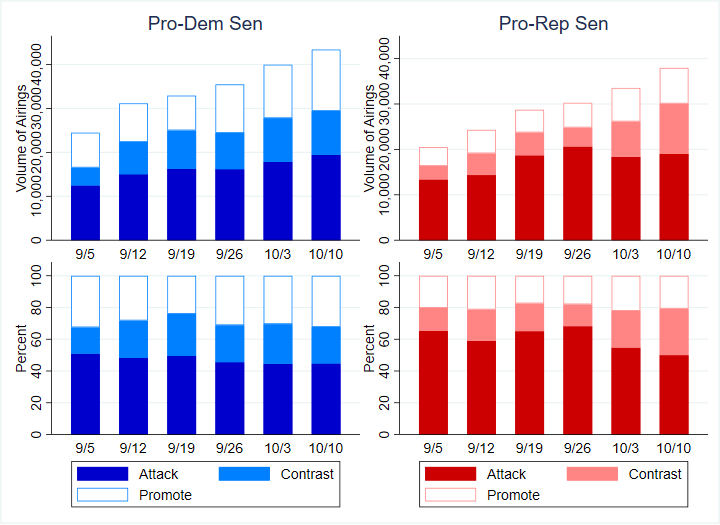
Figures are from September 5, 2022, to October 16, 2022.
Numbers include broadcast television for all sponsors.
CITE SOURCE OF DATA AS: Kantar/CMAG with analysis by the Wesleyan Media Project.
Alaska, Arizona Senate Races Most Negative
Table 7 lists Senate races by the percentage of ads that are negative (pure attack). These are ads that are focused solely on an opponent. By this metric, the Senate race in Alaska is the most negative, with 76 percent of ad airings since Labor Day falling into the negative (or attack) category. In Arizona, about 71 percent of ads in the past 6 weeks have been negative, including 72 percent of those favoring Democrat Katie Hobbs and 68 percent of those favoring Republican Kari Lake.
Table 7: U.S. Senate Races by Proportion Pure Attack
| State | Airings | % Attack | % Pro-Dem Attack | % Pro-GOP Attack |
|---|---|---|---|---|
| AK | 7,126 | 76.3% | 100.0% | 69.6% |
| AZ | 28,411 | 70.7% | 71.5% | 68.2% |
| NC | 27,382 | 66.1% | 52.0% | 84.3% |
| WI | 46,146 | 65.2% | 40.1% | 93.9% |
| CO | 12,330 | 62.8% | 69.9% | 44.6% |
| GA | 42,501 | 60.3% | 61.6% | 58.4% |
| NH | 28,387 | 58.7% | 58.1% | 59.5% |
| OH | 31,126 | 58.0% | 37.5% | 82.1% |
| PA | 39,068 | 57.5% | 44.4% | 74.2% |
| NV | 32,874 | 55.2% | 49.7% | 63.1% |
| UT | 8,927 | 46.6% | 59.2% | |
| IA | 8,075 | 46.4% | 31.0% | 55.4% |
| WA | 11,212 | 36.8% | 56.9% | 0.1% |
| FL | 22,431 | 31.6% | 4.6% | 50.4% |
| KY | 2,201 | 30.8% | 30.8% | |
| CT | 2,898 | 21.5% | 12.8% | 100.0% |
| AR | 1,253 | 0.0% | 0.0% | |
| HI | 322 | 0.0% | 0.0% | |
| ID | 6,242 | 0.0% | 0.0% | |
| IL | 751 | 0.0% | 0.0% | |
| IN | 1,836 | 0.0% | 0.0% | |
| KS | 1,028 | 0.0% | 0.0% | |
| LA | 6,020 | 0.0% | 0.0% | 0.0% |
| MO | 5,434 | 0.0% | 0.0% | 0.0% |
| ND | 1,979 | 0.0% | 0.0% | |
| NY | 4,073 | 0.0% | 0.0% | |
| OK | 707 | 0.0% | 0.0% | 0.0% |
| OR | 4,131 | 0.0% | 0.0% | |
| SC | 830 | 0.0% | 0.0% | |
| SD | 433 | 0.0% | 0.0% | |
| VT | 448 | 0.0% | 0.0% | 0.0% |
| Figures are from September 5, 2022, to October 16, 2022. Numbers include broadcast television for all sponsors. CITE SOURCE OF DATA AS: Kantar/CMAG with analysis by the Wesleyan Media Project. |
||||
Texas Gov Nearly Even in Ads; Abrams and Crist Trail Kemp and DeSantis
The campaign for Texas Governor is the top statewide race by ad volume in the country over the last two weeks, with over 24,500 spots between October 2 and 16. And the balance of ads is nearly even between Democratic challenger Beto O’Rourke and the Republican incumbent, Greg Abbott. This contrasts with the races in Georgia and in Florida where Republicans have larger advantages on air in states that have seen more than 13,500 airings in the past two weeks alone. Incumbent Governor Brian Kemp in Georgia has a more than 1,300 ad lead over Democratic challenger Stacey Abrams, and in Florida, Governor Ron DeSantis has an even more commanding lead of 7,366 airings over Charlie Crist.
In Wisconsin and Oregon, which rank fourth and fifth for total airings with 12,515 and 10,189 airings respectively, Democrats hold large advantages on air.
Table 8: Volume of TV Airings in Governor Races (October 3-16)
| State | Airings | Pro-Dem Airings | Pro-GOP Airings | Pro-Dem Advantage | % Group Airings | % Pro-Dem Group Airings | % Pro-GOP Group Airings |
|---|---|---|---|---|---|---|---|
| TX | 24,504 | 12,148 | 12,356 | -208 | 9.5% | 19.3% | 0.0% |
| GA | 13,570 | 6,112 | 7,458 | -1,346 | 0.0% | 0.0% | 0.0% |
| FL | 13,530 | 3,082 | 10,448 | -7,366 | 0.0% | 0.0% | 0.0% |
| WI | 12,515 | 8,094 | 4,421 | 3,673 | 49.8% | 46.8% | 55.5% |
| OR | 10,189 | 6,238 | 3,336 | 2,902 | 0.0% | 0.0% | 0.0% |
| NM | 6,992 | 3,690 | 3,302 | 388 | 36.1% | 68.4% | 0.0% |
| NY | 6,824 | 3,826 | 2,998 | 828 | 22.9% | 1.3% | 50.6% |
| KS | 6,669 | 4,098 | 2,571 | 1,527 | 42.0% | 68.3% | 0.0% |
| NV | 6,613 | 3,203 | 3,410 | -207 | 32.3% | 34.7% | 30.0% |
| MI | 6,498 | 5,862 | 636 | 5,226 | 66.3% | 62.6% | 100.0% |
| IL | 6,189 | 4,001 | 2,188 | 1,813 | 31.7% | 0.0% | 89.6% |
| OH | 5,547 | 1,778 | 3,769 | -1,991 | 0.0% | 0.0% | 0.0% |
| CO | 4,792 | 4,620 | 88 | 4,532 | 15.2% | 13.8% | 100.0% |
| AZ | 4,767 | 2,933 | 1,834 | 1,099 | 12.5% | 20.3% | 0.0% |
| PA | 4,716 | 4,284 | 432 | 3,852 | 13.1% | 14.4% | 0.0% |
| ME | 4,167 | 2,375 | 1,792 | 583 | 32.8% | 48.1% | 12.6% |
| OK | 3,776 | 2,477 | 1,299 | 1,178 | 57.3% | 87.3% | 0.0% |
| SC | 3,485 | 1,144 | 2,341 | -1,197 | 0.0% | 0.0% | 0.0% |
| TN | 3,100 | 15 | 3,085 | -3,070 | 0.5% | 100.0% | 0.0% |
| CT | 3,094 | 1,948 | 1,146 | 802 | 10.2% | 0.0% | 27.6% |
| MN | 3,008 | 2,763 | 245 | 2,518 | 41.1% | 44.7% | 0.0% |
| AR | 1,828 | 310 | 1,518 | -1,208 | 0.0% | 0.0% | 0.0% |
| IA | 1,621 | 245 | 1,376 | -1,131 | 0.0% | 0.0% | 0.0% |
| RI | 1,559 | 710 | 849 | -139 | 0.0% | 0.0% | 0.0% |
| SD | 1,508 | 451 | 1,057 | -606 | 0.0% | 0.0% | 0.0% |
| MA | 1,347 | 1,347 | 0 | 1,347 | 0.0% | 0.0% | 0.0% |
| CA | 904 | 904 | 0 | 904 | 0.0% | 0.0% | 0.0% |
| NE | 522 | 0 | 522 | -522 | 0.0% | 0.0% | 0.0% |
| NH | 407 | 317 | 90 | 227 | 0.0% | 0.0% | 0.0% |
| AK | 400 | 89 | 126 | -37 | 0.0% | 0.0% | 0.0% |
| MD | 330 | 330 | 0 | 330 | 0.0% | 0.0% | 0.0% |
| HI | 225 | 131 | 94 | 37 | 0.0% | 0.0% | 0.0% |
| Figures are from October 3-16, 2022. Numbers include broadcast television. Table does not show 615 airings from independent candidate Betsy Johnson in Oregon. CITE SOURCE OF DATA AS: Kantar/CMAG with analysis by the Wesleyan Media Project. |
|||||||
When it comes to the tone of gubernatorial ads, Figure 4 shows a higher volume of pro-Democratic ads than pro-Republican ads in each week of the campaign. Interestingly, the percentage of attack ads on the Republican side has declined since the week of September 12 as the percentage of contrast ads has risen.
Figure 4: Weekly Volume and Percentage of Gubernatorial Advertising by Tone
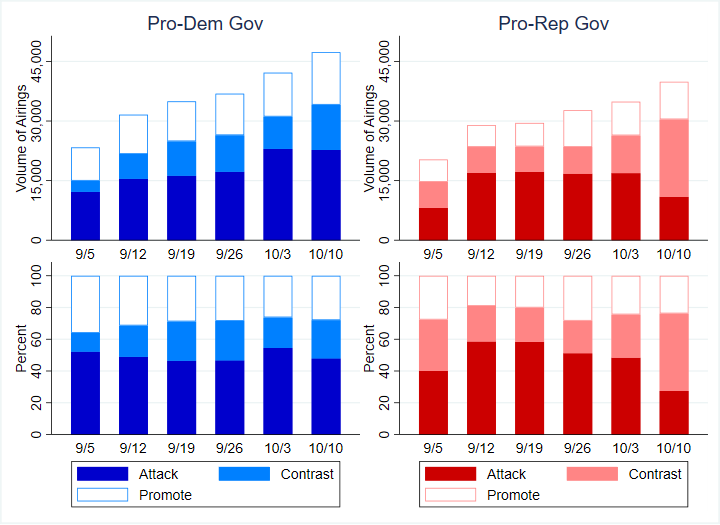
Figures are from September 5, 2022, to October 16, 2022.
Numbers include broadcast television for all sponsors.
CITE SOURCE OF DATA AS: Kantar/CMAG with analysis by the Wesleyan Media Project.
Wisconsin, Nevada Have Most Negative Races for Governor
Table 9 shows the tone of advertising in races for governor since September 5, ranked from the greatest percentage of pure attack ads to the least (pure attack ads are those that solely focus on an opponent except for the paid for by line). By this metric, the race for governor in Wisconsin is the most negative gubernatorial race. Fully three in four ads are negative in the race for governor in the Badger State, with 84 percent of ads promoting Governor Tony Evers classified that way and 61 percent of the ads supporting Republican Tim Michels labeled negative. In Nevada, 66 percent of ads since September 5 have been pure attack.
Table 9: Governor Races by Proportion Pure Attack
| State | Airings | % Attack | % Pro-Dem Attack | % Pro-GOP Attack |
|---|---|---|---|---|
| WI | 32,925 | 74.9% | 83.8% | 60.8% |
| NV | 16,128 | 66.0% | 44.2% | 80.3% |
| MI | 16,681 | 65.3% | 69.0% | 0.0% |
| IL | 14,951 | 61.4% | 59.6% | 65.0% |
| PA | 10,365 | 60.5% | 63.2% | 0.0% |
| NM | 15,480 | 57.7% | 68.8% | 44.8% |
| AZ | 9,748 | 56.4% | 48.4% | 73.9% |
| NY | 16,412 | 55.8% | 82.5% | 12.0% |
| GA | 36,234 | 53.9% | 37.1% | 72.0% |
| TX | 60,364 | 53.8% | 57.4% | 50.1% |
| KS | 16,723 | 53.2% | 49.5% | 57.9% |
| ME | 10,555 | 46.7% | 47.1% | 46.2% |
| MN | 8,138 | 43.5% | 48.9% | 0.0% |
| OH | 13,362 | 39.4% | 31.7% | 43.0% |
| OR | 29,708 | 38.7% | 39.2% | 30.6% |
| FL | 43,619 | 35.9% | 0.0% | 41.5% |
| NH | 845 | 34.7% | 49.7% | 0.0% |
| RI | 5,505 | 32.5% | 11.1% | 58.3% |
| CT | 7,758 | 30.3% | 5.9% | 65.1% |
| SD | 3,367 | 30.3% | 0.0% | 43.0% |
| SC | 6,233 | 22.7% | 5.1% | 29.5% |
| OK | 7,489 | 18.4% | 19.6% | 15.7% |
| CO | 11,617 | 17.6% | 18.0% | 2.5% |
| AK | 795 | 0.0% | 0.0% | 0.0% |
| AR | 3,871 | 0.0% | 0.0% | 0.0% |
| CA | 904 | 0.0% | 0.0% | |
| HI | 239 | 0.0% | 0.0% | 0.0% |
| IA | 2,813 | 0.0% | 0.0% | 0.0% |
| MA | 2,838 | 0.0% | 0.0% | 0.0% |
| MD | 450 | 0.0% | 0.0% | |
| NE | 522 | 0.0% | 0.0% | |
| TN | 4,388 | 0.0% | 0.0% | 0.0% |
| Figures are from September 5, 2022, to October 16, 2022. Numbers include broadcast television for all sponsors. CITE SOURCE OF DATA AS: Kantar/CMAG with analysis by the Wesleyan Media Project. |
||||
CA-22 Continues to Draw Heavy Advertising; Six Other Contests Have At Least 5,000 Spots in Last Two Weeks
Table 10 shows that several competitive House races have seen more than 5,000 ad airings over the past two weeks fueled in part by heavy interest group spending. Among the ten races with the most ad airings, Democratic candidates benefitted from more ads in seven of them. But in California’s 22nd district—which has seen the most ads by far over the past two weeks—pro-Republican ads were substantially higher in number than pro-Democratic ads.
Table 10: Volume of TV Airings in U.S. House Races (October 3-16)
| State | District | Airings | Pro-Dem Airings | Pro-GOP Airings | Pro-Dem Advantage | % Group Airings | % Pro-Dem Group Airings | % Pro-GOP Group Airings |
|---|---|---|---|---|---|---|---|---|
| CA | 22 | 11,691 | 4,507 | 7,184 | -2,677 | 43.3% | 71.2% | 25.9% |
| ME | 2 | 6,259 | 3,521 | 2,738 | 783 | 19.9% | 15.2% | 25.9% |
| NM | 2 | 5,587 | 2,734 | 2,853 | -119 | 25.6% | 8.7% | 41.9% |
| CA | 13 | 5,500 | 3,411 | 2,089 | 1,322 | 26.7% | 3.5% | 64.5% |
| TX | 28 | 5,218 | 3,321 | 1,897 | 1,424 | 27.4% | 0.0% | 75.4% |
| WA | 8 | 5,073 | 3,479 | 1,594 | 1,885 | 23.4% | 1.4% | 71.6% |
| IL | 17 | 5,050 | 2,729 | 2,321 | 408 | 25.6% | 3.3% | 51.8% |
| VA | 7 | 4,864 | 2,676 | 2,188 | 488 | 16.5% | 1.6% | 34.7% |
| MT | 1 | 4,795 | 1,896 | 2,899 | -1,003 | 6.9% | 0.0% | 11.5% |
| NY | 22 | 4,494 | 3,117 | 1,377 | 1,740 | 35.4% | 16.8% | 77.6% |
| NY | 19 | 4,387 | 3,038 | 1,349 | 1,689 | 18.6% | 0.0% | 60.4% |
| OR | 5 | 4,168 | 2,067 | 2,101 | -34 | 33.1% | 0.0% | 65.7% |
| VA | 2 | 4,162 | 3,056 | 1,106 | 1,950 | 17.3% | 1.6% | 60.8% |
| CA | 49 | 4,061 | 2,293 | 1,768 | 525 | 55.8% | 50.1% | 63.2% |
| MI | 7 | 4,023 | 3,162 | 861 | 2,301 | 14.6% | 0.0% | 68.3% |
| CO | 3 | 3,911 | 0 | 3,911 | -3,911 | 0.0% | 0.0% | 0.0% |
| NE | 2 | 3,855 | 1,663 | 2,192 | -529 | 42.3% | 44.0% | 41.1% |
| IA | 3 | 3,499 | 2,419 | 1,080 | 1,339 | 9.5% | 0.0% | 30.9% |
| GA | 2 | 3,481 | 2,449 | 1,032 | 1,417 | 0.0% | 0.0% | 0.0% |
| KS | 3 | 3,278 | 2,195 | 1,083 | 1,112 | 15.7% | 0.0% | 47.6% |
| IA | 2 | 3,103 | 1,292 | 1,811 | -519 | 11.8% | 0.0% | 20.3% |
| TX | 34 | 2,982 | 1,405 | 1,577 | -172 | 56.1% | 45.0% | 66.0% |
| OH | 1 | 2,961 | 1,782 | 1,179 | 603 | 15.5% | 2.2% | 35.5% |
| MN | 2 | 2,893 | 1,702 | 1,191 | 511 | 30.4% | 0.0% | 73.9% |
| MI | 8 | 2,836 | 1,548 | 1,288 | 260 | 4.1% | 0.0% | 9.1% |
| NH | 1 | 2,808 | 1,468 | 1,340 | 128 | 54.4% | 46.0% | 63.5% |
| NV | 3 | 2,755 | 1,255 | 1,500 | -245 | 63.1% | 57.9% | 67.4% |
| PA | 7 | 2,753 | 1,640 | 1,113 | 527 | 29.1% | 3.7% | 66.5% |
| CO | 8 | 2,709 | 1,135 | 1,574 | -439 | 43.9% | 18.7% | 62.1% |
| IA | 1 | 2,603 | 863 | 1,740 | -877 | 27.0% | 0.0% | 40.5% |
| NV | 1 | 2,513 | 1,616 | 897 | 719 | 63.6% | 52.7% | 83.4% |
| PA | 8 | 2,495 | 1,080 | 1,415 | -335 | 13.1% | 0.0% | 23.1% |
| OR | 4 | 2,469 | 1,005 | 1,464 | -459 | 23.3% | 0.0% | 39.3% |
| MI | 3 | 2,402 | 1,183 | 1,219 | -36 | 37.3% | 13.9% | 60.0% |
| RI | 2 | 2,278 | 1,338 | 940 | 398 | 53.2% | 37.2% | 76.0% |
| CT | 5 | 2,202 | 1,245 | 957 | 288 | 68.3% | 63.2% | 75.0% |
| OR | 6 | 2,099 | 1,382 | 717 | 665 | 13.7% | 4.3% | 31.8% |
| AZ | 6 | 2,087 | 728 | 1,359 | -631 | 28.5% | 0.0% | 43.7% |
| NC | 13 | 2,045 | 1,005 | 1,040 | -35 | 44.1% | 24.9% | 62.7% |
| FL | 2 | 2,017 | 1,065 | 952 | 113 | 0.0% | 0.0% | 0.0% |
| IL | 13 | 1,969 | 1,606 | 363 | 1,243 | 40.0% | 49.0% | 0.0% |
| PA | 17 | 1,880 | 987 | 893 | 94 | 20.3% | 7.1% | 34.8% |
| NV | 4 | 1,853 | 1,853 | 0 | 1,853 | 37.8% | 37.8% | 0.0% |
| WI | 3 | 1,820 | 536 | 1,284 | -748 | 24.3% | 0.0% | 34.5% |
| OH | 13 | 1,732 | 1,011 | 721 | 290 | 31.5% | 0.0% | 75.7% |
| IN | 1 | 1,617 | 892 | 725 | 167 | 74.1% | 76.6% | 71.2% |
| CA | 9 | 1,571 | 1,571 | 0 | 1,571 | 0.0% | 0.0% | 0.0% |
| TX | 15 | 1,416 | 725 | 691 | 34 | 0.0% | 0.0% | 0.0% |
| NC | 1 | 1,409 | 1,409 | 0 | 1,409 | 11.5% | 11.5% | 0.0% |
| WA | 5 | 1,313 | 0 | 1,313 | -1,313 | 0.0% | 0.0% | 0.0% |
| CA | 41 | 1,312 | 816 | 496 | 320 | 0.0% | 0.0% | 0.0% |
| OH | 9 | 1,207 | 1,154 | 53 | 1,101 | 27.8% | 29.0% | 0.0% |
| FL | 27 | 1,192 | 272 | 920 | -648 | 12.4% | 0.0% | 16.1% |
| NE | 1 | 1,188 | 923 | 265 | 658 | 0.0% | 0.0% | 0.0% |
| FL | 13 | 1,173 | 935 | 238 | 697 | 65.3% | 81.9% | 0.0% |
| NJ | 3 | 1,155 | 884 | 271 | 613 | 0.0% | 0.0% | 0.0% |
| NY | 21 | 1,113 | 525 | 588 | -63 | 0.0% | 0.0% | 0.0% |
| CA | 47 | 1,080 | 924 | 156 | 768 | 14.4% | 0.0% | 100.0% |
| NM | 3 | 1,042 | 752 | 290 | 462 | 0.0% | 0.0% | 0.0% |
| AZ | 4 | 1,001 | 965 | 36 | 929 | 6.9% | 7.2% | 0.0% |
| Figures are from October 3-16, 2022. Numbers include broadcast television. CITE SOURCE OF DATA AS: Kantar/CMAG with analysis by the Wesleyan Media Project. |
||||||||
Figure 5 shows the weekly volume of and percentage of ads in House races by tone. As in races for the Senate and governor, ads favoring Democrats have been larger in volume than ads favoring Republicans. At the same time, pro-Republican ads have consistently been slightly more negative than pro-Democratic ads.
Figure 5: Weekly Volume and Percentage of U.S. House Advertising by Tone
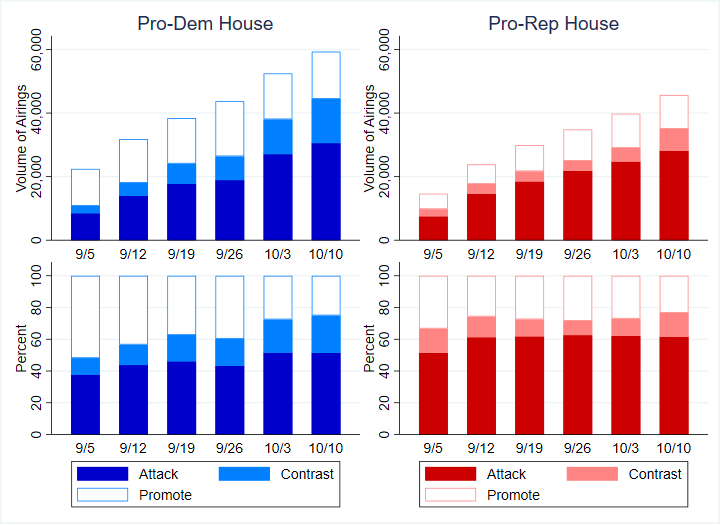
Figures are from September 5, 2022, to October 16, 2022.
Numbers include broadcast television for all sponsors.
CITE SOURCE OF DATA AS: Kantar/CMAG with analysis by the Wesleyan Media Project.
TV Ad Volumes High in House and Senate; Gov Volumes Set Records
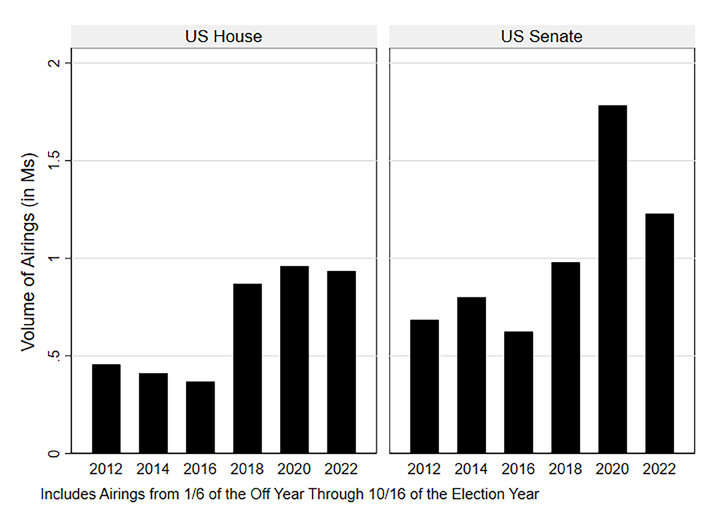
Over 3.6M television ads have aired in federal and gubernatorial races so far in the 2021-2022 midterm election cycle, which is an increase of 13.5 percent over the prior 2017-2018 midterm cycle record. Nearly 2.2M of those airings have aired in federal races (see Figure 6) with U.S. Senate contests seeing over 1.2M ad airings so far (an increase of 25 percent over 2018 but a decrease of 31 percent compared to 2020). Ad airings in U.S. House races are nearing one-million mark with 935,245 airings to date (an increase of nearly 8 percent over 2018 but a decrease of 2.5 percent compared to 2020).
Figure 6: Volume of Ads in Federal Races by Year
Numbers include broadcast television for all sponsors.
CITE SOURCE OF DATA AS: Kantar/CMAG with analysis by the Wesleyan Media Project.
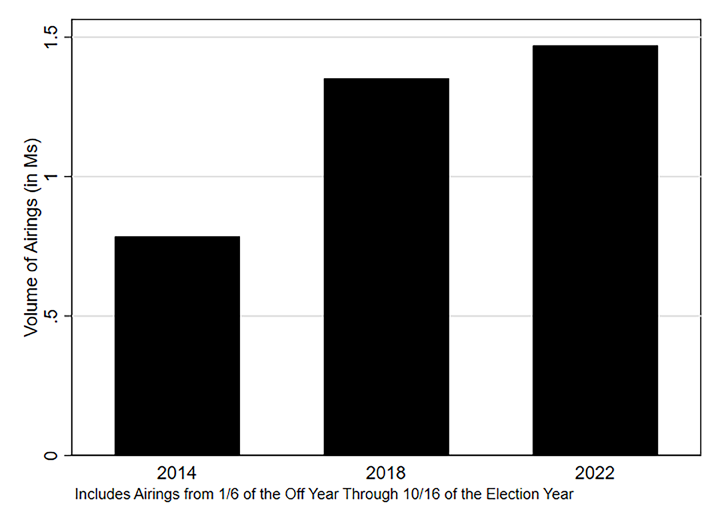
Races for governor have seen nearly 1.5M television ads so far, an increase of nearly 9 percent over the prior 2018 record during the same period.
Figure 7: Volume of Ads in Gubernatorial Races by Year
Numbers include broadcast television for all sponsors.
CITE SOURCE OF DATA AS: Kantar/CMAG with analysis by the Wesleyan Media Project.
Budget and Abortion Top Democratic Gubernatorial Talking Points while Republicans Highlight Public Safety
In the last two weeks, more than a third (37 percent) of ads by or on behalf of Democratic gubernatorial candidates have talked about the budget (Table 11). This issue is followed closely by abortion (36 percent) and health care (32 percent). More than four in ten pro-Republican airings meanwhile have focused on public safety, with a lot of advertising highlighting crime in particular. Taxes and the budget rank second and third overall, followed closely by education.
Table 11: Top Issues in Gubernatorial Races by Party Lean (October 3-16)
| Issue | Pro-Dem Percent | Issue | Pro-GOP Percent |
|---|---|---|---|
| Budget | 36.8% | Public Safety | 41.8% |
| Abortion | 35.8% | Taxes | 38.3% |
| Health care | 32.1% | Budget | 35.1% |
| Taxes | 26.3% | Education | 33.6% |
| Womens' Rights | 25.0% | Jobs | 28.6% |
| Education | 24.5% | Coronavirus | 26.2% |
| Public Safety | 18.2% | Economy | 24.5% |
| Jobs | 12.9% | Immigration | 19.7% |
| Gun Control | 12.7% | Inflation | 18.3% |
| Campaign Finance | 11.2% | Oil | 15.1% |
| Figures are from October 3-16, 2022. Numbers include broadcast television for all sponsors. CITE SOURCE OF DATA AS: Kantar/CMAG with analysis by the Wesleyan Media Project. |
|||
Abortion Still Top Issue for Democrats while Republicans Talk Economy in Federal Races
Ads supporting Democratic senatorial candidates continue to hammer on abortion, with nearly half of all airings mentioning the issue in the past two weeks. Pro-Republican airings meanwhile focus on economics with the budget, taxes, the economy and inflation all appearing in more than one-third of airings. Also noteworthy is the fact that Medicare mentions are making their first appearance on the top ten issue list for pro-Democratic spots.
Table 12: Top Issues in U.S. Senate Races by Party Lean (October 3-16)
| Issue | Pro-Dem Percent | Issue | Pro-GOP Percent |
|---|---|---|---|
| Abortion | 45.7% | Budget | 47.3% |
| Health care | 35.2% | Taxes | 42.9% |
| Public Safety | 24.1% | Economy | 37.9% |
| Prescription Drugs | 19.6% | Inflation | 33.6% |
| Budget | 19.1% | Public Safety | 28.6% |
| Supreme Court | 16.3% | Oil | 25.6% |
| Taxes | 12.7% | Immigration | 9.6% |
| Medicare | 11.5% | Corruption | 8.5% |
| Women's Rights | 11.0% | Jobs | 7.3% |
| Jobs | 10.6% | Health care | 5.7% |
| Figures are from October 3-16, 2022. Numbers include broadcast television for all sponsors. CITE SOURCE OF DATA AS: Kantar/CMAG with analysis by the Wesleyan Media Project. |
|||
Turning to the U.S. House, abortion also remains a top talking point in ads by or on behalf of Democrats. The issue is mentioned in nearly one-third of all airings with health care (26 percent) and prescription drugs (16.6 percent) ranking two and three. On the Republican side, more than half of all pro-Republican airings discuss the budget (53.5 percent). Taxes (42 percent) and public safety (42 percent) round out the top three.
Table 13: Top Issues in U.S. House Races by Party Lean (October 3-16)
| Issue | Pro-Dem Percent | Issue | Pro-GOP Percent |
|---|---|---|---|
| Abortion | 31.9% | Budget | 53.5% |
| Healthcare | 25.9% | Taxes | 42.0% |
| Prescription Drugs | 16.6% | Public Safety | 35.3% |
| Public Safety | 15.6% | Economy | 26.3% |
| Jobs | 15.1% | Inflation | 26.1% |
| Medicare | 14.5% | Immigration | 18.4% |
| Budget | 12.9% | Education | 12.7% |
| Taxes | 12.7% | Drugs | 12.2% |
| Manufacturing | 12.1% | Coronavirus | 11.6% |
| Supreme Court | 11.9% | Healthcare | 9.0% |
| Figures are from October 3-16, 2022. Numbers include broadcast television for all sponsors. CITE SOURCE OF DATA AS: Kantar/CMAG with analysis by the Wesleyan Media Project. |
|||
Republicans Attack Biden and Don’t Mention Trump
Additionally, mentions of former President Trump have been low in the last two weeks. For Democrats, Trump was mentioned negatively in only 1.2 percent of their ads (across all pro-Democratic sponsors) in gubernatorial races, in 3 percent of pro-Democratic House ads, and in 5 percent of pro-Democratic Senate ads. There were no positive mentions of Trump by Republicans in the last two weeks.
As for mentions of President Biden, Republican sponsors continued to use him as a foil. While only 4 percent of pro-Republican ads in gubernatorial races had a negative Biden reference, 26 percent of pro-GOP House ads did, along with 37 percent of Republican-sponsored Senate ads. Pro-Biden messages on the Democratic side were very infrequent.
About the Data
Television ad totals reported here are from Kantar/CMAG (unless otherwise specified) and refer to broadcast television. All cost estimates for television are precisely that: estimates.
Facebook spending data come from the aggregate reports, which provide spending information for each page name and disclaimer combination. Totals in this report reflect spending between January 6, 2021, October 2, 2022, and October 15, 2022. These totals are calculated by subtracting the reported cumulative spending (as reported by Facebook as the total spent since May 2018) for the October 15, 2022 report and subtracting the cumulative spending reported for January 5, 2021, October 1, 2022.
In Table A (click here to download), we list the page names/disclaimer rows from the Facebook aggregate reports that we identified for this report. It is possible that we missed some spending from a Facebook page affiliated with a candidate or group. This is exacerbated by the absence of EIN or FEC identifiers in the Facebook reports.
For Google ads, we downloaded the weekly reports from the platform’s Transparency Report. The totals reflected in this release are current as of 10/17/22, the day on which we pulled the transparency report. Google only includes spending in federal and state races and only includes weekly totals but lists the sponsor’s EIN or FEC committee ID. Google spending is from the following time periods: January 10, 2021 or October 2, 2022 and October 15, 2022.
In Table B (click here to download), we list the advertiser name for all entities used in this report to calculate Google spending totals.
For Table 5 figures in this report, we utilize content information from Facebook ads and machine learning to assess the predicted goal of the ad and to calculate whether the ad was primarily seen by users inside or outside each candidate’s state.
To determine the ad goal, human coders at WMP classify ads into several types of goals, including persuasion, fund-raising, contact, purchase, get out the vote, event, polling, gathering information, and learning more. In this report we focus only on the ad goals of persuasion and fund-raising. Random forest classifiers (one model per goal) were trained and validated on an 80/20 split sample of 3,671 human-coded ads. The F1-score performance for each classifier was 85 percent for persuasion and 99 percent for fund-raising. The models are binary predictions and therefore it is possible that an ad ID could be identified as both persuasion and fund-raising. We apply these classification models to the Facebook data retrieved through Facebook’s API. This includes the following text fields: ad creative body, page name, disclaimer, ad creative link caption, ad creative link title, and ad creative link description. Additionally, we transcribe the audio of the videos through automatic speech recognition and then concatenate the API text fields and the transcribed audio together for classification at the unique ad ID level.
For in-state ads, we identified the state of each senator and used Facebook’s “delivery by region” variable to identify what proportion of an ad’s impressions went to the senator’s state.
Unique ad IDs are best thought of as unique purchases by the advertiser rather than unique creatives because of the way Facebook assigns ad IDs, and each ad ID has an estimated upper and lower bound on spending. We filter out advertising from each page that occurred before September 5, 2022 but keep unique IDs that ran between October 2 and October 15, 2022, even if the ad started before October 2.
We calculated estimated spend by taking the average of the upper and lower spending bounds for each ad ID. In order to calculate the percentage of a candidate’s ads associated with each goal, we created new ad-level variables (goal_persuade_spending, goal_donate_spending). These new variables were assigned the estimated ad spend if the binary predication variable for that goal equaled one (an ad ID can be assigned both goals). For the in-state calculations, Facebook provides the proportion of the ad ID’s impressions by state, so we applied this proportion for the candidate’s state to the estimated ad spend for each ad ID, giving us a variable with the estimated in-state spending per ad ID (instate_spending).
We then sum over all of the ad IDs for each candidate to arrive at an estimated amount of spending devoted to each goal and to in-state impressions. We then calculate the percentage of each candidate’s advertising for each of those variables. Because the ad-level spending is reported in buckets by Facebook (upper bound and lower bound), rather than in actual spending, in Table 5 we report only the actual spending reported in the Facebook ad library report even though we used the bucketed spending to produce the percentages.
About this Report
The Wesleyan Media Project provides real-time tracking and analysis of all political television advertising in an effort to increase transparency in elections. Housed in Wesleyan’s Quantitative Analysis Center – part of the Allbritton Center for the Study of Public Life – the Wesleyan Media Project is the successor to the Wisconsin Advertising Project, which disbanded in 2009. It is directed by Erika Franklin Fowler, professor of government at Wesleyan University, Michael M. Franz, professor of government at Bowdoin College and Travis N. Ridout, professor of political science at Washington State University. WMP personnel include Laura Baum (Associate Director), Breeze Floyd (Research Coordinator), Pavel Oleinikov (Associate Director, QAC), Markus Neumann (Post-Doctoral Fellow), and Jielu Yao (Post-Doctoral Fellow).
Data are provided by Kantar/CMAG with analysis by the Wesleyan Media Project. The Wesleyan Media Project is partnering again this year with OpenSecrets, to provide added information on outside group disclosure and candidate status.
The Wesleyan Media Project’s digital advertising tracking is supported by the contributions of students in Delta Lab, an interdisciplinary research collaborative focusing on computationally-driven and innovative analyses and visualizations of media messaging.
Periodic releases of data will be posted on the project’s website and dispersed via Twitter @wesmediaproject. To be added to our email update list, click here.
For more information contact: media@wesleyan.edu.
About Wesleyan University
Wesleyan University, in Middletown, Conn., is known for the excellence of its academic and co-curricular programs. With more than 2,900 undergraduates and 200 graduate students, Wesleyan is dedicated to providing a liberal arts education characterized by boldness, rigor and practical idealism. For more, visit www.wesleyan.edu.