- Demographic Reports
Research Summary. Although the American labor force is more diverse than ever before, some issues surrounding workplace diversity continue to persist. The country’s commitment to diversity and inclusion, however, is quickly being reflected in businesses across the fifty states.
To find out more about the current state of diversity in the American workforce, and the benefits of diversity overall, this article will take a deep dive into just that. After extensive research, our data analysis team concluded:
-
The majority of the American workforce is made up of white people (77%), followed by people of Hispanic or Latino ethnicity (18%), and Black people (13%).
-
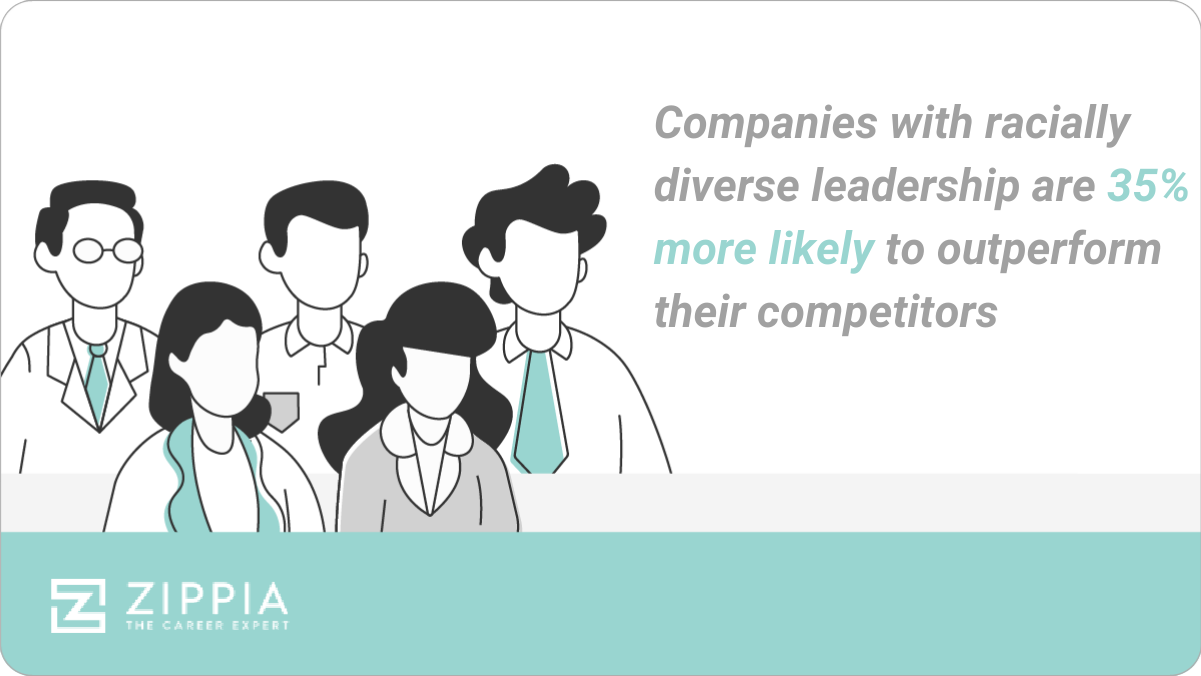
Companies with racially and ethnically diverse leadership and executive teams have a 35% higher likelihood of financially outperforming companies with little or no diversity.
-
Companies with greater gender diversity perform 15 to 21% better than companies with little or no gender diversity among staff members.
-
A diverse workforce is a priority for 67% of job seekers when deciding where to work
-
50% of American employees want their company to invest more energy towards promoting diversity and inclusion in the workplace.
-
Diverse companies enjoy 2.3 times more cash flow per employee as compared to less inclusive, more monolithic work environments.
-
At least three-fourths of all workers prefer to work in diverse companies.
-
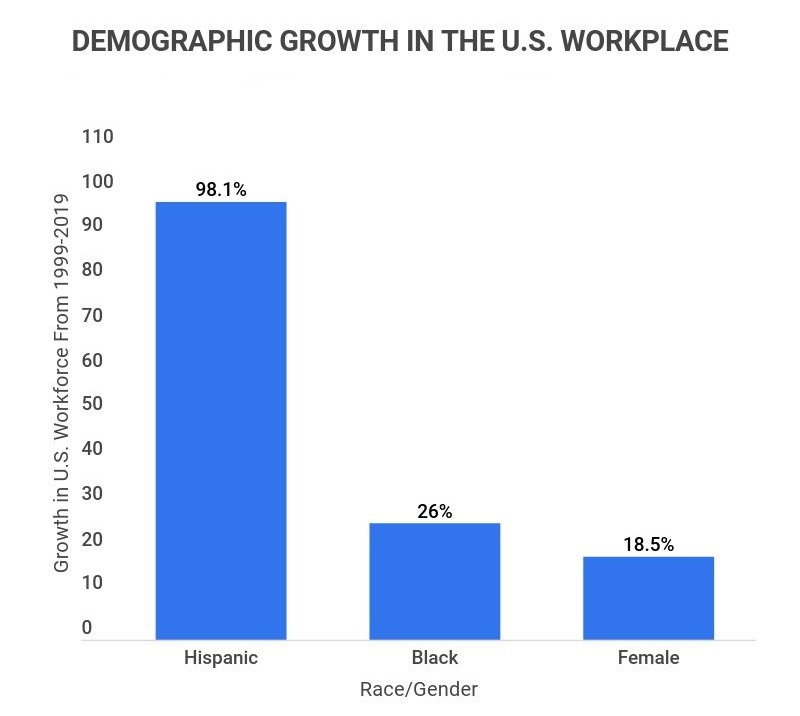
The number of women in the U.S. workforce grew by 18.5%, and the number of people of color in the U.S. workforce grew by 26% between 1999 and 2019.
For further analysis, we broke down the data in the following ways:
Race/Ethnicity | Gender | LGBTQ+ | Trends | Benefits | Worker Opinions | Age | Unemployment
General Workplace Diversity Statistics
-
When broken down by race and ethnicity, white Americans make up the majority of the workforce.
Federal studies have determined that the nation’s labor force is 77% White, 13% Black, 6% Asian, 2% Biracial, and 1% American Indian or Alaska Native. Additionally, people of Hispanic or Latino ethnicity, who may be of any race, represented 18% of the workforce.
-
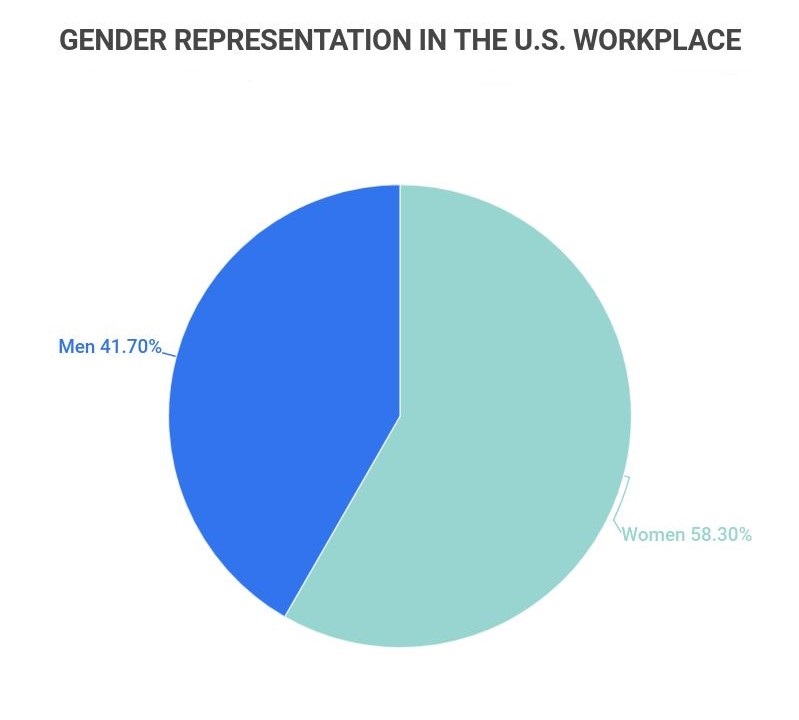
Women make up more than half of the United States’ labor force.
According to the U.S. Census, women represent 58.3% of the U.S. workforce, while men represent 41.7%.
-
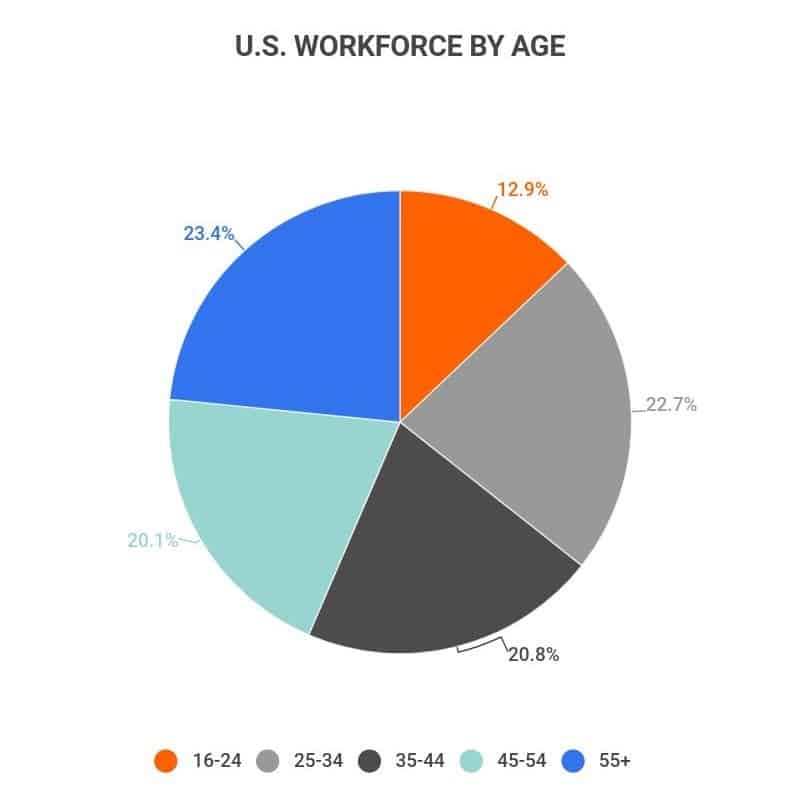
People aged 55 and older represent the largest portion of the United States’ workforce by age.
U.S. Bureau of Labor Statistics data shows that the U.S. labor force consists of 12.9% of employees aged 16 to 24, 22.7% of employees aged 25 to 34, 20.8% of employees aged 35 to 44, 20.1% of employees aged 45 to 54, and 23.4% of employees aged 55 and older.
Racial and Ethnic Diversity in the Workplace
-
Native Hawaiians and Pacific Islanders have the highest rates of workforce participation.
An average of 66.7% of Native Hawaiians and Other Pacific Islanders participate in the United States’ labor force, whether they currently have jobs or not. Here are the labor force participation rates for each race and ethnicity group:
Workforce Participation by Race and Ethnicity Group in 2020
Race and Ethnicity Group Average Labor Force Participation Native Hawaiian and Other Pacific Islander 66.7% Hispanic or Latino 65.6% Two or More Races 64.4% Asian 62.7% White 61.88% Black or African American 60.5% Native American and Alaska Native 59.3% Total 61.7% -
More than half of working Asians in the United States have executive positions.
Federal workforce studies have found that 54% of employed Asian Americans work in management, professional, and other related executive occupations compared to 41% of employed white Americans, 31% of employed Black Americans, and 22% of employed Hispanic Americans.
Management, professional, and other related executive occupations rank as the highest paying occupational category in the United States.
-
White candidates are 2.1% more likely to receive an interview callback than Black candidates.
When researchers send out 83,000 applications to Fortune 500 companies, they found that distinctively black-sounding names got noticeably fewer calls than candidates with white-sounding names (and the same application info).
That same study also found that roughly 20% of the companies involved in the study were responsible for about 50% of the discrimination.
-
On average, white and Asian employees earn more than Hispanics and Blacks.
A recent study found the median weekly salary sat at $680 for Hispanics, $694 for Blacks, $916 for Whites, and $1,095 for Asians.
-
95.8% of Fortune 500 CEOs identify as White, Non-Hispanic individuals.
About 1.2% of Fortune 500 CEOs are Hispanic, 0.8% are Black, and 1.8% are Asian.
-
About 28.8% of firms in America are owned by minorities.
According to the U.S. Census, 7,952,386 firms are owned by minorities, compared to 18,987,918 firms owned by non-minorities.
-
Studies show that minorities employed in the United States face a promotion gap.
According to data released by Mercer, a human resources consulting company, 64% of corporate workers in entry-level positions are white. Meanwhile, white individuals represent 85% of corporate executive positions.
-
Discrimination at work has caused nearly 50% of people of color to quit their jobs.
According to survey research, almost half of all Black and Hispanic employees in the United States have quite a job after witnessing or experiencing workplace discrimination.
-
Black men and women earn $1,500 and $2,200, respectively, less per year than white men with the same job and qualifications.
According to research by Payscale, Black women make $0.97, and Black men make $0.98 for every dollar made by a white man with the same job and qualifications. Over a year, a white male employee makes a median salary of $74,500, while a Black male makes $73,000, and a Black female makes $72,300.

Gender Diversity in the Workplace
-
Women make up more than half of the United States’ labor force.
According to the U.S. Census, women represent 58.3% of the U.S. workforce, while men represent 41.7%.
-
Working Asian women are more likely to work in management, professional, and other related executive positions than women of other races and ethnicities.
Approximately 53% of Asian women work in management or professional occupations, compared to 45% of employed white women, 36% of employed Black women, and 27% of employed Hispanic women.
-
Careers in education and health services are popular among women across all races and ethnic groups.
Studies show that 40% of employed Black women, 36% of employed white women, 32% of employed Asian women, and 30% of employed Hispanic women work in either the education or healthcare industries.
-
Single Black mothers have the highest likelihood of participating in the workforce compared to mothers of other races and ethnicities.
A BLS study that looked at working women with children under 18 found that 77.2% of Black mothers, 71.2% of white mothers, 65% of Asian mothers, and 63.9% of Hispanic mothers participate in the U.S. workforce.
-
Hispanic women earn 66% of the average salaries of Asian women.
Statistics show that the median weekly earnings of white women, Black women, Hispanic women, and Asian women are $817, $654, $617, and $937, respectively.
-
Women’s participation in the workforce has grown by more than 17% since 1950.
In 1950, women represented 29.6% of the American workforce. Today, they account for 47% of the U.S. labor force.
-
Less than 5% of CEOs of Fortune 500 companies are women.
According to workplace diversity research, only 3.6% of individuals leading America’s Fortune 500 companies are women, compared to 96.4% of men.
-
Women own more than 35% of firms in the United States.
According to Census data, women entrepreneurs and small business owners own 9,878,397 firms in the United States.
-
During the COVID-19 pandemic, men working at home while also caring for children were more likely to receive promotions and pay increases than women in the same position.
According to a CNBC report, 34% of men working remotely around children received a promotion, compared to just 9% of women. Similarly, 26% of men working at home around children received a pay raise, compared to just 13% of women.
-
Working-class women earn 65 to 81% of the wages of working-class white men.
According to an analysis by the Economic Policy Institute, working-class white women earn 19% less than working-class white men, while working-class Black women and working-class Hispanic women earn 30% and 35%, respectively, less than white men.
LGBTQ+ Diversity in the Workplace
-
Members of the LGBTQ+ community make up 6.28% of the United States’ workforce.
It’s estimated that seven million LGBTQ+ individuals work in the private sector, and more than one million are employed in the country’s public sector.
-
17 states in the United States have no state protections on workplace discrimination based on sexuality or gender identity.
Although 4.5% of the American population identifies as LGBTQ+, approximately 34% of the country does not have laws protecting against workplace harassment and discrimination based on sexuality or gender identity.
-
LGBTQ+ men and women are underrepresented in almost every level of business.
Workforce research shows that LGBTQ+ women represent 2.3% of entry-level employees and 1.6% of management-level employees, while LGBTQ+ men represent 3.1% of entry-level employees and 2.8% of management-level employees.
-
Bisexual women are especially likely to experience microaggressions at work.
When compared to straight women, bisexual women are 13% more likely to experience workplace microaggressions. When compared to straight men, they are 28% more likely to experience workplace microaggressions.
-
Members of the LGBTQ+ community believe their gender identity or sexuality will negatively affect their careers.
Three in 20 LGBTQ+ women have reported thinking that their sexual orientation will negatively affect their career prospects. Meanwhile, six in 20 LGBTQ+ men have reported thinking that their sexual orientation will negatively affect their career prospects.
-
LGBTQ+ women out of the closet are more comfortable and happier at work than those who are closeted.
Studies show that 32% of LGBTQ+ women out of the closet are happy with their career, compared to 27% of LGBTQ+ women who are not out of the closet.
-
Transgender individuals are more likely to think about leaving their company after less than a year than cisgender people.
According to a study by McKinsey Company, 32% of trans people frequently think about leaving their company, and 18% expect to stay at their current company for less than 12 months, compared to 21% and 8%, respectively, of cisgender people.
-
40% of employees want their companies to be more inclusive in hiring members of the LGBTQ+ community.
Many employees feel that their compnaies don’t do enough to increase diversity in the realm of sexual orientation.
Diversity in the Workplace Statistics Over Time
-
By 2050, immigrants and children of immigrants will represent approximately 83% of the working-age population in the United States.
Research suggests that the ratio of people of color participating in America’s labor force will increase as the nation becomes more diverse. According to census data, there will be no racial or ethnic majority in the United States by 2050.
-
The percentage of Black employees, Hispanic employees, and female employees has grown significantly between 1999 and 2019.
According to data collected by the BLS, between 1999 and 2019, Black employees grew by 26%, Hispanic employees grew by 98.1%, and female employees grew by 18.5%.
-
People of color will represent the majority of the United States’ working class by 2032.
Labor force projections estimate that over the next 10 years, people of color will represent the majority of the working class, including people without a college degree, and comprises about two-thirds of the civilian labor force.
Similarly, the U.S. Census Bureau expects the majority of the country’s working-age population to be individuals of color, which includes all nonwhite racial and ethnic groups, by 2039.
-
33% of companies in the United States are more racially and ethnically diverse than the national average.
This number dropped slightly between 2015 and 2018 but is expected to increase due to recent current events surrounding racial equality in the workplace.
Benefits of Diversity in the Workplace
-
Companies with women executives are most likely to outperform companies without women executives financially.
According to a study by McKinsey Company, businesses with more than 30% female executives are 25% more likely to outperform companies with just 10 to 30% female executives.
-
Diverse companies are 35% more profitable than non-diverse companies.
Research showed that companies with diverse employees and leadership teams make 35% more money than companies without diversity in 2019. This number was up from 33% in 2017 and 35% in 2014.
-
Workplace diversity and innovation efforts attract a larger pool of candidates during recruiting.
According to a National Association of Colleges and Employers survey, 79% of new graduates rate work diversity as “very important.”
-
Diverse companies have more satisfied and happier employees than companies with low diversity levels.
According to survey research, American employees who think their employer is “not doing enough” to prioritize diversity have a Workforce Happiness Index score of 63, almost 10 points under the average score of 72.
-
Companies in the United States with greater ethnic and racial diversity have higher performance rates.
According to data, businesses with more diversity among staff perform 35% better than companies whose staff demographics only match the national average.
-
Diverse companies are better equipped to capture a bigger market and generate more money than companies without diversity and inclusion campaigns.
The entertainment industry alone is losing a projected $10 billion each year because of systematic issues with inclusivity and the underrepresentation of Black populations in TV and film.
-
Diverse businesses are 70% more likely to capture new markets.
Diverse teams are also 45% more likely to grow their company’s market share, according to a report by the Harvard Business Review.
Job Seekers, Employees, and Managers Opinions on Diversity in the Workplace
-
52% of people think diversity in the workforce is a positive thing.
In a McKinsey Company survey, most people said workplace diversity was positive, while 17% were neutral towards the topic, and 31% felt negatively towards workplace diversity.
-
37% of job seekers and employees have reported that they would not apply for a job with a company that had negative ratings among people of color.
Studies show that workplace diversity is especially important to young job seekers in the Gen Z and Millennial generations.
-
40% of workers recently surveyed by CNBC said that the last year’s events had made diversity more of a priority at their companies.
The Black Lives Matter movement has been a driving force for many new diversity and inclusion efforts in American businesses.
-
Although most Americans support diverse workplaces, racial inequality continues to exist in hiring processes in the United States.
White employees represent the largest portion of corporate executives in the nation. Although 13.4% of the total U.S. population is Black, only 2% of executives are Black. Similarly, although 18.5% of the U.S. population is Latinx, only 3% of executives are Latinx.
-
76% of American workers surveyed in July 2020 thought racism was a problem in workplaces across the United States.
In the same survey, 64% of Black employees expressed that racism was a problem in their workplace.
-
In 2015, 41% of surveyed managers claimed to be “too busy” to implement diversity initiatives.
According to an SHRM report, one-fifth of Fortune 1000 companies had unstructured or informal diversity efforts. A similar report by Deloitte found that diversity and inclusion was one of the least important HR issues on employers’ minds.
Age Diversity in the Workplace
-
More than 90% of Whites, Blacks, and Asians in the American workforce who are 25 years of age and older have a high school diploma.
Among the same age group, 76% of Hispanics have at least a high school diploma. Higher education was most prevalent among Asians aged 25 years and older, with 63% of Asians in the labor force holding a Bachelor’s degree or higher.
-
Between 2019 and 2029, the number of employees over the age of 75 is expected to increase, while the number of employees aged 16 to 24 is expected to decrease.
According to the U.S. Bureau of Labor Statistics, the number of employed individuals aged 75 and older is expected to grow by 93.7%. In comparison, the employment rate for people between 16 and 24 years of age is estimated to drop by 7.7%.
-
People aged 55 and older represent the largest portion of the United States’ workforce by age.
Employees aged 16 to 24 make up 12.9% of the U.S. labor force, employees aged 25 to 34 account for 22.7%, employees aged 35 to 44 for 20.8%, employees aged 45 to 54 for 20.1%, and employees aged 55 and older 23.4%.
-
Between 2001 and 2031, the percentage of U.S. workers who are 75 years old and older is expected to grow from 3.1% to 9.1%.
The percentage of those between the ages of 55 and 64 will also increase, moving from 10.5% to 15.4%, while the employment percentages of all other age groups are expected to decrease.
The percentage of U.S. employees between the ages of 16 and 24 is expected to drop from 15.6% to 11.3%, the percentage of 25- to 34-year-olds will go from 22.5% to 21.4%, the percentage of 35- to 44-year-olds will drop from 26% to 22.6%, and the percentage 45- to 54-year-olds will move from 22.3% to 21.1%, according to the U.S. Bureau of Labor Statistics.
Unemployment Rates of Underrepresented Demographics
-
As of the third quarter of 2021, the national unemployment rate was 5.2%.
The rate of unemployment was 8.4% for Black Americans and 6.2% for Hispanic or Latino Americans.
The rates were significantly lower for Whites, at 4.6%, and Asians, at 4.7%.
Thankfully, all of those unemployment rates are down significantly from the same time in 2020.
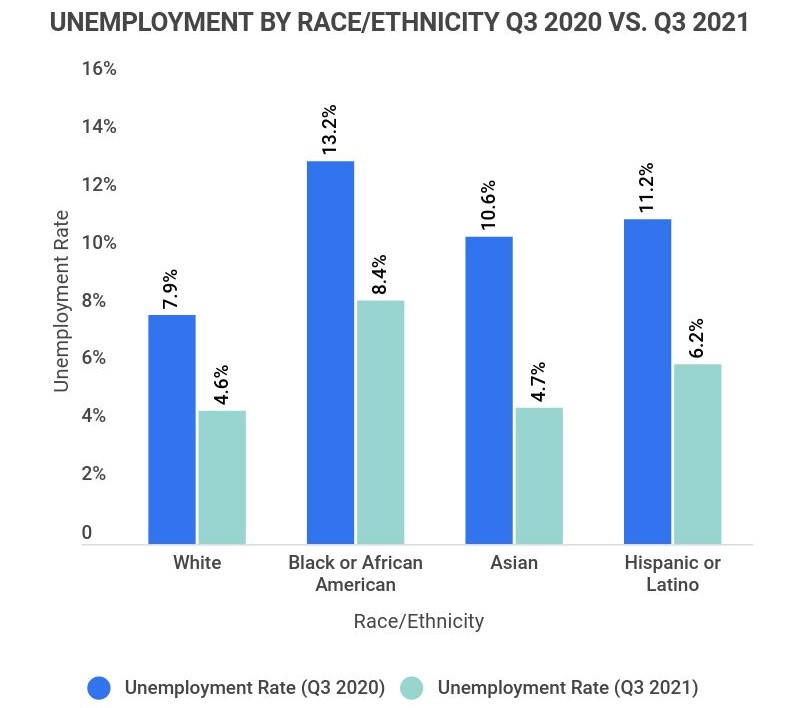
Unemployment by Race and Ethnicity Q3 2021
Race/Ethnicity Unemployment Rate (Q3 2020) Unemployment Rate (Q3 2021) White 7.4% 4.6% Black or Black 13.2% 8.4% Asian 10.6% 4.7% Hispanic or Latino 11.2% 6.2% -
The average unemployment rate for Hispanic people or people of Latino ethnicity is one percentage point higher than non-Hispanics.
According to BLS reports, the national unemployment rate for Hispanics and Latinos was 4.7% in 2018, while the rate for non-Hispanics was only 3.7%.
-
Unemployment rates vary by gender, but more so among Hispanic Americans and Black Americans than Whites and Asians.
A federal employment study that analyzed average unemployment rates between 1973 and 2018 found that the unemployment rate for Black men 20 years of age and older was 6.2%, while the unemployment rate for Black women 20 years of age and older was 5.6%.
Meanwhile, the unemployment rate for adult Hispanic men was 3.8%, lower than the 4.7% unemployment rate recorded among adult Hispanic women. Unemployment rates for Asians and Whites, however, showed little to no difference between men and women.
-
The majority of people unemployed during the height of the COVID-19 pandemic were women.
Approximately 80% of the 1.1 million American workers who left the labor force in September 2020 were women.
-
In 2021, the unemployment rate is higher for middle-aged people than for individuals over the age of 55.
According to recent labor statistics, the June 2021 unemployment rate was 9.9% for people aged 16 to 19 years old, 9.1% for people aged 20 to 24 years old, 5.5% for people ages 25 to 54 years old, and 4.9% for people aged 55 and older.
-
Amid the peak of the coronavirus pandemic, LGBTQ+ individuals faced a higher level of unemployment than the general public.
According to a national LGBTQ+ advocacy group poll, 17% of lesbian, gay, bisexual, and queer Americans lost their job due to COVID-19, compared to 13% of the general population.
The unemployment rate was even higher for LGBTQ+ people of color, with 22% reporting losing their jobs because of the global pandemic.
Diversity in the Workplace FAQ
-
Does diversity in the workplace really make a difference?
Yes, diversity in the workplace really makes a difference. Companies with a racially and ethnically diverse leadership team are 35% more likely to outperform companies with little to no diversity at the senior level. Equal gender diversity has also been shown to have between a 15-21% impact on revenue compared to companies that heavily favor one gender.
Additionally, 67% of job seekers consider diversity a priority when considering where to work. In other words, companies that fail to prioritize diversity will miss out on (at least) 2/3 of the best talent that the country has to offer.
-
What are examples of diversity in the workplace?
There are many examples of diversity in the workplace, from different skin colors to different cultures. Prominant examples of diversity in the workplace include:
-
Race
-
Sex/Gender
-
Sexual orientation
-
Culture
-
Religion
-
Age
-
Disability
-
Socioeconomic
-
Nationality
By including people from different backgrounds along these vectors, a workplace benefits from a greater number of voices, life experiences, and opinions.
-
-
What is the benefit of diversity in the workplace?
There are many benefits to having diversity in the workplace. First, a company benefits by having access to a variety of backgrounds, life experiences, and opinions that can help create an organization that’s inclusive and respectful of all people.
People who all come from the same background might have an easier time making a cohesive company culture, but they’re also more likely to share the same blind spots. If a company wants to succeed in multiple markets, leadership needs to hear and respond to the diverse voices that make up the community they hope to engage with.
-
How do you show that you respect and value diversity in your workplace?
To show that you respect and value diversity in your workplace, start by taking an honest inventory of the unconscious bias that exists in the company’s leadership. Invite honest feedback from employees on where they’d like to see improvement in this department.
There are obvious steps that every employee will appreciate, like promoting pay transparency and equity, creating a strong policy on cases of identity-based bullying and harassment, and acknowledging holidays outside of the corporate calendar.
As far as hiring practices go, you don’t have to go out and hire “diverse” people as a cheap form of tokenism. Instead, try to adjust your hiring process to take into account the need for “culture add” as well as “culture fit.” Hiring for cultural fit alone will inevitably lead to a monolithic team that, as the statistics above show, will likely perform worse.
Diversity isn’t something that you perform for the sake of improving your corporate image — it takes genuine and consistent dialogue that takes place between a diverse leadership team and the diverse employees who comprise the company.
-
Is diversity in the workplace increasing?
Yes, diversity in the workplace is increasing. Over the next six years, the Bureau of Labor Statistics (BLS) predicts that diversity across almost all demographics will increase in the U.S.
For example, 48% of Gen Z, which is the latest generation to enter the workforce, are racial or ethnic minorities. Comparably only 29% of Baby Boomers are, which means Gen Z is 65.5% more diverse. Knowing that, it’s easy to see how the workforce will become progressively more diverse over time.
Conclusion
Although most of the United States’ current labor force is white, the country’s diversity is increasingly being reflected in businesses across the fifty states. Females represent the majority of America’s workforce today, and population statistics estimate that people of color will represent the majority of the working class by 2032.
Over the past few decades, diversity in the U.S. workplace has drastically improved, with the percentage of Black, Hispanic, and female employees growing by 26%, 98.1%, and 18.5%, respectively, between 1999 and 2019.
Now, immigration reform continues to be a driving factor in workplace diversity, with immigrants and children of immigrants expected to represent 83% of the working-age population in the United States by 2050.
With profit margins drastically increasing among businesses with diverse staff and 76% of job seekers and employees prioritizing workplace diversity, the future of diversity in the United States’ labor force looks bright.
References
-
U.S. Bureau Of Labor Statistics. “Labor Force Characteristics By Race And Ethnicity, 2020.” Accessed on 2/6/2023.
-
U.S. Bureau Of Labor Statistics. “Labor Force Characteristics By Race And Ethnicity, 2018.” Accessed on 8/1/2021.
-
Center For American Progress. “The State Of Diversity In Today’s Workforce.” Accessed on 8/1/2021.
-
United States Census Bureau. “United States Census Bureau Quick Facts.” Accessed on 8/1/2021.
-
U.S. Bureau Of Labor Statistics. “Civilian Labor Force By Age, Sex, Race, And Ethnicity.” Accessed on 8/3/2021.
-
U.S. Bureau Of Labor Statistics. “Labor Force Share, By Age Group, 1998, 2008, 2018, And Projected 2028.” Accessed on 8/3/2021.
-
U.S. Bureau Of Labor Statistics. “Labor Force Share, By Age Group, 2001, 20011, 2021, And Projected 2031.” Accessed on 2/6/2023.
-
Economic Policy Institute. “People Of Color Will Be A Majority Of The American Working Class In 2032.” Accessed on 8/3/2021.
-
McKinsey Company. “Diversity Wins: How Inclusion Matters.” Accessed on 8/3/2021.
-
CNBC. “Companies Are Making Bold Promises About Greater Diversity, But There’s A Long Way To Go.” Accessed on 8/3/2021.
-
The Washington Post. “For Younger Job Seekers, Diversity And Inclusion In The Workplace Aren’t A Preference. They’re A Requirement.” Accessed on 8/3/2021.
-
CNBC. “Majority Of Employees Want To Work For A Company That Values Diversity, Equity, And Inclusion, Survey Shows.” Accessed on 8/3/2021.
-
Wake Forest University. “Promoting Cultural Diversity In The Workplace: Statistics, Tips, And Resources.” Accessed on 8/3/2021.
-
CNBC. “Men Have Been Promoted 3 Times More Than Women During The Pandemic, Study Finds.” Accessed on 8/3/2021.
-
McKinsey Company. “How The LGBTQ+ Community Fares In The Workplace.” Accessed on 8/3/2021.
-
Payscale. “Racial Wage Gap.” Accessed on 8/3/2021.
-
Forbes. “What’s To Come In 2021 For Diversity, Equity, And Inclusion In The Workplace.” Accessed on 8/3/2021.
-
U.S. Bureau Of Labor Statistics. “Labor Force Statistics From The Current Population Survey.” Accessed on 8/3/2021.
-
NBC News. “LGBTQ People Face Higher Unemployment Amid Coronavirus Pandemic, Survey Finds.” Accessed on 8/3/2021.
-
Harvard Business Review. “How Diversity Can Drive Innovation.” Accessed on 8/3/2021.
-
Forbes. “Five Trends Driving Workplace Diversity in 2015.” Accessed on 8/3/2021.
-
National Bureau of Economic Research. “Systemic Discrimination Among Large U.S. Employers.” Accessed on 12/21/2021.
- Demographic Reports
Author
Elsie is an experienced writer, reporter, and content creator. As a leader in her field, Elsie is best known for her work as a Reporter for The Southampton Press, but she can also be credited with contributions to Long Island Pulse Magazine and Hamptons Online. She holds a Bachelor of Arts degree in journalism from Stony Brook University and currently resides in Franklin, Tennessee.