Season in Review 2021–22
Indices of habitat conditions, weather, and regional duck abundance
Indices of habitat conditions, weather, and regional duck abundance
Mike Brasher, PhD, Waterfowl Scientist, Ducks Unlimited, Inc.
Steve Adair, PhD, Chief Scientist, Ducks Unlimited, Inc.
This report describes broad-scale indices of habitat conditions, weather, and regional duck abundance during the 202122 waterfowl hunting season. For the second consecutive year, waterfowl managers were without a full suite of breeding population and habitat surveys. Entering spring 2021, nearly the entire Prairie Pothole Region and western U.S. were in moderate to exceptional drought, and these conditions worsened as summer progressed. Duck production in drought-affected areas was likely well below average, while more stable breeding regions of Alaska, the boreal forest, and Great Lakes should have contributed average production. Overall, managers expected a below average fall flight composed heavily of adult birds, with greatest effects to be felt in the Central and Mississippi Flyways. Reports from across the country of low juvenile harvest and overall low duck abundance were consistent with these expectations. Weather, habitat conditions, and hunter success were highly variable across space and time, as drought and below average precipitation in many regions caused hunting success to depend heavily on availability of managed water, especially early in the season. Winter east of the Rockies was punctuated by the contrast of a record warm December with a January that produced frigid temperatures, widespread snowfall, and coastal flooding. Delayed onset of winter contributed to extended hunting success in some northern latitudes but frustrated southern hunters with few birds and stale conditions. Winter storms in January eventually moved birds and changed habitat conditions, which benefitted many southern hunters.
Periodic storm systems in the West brought exceptional rain, providing early relief from drought and creating an abundance of short-term habitat for waterfowl. However, dry conditions returned in January, as California and Utah documented their 2nd and 3rd driest January on record, respectively. These weather conditions were generally consistent with those expected during a La Nia climate pattern, which characterized the 202122 North American fall-winter. Mid-winter Waterfowl Survey abundances were down across most states in the Central and Mississippi Flyways. Total mallard counts across both flyways were down 25% from their 201221 averages and consistent with expectations for a below average fall flight. Hunter reports, survey results, and weather conditions indicated the 202122 season was indeed variable, with hunter success ranging from the worst ever to above average or best in recent memory. Overall assessments suggest a below average year, although not inconsistent with what many expected given the severe and widespread 2021 drought. Looking ahead, although periodic rain and snow brought some relief to drought-ravaged breeding regions of the prairies and western U.S., significant moisture deficits remained as of late February 2022. Fortunately, important breeding regions in Alaska, the western boreal forest, eastern Canada, and portions of the Great Lakes have experienced average or better winter precipitation and should provide another year of stable wetlands for drought-displaced waterfowl.

Many factors combine to influence the abundance and distribution of waterfowl during fall and winter, including temperature, snow and ice cover, precipitation, habitat quality and quantity, fall population size (a function of breeding population and productivity), disturbance, and agricultural land use practices. These have been documented and discussed by numerous authors, including peer- reviewed scientific publications (Nichols et al. 1983, Schummer et al. 2010, Hagy et al. 2016) and popular magazine articles (Brasher 2019, Moorman 2019, Moorman 2020). Weather variables are among the most well studied and the only ones quantified in a manner that enables timely examination of how they may have influenced waterfowl distributions and hunting experiences.
This report provides a large-scale overview of biological and environmental conditions in the contiguous U.S. in 202122 and their potential influence on duck abundance and distribution during fall-winter. Notable among these are breeding habitat conditions, which are pivotal in determining productivity and the overall fall flight, as well as large-scale weather patterns and landscape conditions during SeptemberJanuary. During the non-breeding season, waterfowl movements can be southerly and northerly as well as east and west. The relative influence of these factors varies across space, time, and among waterfowl species. Descriptions herein are intended to be general in nature and are not definitive assessments of either the distribution of waterfowl at specific times and locations or the conditions that affected them.
Also presented are results from Mid-winter Waterfowl Surveys (MWS) of states in the Central and Mississippi Flyways. Comparable data are not available for the Pacific and Atlantic Flyways, as few of their states continue to conduct MWS. The data presented herein were obtained from state and federal waterfowl managers and provide an index of abundance during early January within surveyed regions, reported in absolute numbers and as departures from 201221 averages. Because survey methods vary among states, and many factors influence survey estimates, caution is advised when comparing results between states. Additionally, regional waterfowl abundance is a function of continental population size and its distribution at the time of the survey. Departures from average reflect the combined effect of these, which hinders definitive assessments of the primary drivers of departures within a single year.
For the second consecutive year, waterfowl managers were unable to conduct the full suite of waterfowl breeding population and habitat surveys, creating additional uncertainty about the status of breeding waterfowl populations and habitat conditions. Similar to 2020, insights were available primarily from state-level surveys and large-scale indices of environmental conditions. Entering spring 2021, nearly the entire Prairie Pothole Region was in moderate to extreme drought, and these conditions worsened as summer progressed (Figure 1). Pond counts from the North Dakota Game and Fish Department declined 80% from 2020, the North Dakota duck index declined by 27%, and observers across the prairies described the drought as the most severe and widespread since the 1980s. Exceptional drought also gripped much of the western U.S., including regionally important waterfowl breeding areas in the California Central Valley and Intermountain West. However, average to excellent wetland conditions were reported across much of Alaska and the Canadian boreal forest. Waterfowl biologists believe many breeding ducks likely overflew the parched prairie and settled in typically less productive habitats farther north. Given these conditions, waterfowl managers expected low production in the mid-continent in 2021, especially among prairie-nesting dabblers and divers (mallard, northern pintail, blue-winged teal, northern shoveler, gadwall, canvasback, redhead), resulting in a fall flight that was likely well below recent averages. Given their heavy reliance on prairie production, hunters in the Central and Mississippi Flyways were expected to experience the most notable effects. Anecdotal reports from the field seemed to corroborate this expectation, including an adult-dominated harvest, advanced development of male breeding plumage in the fall (suggesting an early end to breeding effort), and low numbers of juvenile birds captured during winter banding operations. In the western U.S., local production was expected to be extremely low, although average conditions in Alaska likely yielded a decent supply of young birds for Pacific Flyway hunters. Wetland conditions and duck production in the more stable breeding habitats of eastern U.S. and Canada were expected to be about average, although the lack of production in the prairies likely contributed to a below-average fall flight in the Atlantic Flyway.
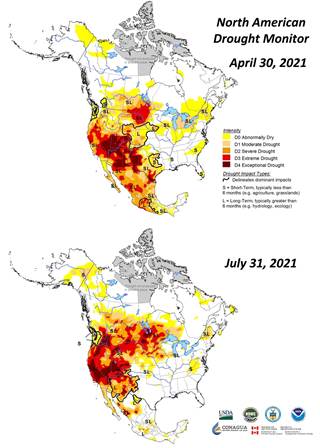
Figure 1. Status of drought in North America on April 30 and July 31, 2021. Maps from the North American Drought Monitoring program, https://www.ncdc.noaa.gov/temp-and-precip/drought/nadm.
The 202122 waterfowl season began with a La Nia climate pattern in place, which typically produces warm and dry conditions across much of the southern U.S. and cooler and wetter conditions in the north. As the season progressed, environmental conditions varied widely on an approximate monthly rhythm. Following an average September that produced a few timely cold fronts beneficial to early teal hunters, October brought the beginning of monthly temperature swings. (Figure 2). Warm weather dominated the central and eastern U.S., while a series of weather systems brought welcome rain and cooler temperature to the Pacific Flyway. The pattern flipped in November, with above average temperature returning to the West, and hunters in the eastern U.S. gaining optimism as temperatures cooled and waters in prairie Canada finally froze. December brought exceptional warmth to many areas of the U.S., with numerous states documenting the warmest December on record. Widespread warmth delayed migration from northern latitudes, which provided extended hunting opportunity in the north, but resulted in low duck numbers and frustrated hunters across mid- and southern latitudes. January brought welcome change for southern hunters, as a series of winter storms sent temperatures plunging across the central and eastern U.S. Cold temperatures remained entrenched for much of January, which produced noticeable movements of birds and enjoyable hunting conditions. Nevertheless, reports from the field suggested low duck abundance despite the favorable weather conditions, almost certainly a reflection of a reduced fall flight.
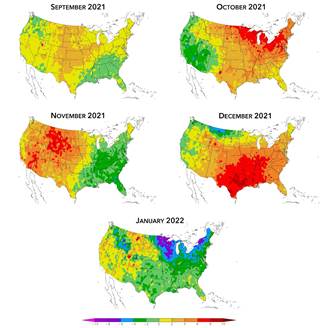
Figure 2. Average monthly temperature (F) departure from normal for the contiguous U.S., Sep 2021Jan 2022, https://hprcc.unl.edu/maps.php?map=ACISClimateMaps.
Entering fall, wetland conditions in southern and mid-latitudes were variable, with some regions in excellent shape and primed for the arrival of early migrant blue-wings, while others remained in extreme drought. Prairie drought limited the availability of wetlands for staging waterfowl and contributed to reduced duck abundance and difficult hunting. October brought record rainfall to portions of the western U.S. and Canada, offering some relief from the drought. Abundant rain in the mid-western U.S. generated above average stream flows and boosted wetlands across the landscape, while southern states continued to experience below average rainfall (Figures 3 and 4). Drying conditions expanded across the U.S. in November, especially in southcentral and western states. Wetland systems that rely heavily on overbank flooding, such as bottomland hardwoods in Arkansas and Mississippi, remained dry well into winter, reducing availability of habitat for both ducks and hunters. December brough another round of much needed rain for portions of the West, while snow began to accumulate across the northern plains. Dry conditions across the southcentral and western U.S. intensified into January, although portions of the Mid- South benefitted from locally abundant rain during early- and mid-January. With a few notable exceptions, precipitation and streamflow conditions were overall below average during the 202122 waterfowl season and consistent with expectations during a La Nia climate pattern.
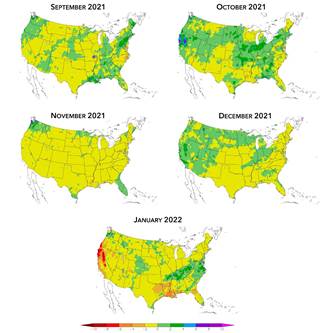
Figure 3. Total monthly precipitation (in), departure from normal for the contiguous U.S., Sep 2021Jan 2022, https://hprcc.unl.edu/maps.php?map=ACISClimateMaps.
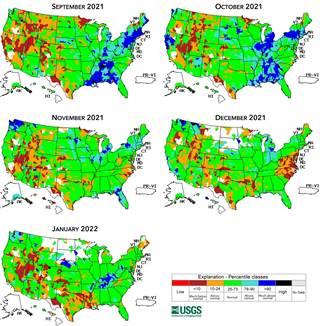
Figure 4. Monthly streamflow percentiles for the contiguous U.S., Sep 2021Jan 2022, https://waterwatch.usgs.gov/index.php?ym=202201&=nwc.
Snow and ice cover influence waterfowl distribution and migration by reducing or preventing access to critical resources, including residual grain in harvested crop fields or diverse foods and roosting sites in wetlands, rivers, and lakes. Snowfall during the 202122 waterfowl season was below average across much of the U.S. Limited snow occurred through November, with modest accumulations across the northern prairies, Great Lakes, and northeastern U.S. (Figure 5). It would be until late December and January before significant and widespread snow fell at mid- and northern latitudes. Throughout January, the 5 winter storms that brought plunging temperatures also delivered repeated snowfall, ice, tropical storm force winds, and coastal flooding to areas east of the Rockies. These storms created vastly different conditions than those experienced in December, putting birds on the move and contributing to hopeful optimism among southern hunters.
Ice cover on the Great Lakes, measured as percent of average through time, serves as a useful index for ice conditions on open water habitats (Figure 6). Above average temperatures for much of fall and early winter held Great Lakes ice cover well below average through December. As temperatures dropped in January, ice expanded rapidly, eventually exceeding seasonal averages on some waterbodies. However, warm waters from November and December caused a lag in the timing and thickness of ice formation, which likely delayed bird movements more than typically expected given the frigid January temperatures.
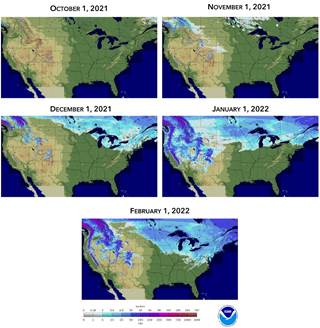
Figure 5. Daily snow depth (in) on the first day of each month, Oct 2021Feb 2022, for the contiguous U.S., https://www.nohrsc.noaa.gov/nsa/.
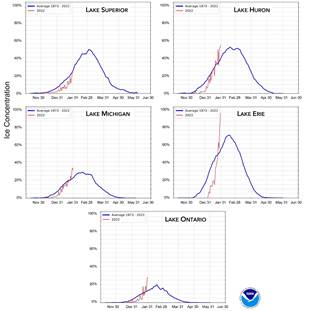
Figure 6. Winter pattern of long-term (19732021) average ice cover (%) on the Great Lakes, compared to current year, as of Jan 31, 2022. https://coastwatch.glerl.noaa.gov/statistic/statistic.html
Overall, January 2022 Mid-winter Waterfowl Survey counts were down across most states in the Central and Mississippi Flyways (Tables 1 and 2), with total mallard counts across both flyways down 25%. In the Central Flyway, counts were considerably below average in the Dakotas and most of the central great plains, with Kansas a notable exception documenting their 9th highest mid-winter mallard count on record. Although Texas counts were down only marginally, these results were driven heavily by an abnormally high estimate for redheads on the coast. In contrast, state-wide mallard counts in Texas were down nearly 50% from the recent 10-year average. Total duck and mallard counts were below average in all Mississippi Flyway states except Missouri and Ohio, where mallards were 25% and 8% above average, respectively. In Louisiana, state-wide mallard counts were down 86%, while the total count of dabbling ducks on the coast was down 38% from average.
Survey reports from nearly every state noted the arrival of a significant winter storm immediately prior to the survey period, which dramatically altered the availability of waterfowl habitats and likely affected the distribution of waterfowl at both local and regional scales. Thus, distributions or abundances observed during the mid-winter period should not be viewed as representative of those that occurred during the weeks or months before or after the survey periods. Additionally, mid-winter surveys capture only a fraction of all waterfowl on the landscape and do not reflect total winter population abundances. Departures from 201221 averages, however, provide insight on how relative abundances and distributions at mid-winter compare to previous years.
Table 1. Mid-winter Waterfowl Survey (early January 2022) results from states in the Central Flyway expressed in absolute numbers and departure percentages from 10-year (201221) averages.
Texas (STATE-WIDE)
3,620,034 total ducks; 8%
299,460 mallards; 47%
Texas (COASTAL)
1,491,366 total ducks; 10%
421,137 total dabblers; 36%
New Mexico
66,017 total ducks; 44%
19,849 mallards; 44%
Oklahoma
131,383 total ducks; 38%
100,774 mallards; 41%
Kansas
680,437 total ducks; 84%
587,779 mallards; 92%
Nebraska
143,294 total ducks; 40%
130,594 mallards; 44%
Colorado
105,274 total ducks; 25%
85,037 mallards; 30%
Wyoming
18,718 total ducks; 58%
17,895 mallards; 51%
South Dakota
23,368 total ducks; 85%
23,136 mallards; 85%
Montana
39,482 total ducks; 59%
35,980 mallards; 64%
North Dakota
7,000 total ducks; 72%
7,000 mallards; 72%
Central Flyway Total
4,835,007 total ducks; 8%
1,307,504 mallards; 22%
Table 2. Mid-winter Waterfowl Survey (early January 2022) results from states in the Mississippi Flyway expressed in absolute numbers and departure percentages from 10-year (201221) averages. Minnesota and Wisconsin not reported as they no longer conduct mid-winter surveys.
Louisiana (STATE-WIDE)
2,372,104 total ducks; 23%
27,573 mallards; 86%
Louisiana (COASTAL)
2,264,635 total ducks; 14%
1,123,000 total dabblers; 38%
Mississippi
687,228 total ducks; 11%
195,533 mallards; 25%
Alabama
60,032 total ducks; 11%
15,727 mallards; 12%
Arkansas
990,573 total ducks; 7%
634,706 mallards; 11%
Missouri
773,737 total ducks; 21%
622,784 mallards; 25%
Tennessee
462,463 total ducks; 28%
231,999 mallards; 49%
Kentucky
41,556 total ducks; 50%
28,389 mallards; 59%
Illinois
238,698 total ducks; 43%
164,922 mallards; 43%
Iowa
27,434 total ducks; 51%
23,165 mallards; 52%
Indiana
10,311 total ducks; 66%
7,513 mallards; 68%
Ohio
186,068 total ducks; 66%
63,212 mallards; 8%
Michigan
62,043 total ducks; 57%
23,109 mallards; 17%
Mississippi Flyway Total
5,912,247 total ducks; 17%
2,038,632 mallards; 24%
Severe drought across the prairies and western U.S. constrained duck production in 2021, and most managers expected the fall flight to be well below average with a higher percentage of adult birds. For some species, production from more stable breeding regions likely provided a modest buffer against low prairie production. Hunter reports generally supported this expectation with apparently low harvest of juvenile ducks in the central and eastern U.S. Weather and habitat conditions during the 202122 hunting season were highly variable in space and time, as drought and below average precipitation caused hunting success in many regions to be heavily dependent on availability of managed water. A roller-coaster winter east of the Rockies was punctuated by the contrast of a record warm December with a January that saw 5 winter storms produce frigid temperatures, widespread snowfall, and coastal flooding. A combination of ample water and above freezing temperatures through much of winter led to abundant ducks and consistent hunting in some locations, with Kansas, Missouri, and a few Great Lakes states being notable examples. Meanwhile, southern hunters reported few birds and slow hunts until winter weather moved birds and changed the landscape in January. Periodic rain in fall and early winter provided drought relief and much needed short-term habitat in the West, although in some locations flood conditions scattered birds widely and made for challenging hunts. Dry conditions returned to the West in January, with California and Utah documenting their 2nd and 3rd driest January on record, respectively. Hunter reports, survey results, and weather conditions suggest the 202122 season was highly variable, with hunting success ranging from the worst ever to above average or best in recent memory. Multiple factors combine to influence individual experiences and observations, especially at local scales, but overall assessments suggest a below average year, yet consistent with what many expected given the severe drought of 2021.
Entering fall 2021, soil moisture was low across much of the prairies, creating suboptimal conditions for filling wetlands upon spring snow melt. Localized fall precipitation in the U.S. and winter snow across portions of the Canadian prairies stands to provide a modest lift to wetland conditions in spring 2022, yet as of late February, significant moisture deficits remained across western North and South Dakota and southern Saskatchewan and Alberta. Across the western U.S., drought conditions are intensifying, making for another year of grim prospects for breeding waterfowl in the California Central Valley and Intermountain West (Figure 7). Significantly more moisture, in the form of either snow or rain, will be required to recover these important breeding regions from drought. Fortunately, breeding regions in Alaska, the Western boreal forest, eastern Canada, and much of the Great Lakes have experienced average to above average winter precipitation and should provide another year of abundant wetlands and good waterfowl production.
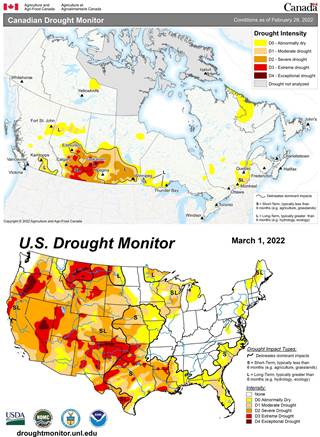
Figure 7. Status of drought in North America on January 31, 2022. Maps from the North American Drought Monitoring program, https://www.ncdc.noaa.gov/temp-and-precip/drought/nadm.
Download a PDF of Season in Review 2021-22
Share this photo


