Part One: Nondiscrimination Protections for LGBT People
Overview and Recent Trends: 2011-2018
Americans remain widely supportive of broad nondiscrimination protections for lesbian, gay, bisexual, and transgender (LGBT) people. Nearly seven in ten (69%) Americans favor laws that would protect LGBT people from discrimination in jobs, public accommodations, and housing. Support for these protections has remained steady over the past few years, with around seven in ten Americans reporting that they favor nondiscrimination provisions for LGBT people in 2017 (70%), 2016 (72%), and 2015 (71%).[1] These levels of support are similar to earlier, stable support for laws protecting gay and lesbian people against job discrimination, with roughly seven in ten supporting these protections in 2014 (72%), 2013 (73%), and 2011 (71%).[2]
Younger Americans are likelier than older Americans to say they support laws protecting LGBT people from various forms of discrimination. More than three-quarters (76%) of younger Americans (ages 18-29) favor such laws, compared to 59% of seniors (ages 65 and older). Support for LGBT nondiscrimination protections has declined slightly among younger Americans, with marginal decreases since 2017 (78%) and 2015 (80%). Support among seniors has remained fairly steady (61% in 2015 and 2017).
Nondiscrimination protections for LGBT Americans enjoy bipartisan support, with majorities of Democrats (79%), independents (70%), and Republicans (56%) reporting that they favor laws that would shield LGBT people from various kinds of discrimination.
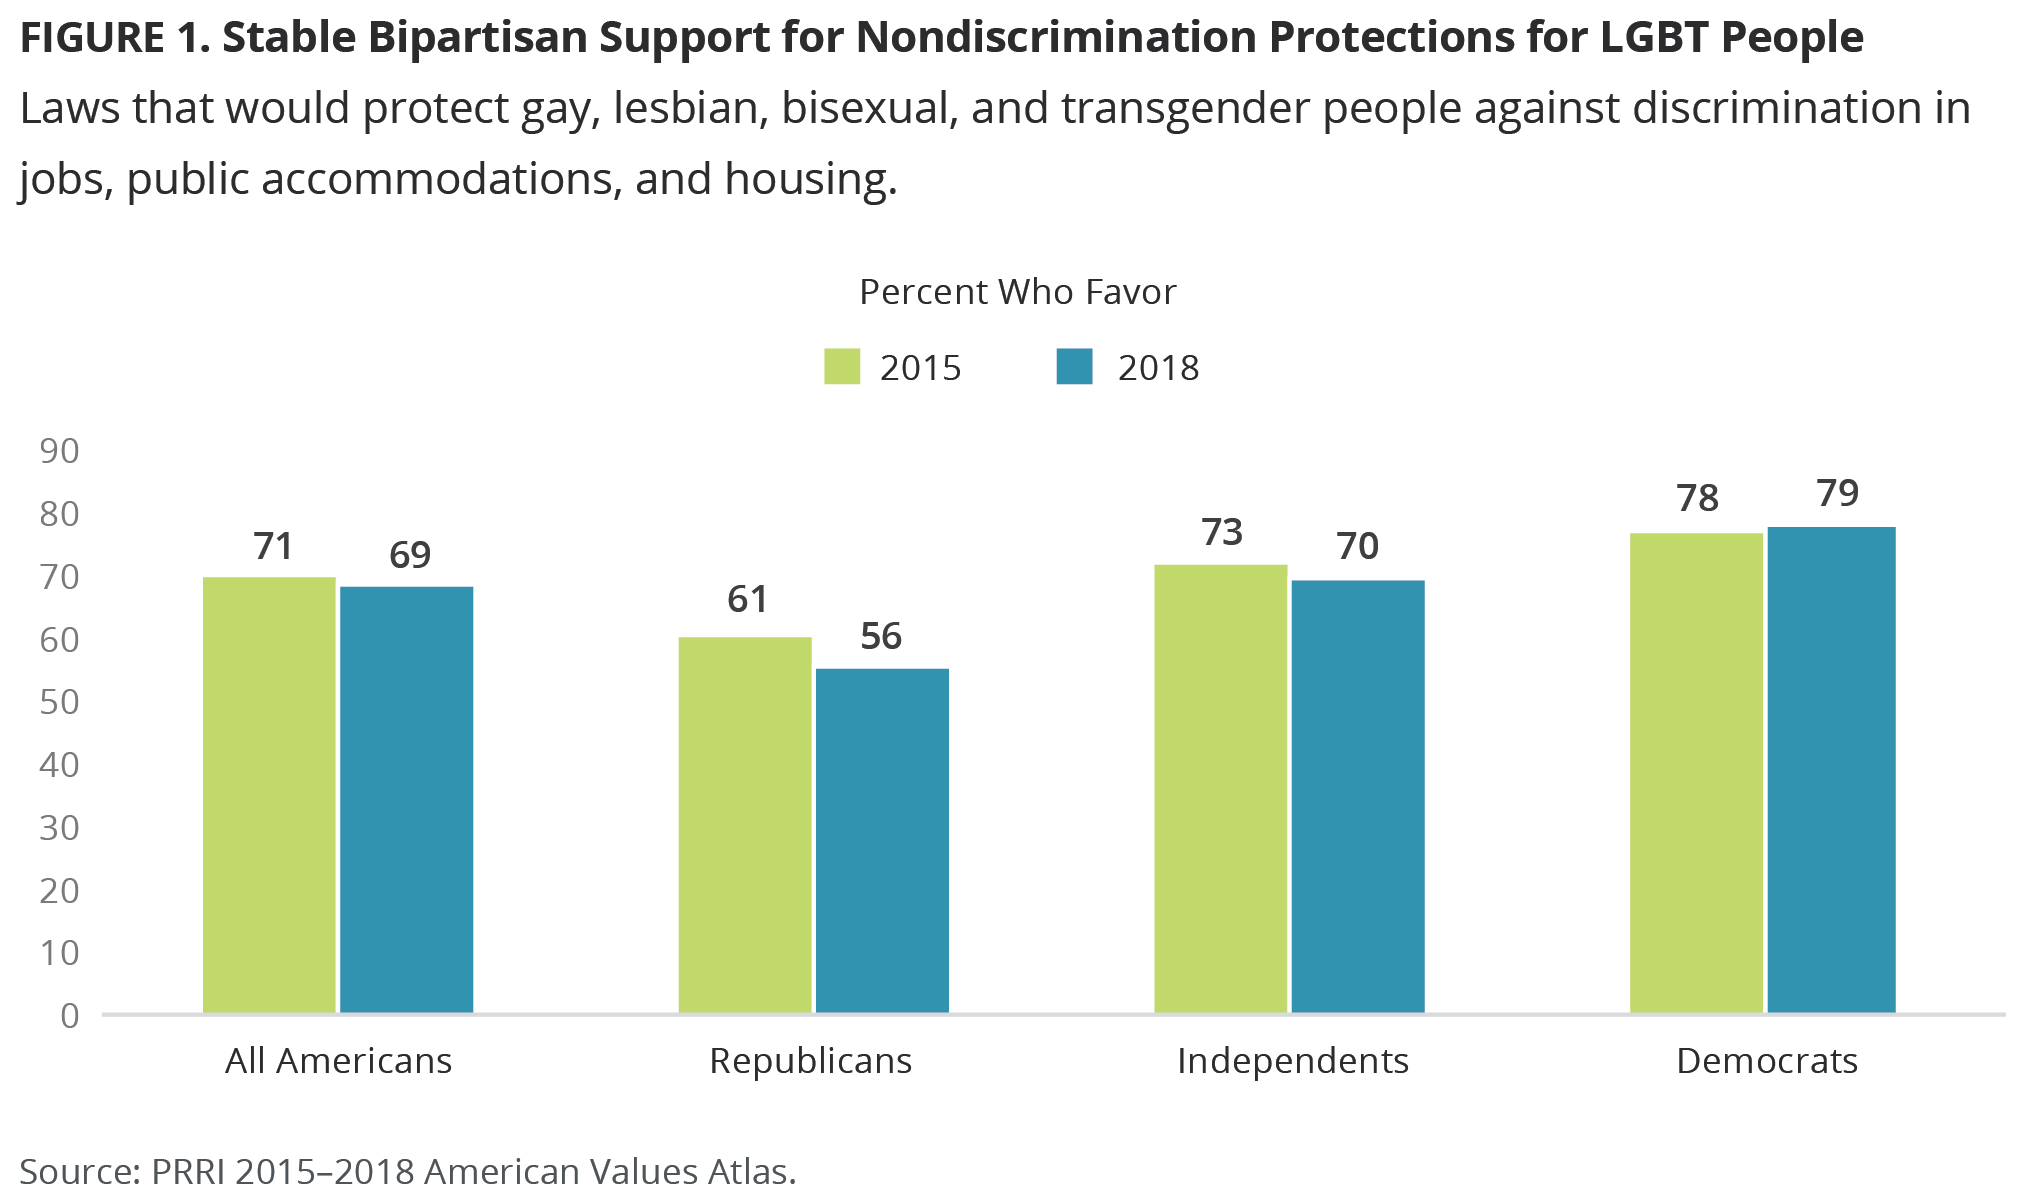
However, while support among Democrats and independents has remained mostly constant, Republican support for these provisions has fallen five percentage points over the past few years. In 2015, 61% of Republicans said they supported laws that would protect LGBT people from discrimination in jobs, public accommodations, and housing, compared to 58% in 2017 and 56% in 2018.
Notably, among Republicans, this drop in support has been concentrated among those who showed the highest support for LGBT protections just a few years ago. Since 2015, support for LGBT nondiscrimination protections has declined around ten percentage points among young Republicans ages 18-29 (74% to 63%) and liberal Republicans (68% to 59%).
Ideological differences largely track partisan differences. Although majorities of liberals (81%), moderates (76%), and conservatives (55%) all favor nondiscrimination protections for LGBT people, support is much higher among liberals. The level of support among conservatives has declined over the past few years, with greater support in 2017 (58%) and in 2015 (60%).
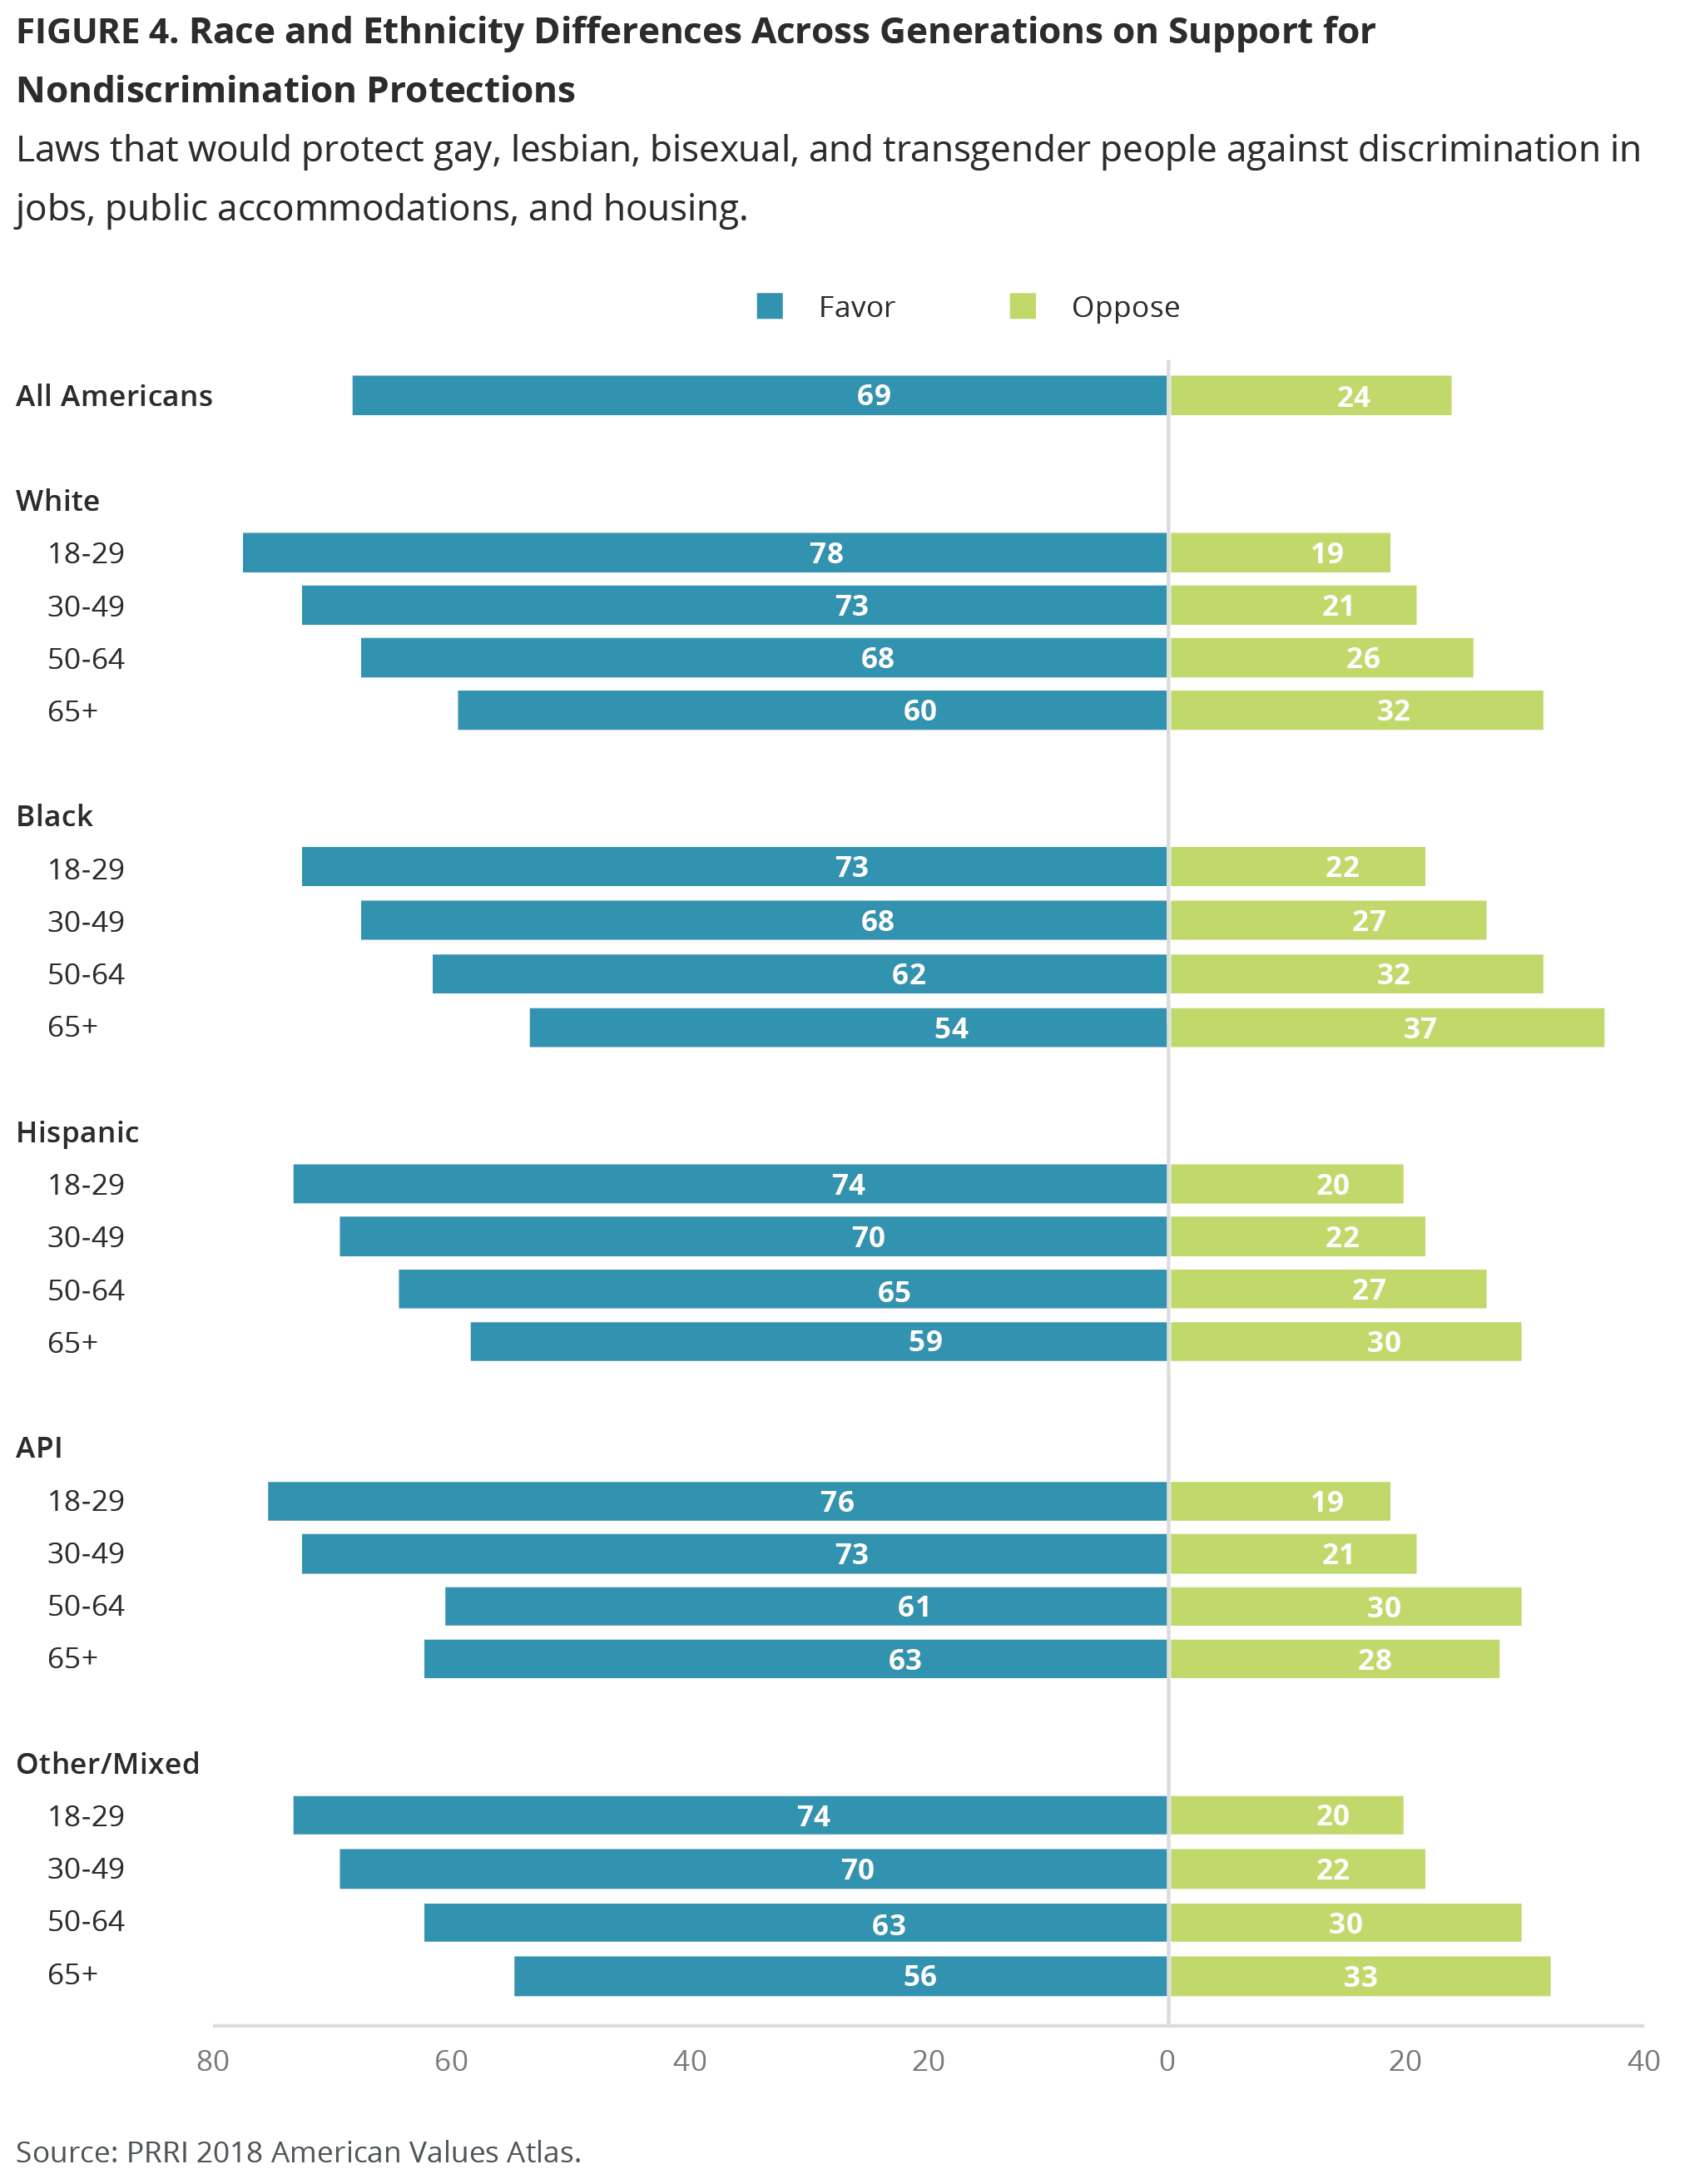
Solid majorities of Asian-Pacific Islander Americans (73%), Hispanic Americans (70%), white Americans (69%), black Americans (65%), and Native Americans (61%) favor laws that would protect LGBT people from discrimination in jobs, public accommodations, and housing. Seven in ten (70%) people who are another race or mixed race also support these protections.
Overall, Americans with higher levels of education are more likely to support laws protecting LGBT people from discrimination in housing, public accommodations, and jobs. Nearly eight in ten (78%) Americans with a postgraduate degree, 74% of Americans with a college degree, and 70% of Americans who attended some college favor such protections, compared to about six in ten Americans with a high school degree or less (62%). Compared to 2015, support has declined slightly across these groups. Americans with a postgraduate degree (82%), college degree (78%), with some college experience (73%), and with a high school degree or less (64%) all reported slightly higher support levels in 2015.
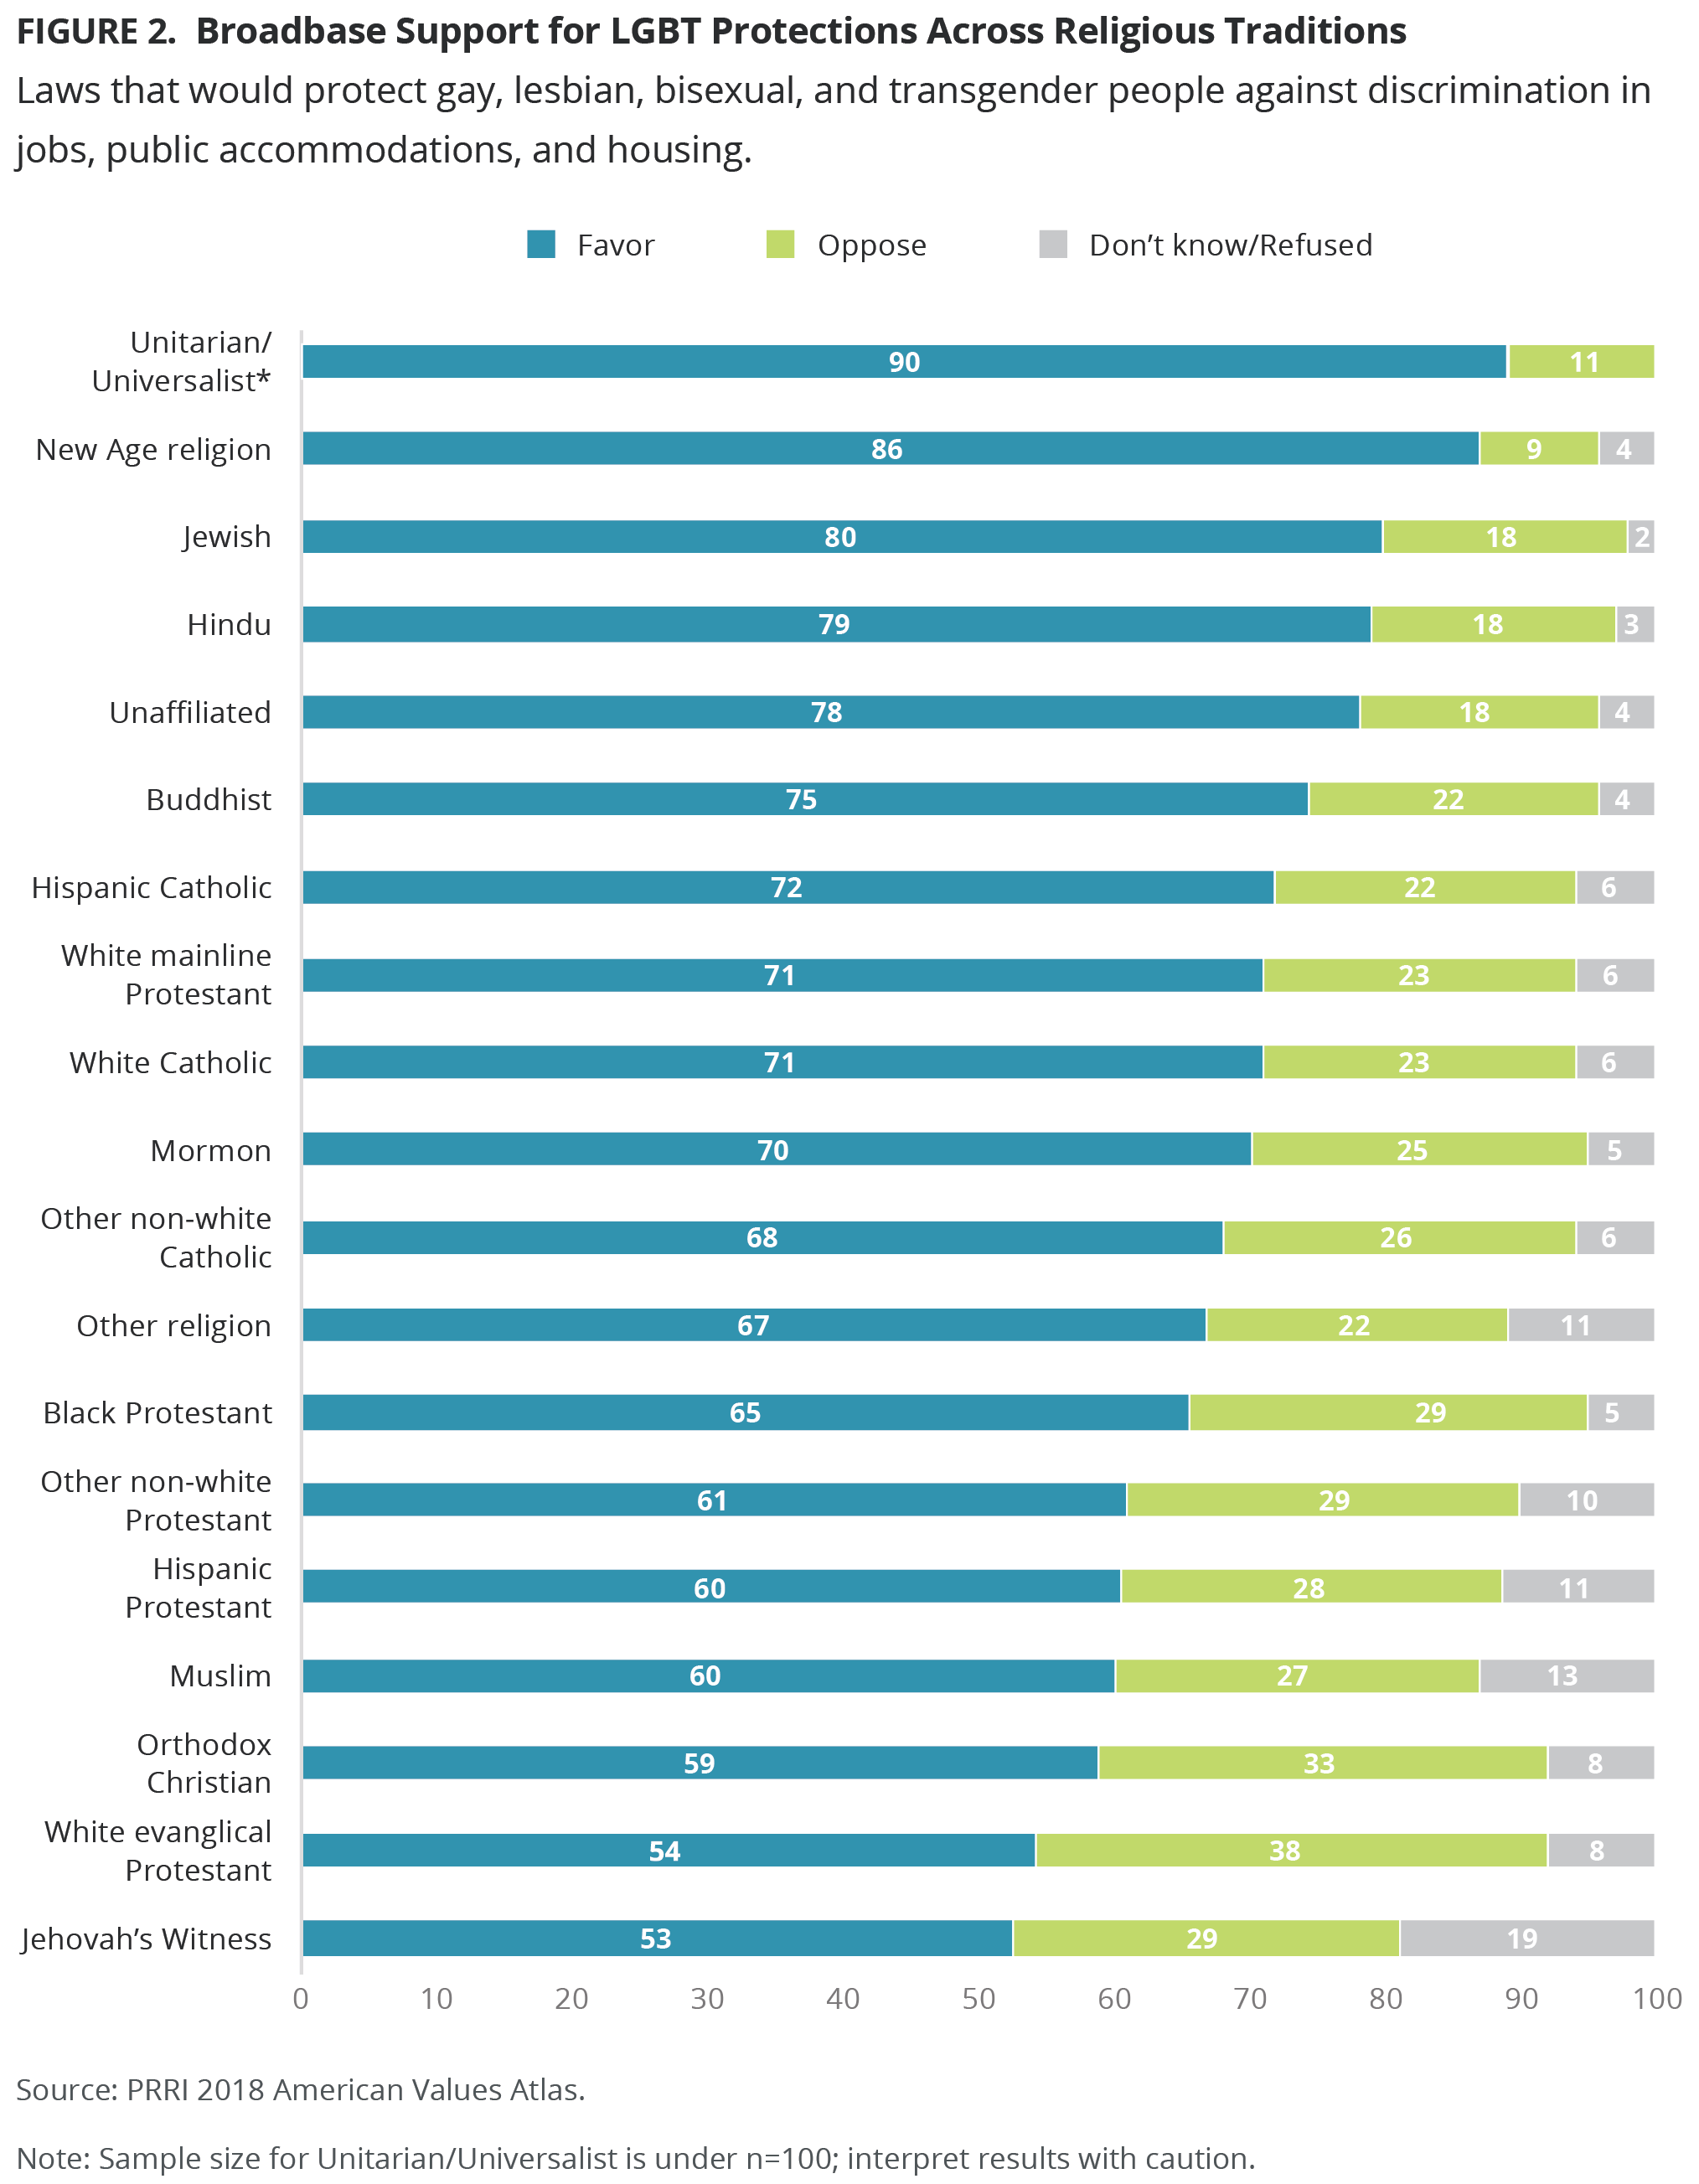
Solid majorities of all major religious groups in the U.S. support laws protecting LGBT people from discrimination in housing, public accommodations, and the workplace. More than three-quarters of Unitarian Universalists (90%)[3], Americans who identify with New Age religions (86%), Jews (80%), Hindus (79%), religiously unaffiliated Americans (78%), and Buddhists (75%) support these protections. Similarly, robust majorities of Mormons (70%), Hispanic Catholics (72%), white mainline Protestants (71%), white Catholics (71%), other non-white Catholics (68%), and Americans who identify with other religions (67%) favor LGBT nondiscrimination protections, along with majorities of black Protestants (65%), other non-white Protestants (61%), Muslims (60%), Hispanic Protestants (60%), and Orthodox Christians (59%).
White evangelical Protestants (54%) and Jehovah’s Witnesses (53%) are least likely to support LGBT nondiscrimination protections, but even among these groups support remains in majority territory.
Support among different religious traditions has remained relatively stable, with a few exceptions. Support for laws protecting LGBT people from discrimination has declined from 2015 levels among Buddhists (84%), Orthodox Christians (75%), Muslims (68%), and Hispanic Protestants (67%).
Selected Demographic Interactions
Age by Gender
Although majorities of Americans of all age groups support nondiscrimination protections for LGBT people, there is still a notable gender divide, with young women (81%) somewhat likelier than young men (71%) to support nondiscrimination protections for LGBT people. This age gap also appears to a lesser extent among seniors, with senior women (62%) being more likely than senior men (56%) to support the nondiscrimination protections.
Partisan Differences by Demographic Subgroups
Party by Ideology
Ideological differences are more pronounced among Democrats and independents than among Republicans. The biggest intra-party divide is among Democrats: Liberal Democrats (87%) are likelier than moderate (76%) and conservative (61%) Democrats to favor nondiscrimination laws protecting LGBT people. Liberal (79%) and moderate (78%) independents are also likelier than conservative independents (58%) to support nondiscrimination protections. But among Republicans, self-identified moderate Republicans (69%) are likelier than self-identified liberal Republicans (59%) and conservative Republicans (53%) to favor laws protecting LGBT people from discrimination. Notably, conservative Democrats (61%) are about as likely as liberal Republicans (59%) to favor nondiscrimination protections for LGBT people.
Party by Age
Across all partisan groups, there are double-digit point differences between young Americans (ages 18-29) and seniors (ages 65 and older). Nearly nine in ten (86%) younger Democrats favor passing laws that protect LGBT people from various types of discrimination, compared to nearly seven in ten (69%) older Democrats. 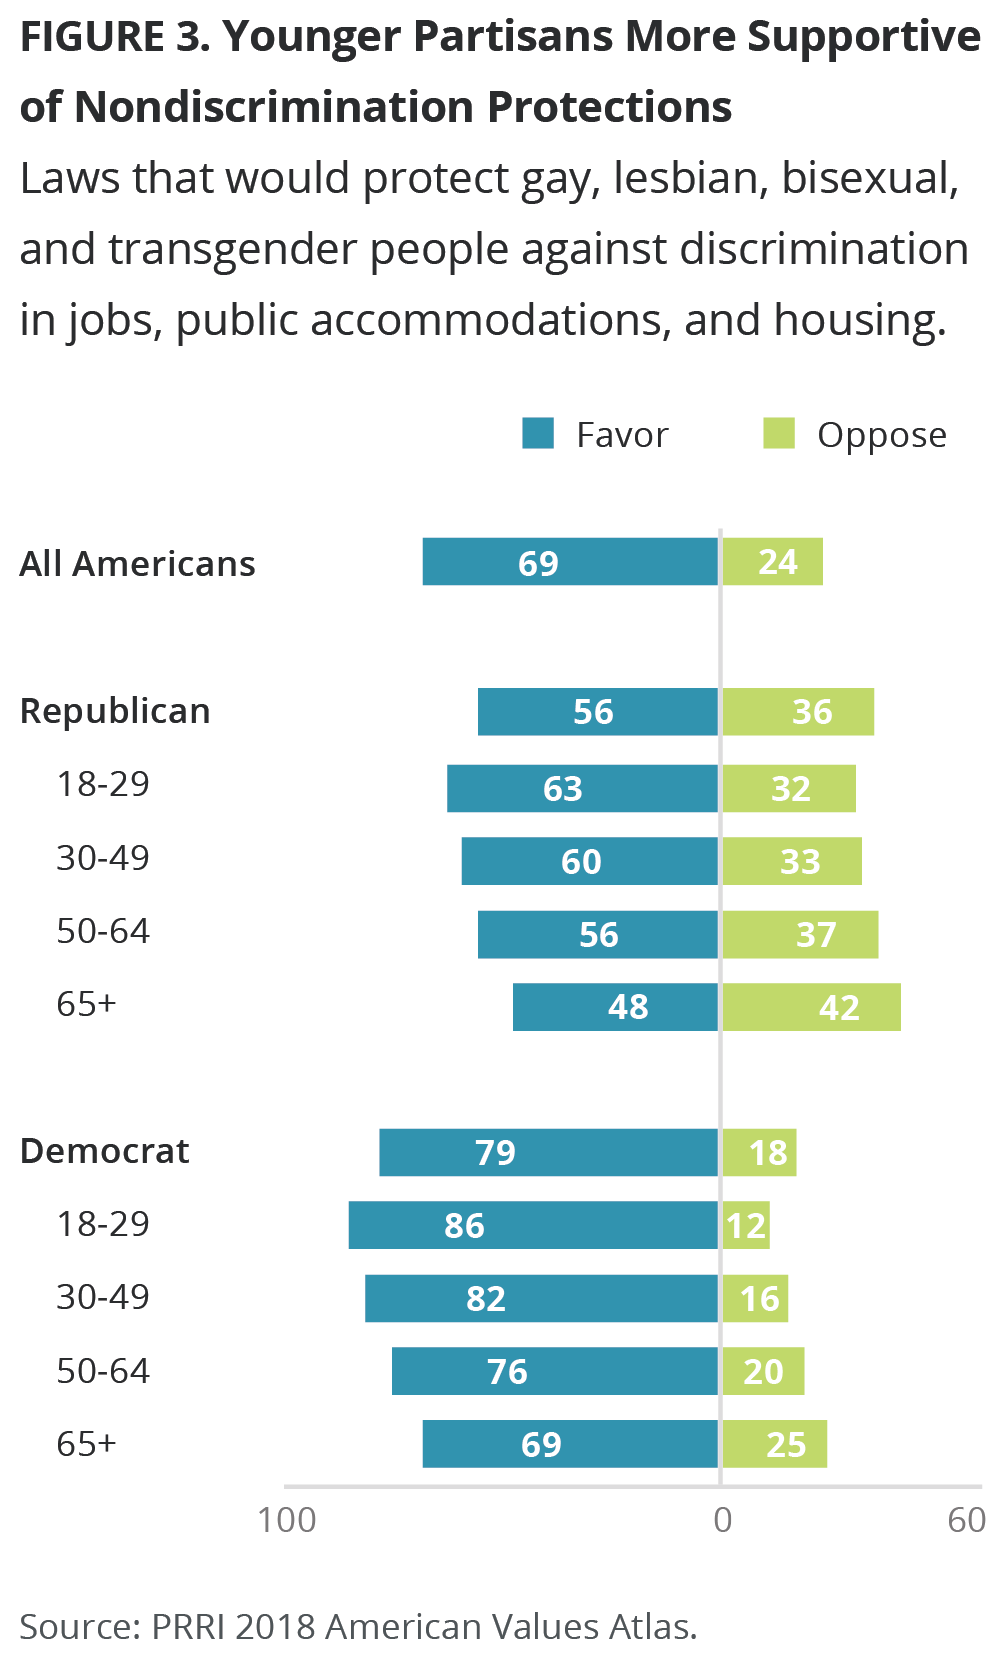 Similarly, three-quarters (75%) of younger independents support LGBT nondiscrimination provisions, compared to 61% of senior independents. And although more than six in ten (63%) younger Republicans support nondiscrimination protections for LGBT people, less than half (48%) of Republican seniors support such protections. Approximately four in ten (42%) of Republican seniors are opposed and 10% say they don’t know or refused to answer the question.
Party by Gender
In general, women of all political stripes are more likely than men within their party to support laws that protect LGBT people from various kinds of discrimination, although these differences are not large. Six in ten (60%) Republican women favor nondiscrimination protections for LGBT people, compared to a slimmer majority (52%) of Republican men. Similarly, independent women (74%) are somewhat likelier than independent men (67%) to support laws that protect LGBT people from discrimination, and Democratic women (80%) and men (75%) follow the same general pattern.
Party by Race, Ethnicity, and Education
There are some divisions by race within parties on support for nondiscrimination protections for LGBT people, with white Democrats and independents more supportive of such protections than their black or Hispanic co-partisans. These gaps are particularly notable among Democrats. More than eight in ten (84%) white Democrats favor nondiscrimination protections, compared to 77% of Hispanic Democrats, 68% of black Democrats, and 79% of Democrats who identify as mixed or other race. These intra-party differences are more muted among independents and Republicans. Seventy-two percent of white independents, 69% of Hispanic independents, 65% of black independents, and 72% of independents who identify as mixed or other race support laws that protect LGBT people from discrimination. Similarly, approximately six in ten Hispanic Republicans (58%), Republicans who identify as mixed or other race (57%), and white Republicans (56%), as well as 45% of black Republicans, all support nondiscrimination protections for LGBT people.
Support for the passage of LGBT discrimination protections also varies significantly among white Americans of different political affiliations, depending on their level of education. Although solid majorities of white Democrats favor LGBT nondiscrimination protections, support is higher among white Democrats with a postgraduate degree (93%) or four-year college degree (91%) than among white Democrats who attended some college (84%) or have a high school degree or less (72%).
There are similar divisions among white independents: 80% of white independents with a postgraduate degree, 78% of white independents with a college degree, and 73% of white independents who attended some college support LGBT nondiscrimination protections, compared to 64% of white independents who have a high school degree or less.
Educational gaps among white Republicans are less substantial. Majorities of white Republicans with a postgraduate degree (61%), college degree (59%), some college (56%), and those with a high school degree or less (52%) favor LGBT nondiscrimination protections.
Party by Evangelical Identification
Attitudes among evangelical Christians, both white and nonwhite, are highly structured by party affiliation. Less than half (47%) of white evangelicals who identify as Republicans support nondiscrimination protections for LGBT people, compared to 58% of white evangelical independents and 71% of white evangelical Democrats. A similar pattern exists among nonwhite evangelicals. Less than half (49%) of nonwhite evangelicals who identify as Republican favor LGBT nondiscrimination protections, compared to 62% who identify as independent and 62% who identify as Democrat.
Racial and Ethnic Differences by Demographic Subgroups
While majorities of all major racial and ethnic groups favor nondiscrimination protections for LGBT people, there are notable divisions within racial groups by age, gender, and education.
Race and Ethnicity by Age
Approximately three-quarters of young white Americans (78%), Hispanic Americans (74%), black Americans (73%), Asian-Pacific Islander Americans (76%), and Americans who identify as mixed or other race (74%) favor LGBT nondiscrimination protections, compared to around six in ten senior white Americans (60%), Hispanic Americans (59%), Asian-Pacific Islander Americans (63%), and Americans who are mixed race or another race (60%). Support among senior black Americans (54%) is lower but still in majority territory.
Race and Ethnicity by Gender
Across racial and ethnic groups, women are also generally likelier than men to support LGBT nondiscrimination protections, although gender differences are most pronounced among black and white Americans. About three-quarters (73%) of white women favor nondiscrimination laws protecting LGBT Americans, compared to 64% of white men. Similarly, about seven in ten (69%) black women favor nondiscrimination protections for LGBT people, compared to 60% of black men. Gender divisions are smaller among Hispanic women and men (72% vs. 66%) and are not significant between Asian-Pacific Islander American women and men (74% vs. 71%). However, the divide is notably large among women and men who identify as mixed race or another race (77% vs. 63%).
Race and Ethnicity by Educational Attainment
Overall, Americans with higher levels of education are more likely to support laws protecting LGBT people from discrimination in housing, public accommodations, and jobs. These general patterns hold true across most racial groups. White Americans with a college degree are more likely than white Americans without a college degree to support nondiscrimination protections for LGBT people (77% vs. 65%). The same is true of black Americans (76% vs. 62%), and mixed-race Americans (78% vs. 67%). Divisions between those with a college degree and those without a college degree are not as pronounced among Hispanic Americans (75% vs. 69%) or Native Americans (60% vs. 62%).
Religious Differences by Demographic Subgroups
Majorities of all religious groups support laws protecting LGBT people from discrimination in jobs, housing, and public accommodations.
Religious Affiliation by Age
Younger members of most religious groups are likelier than their older co-religionists to support nondiscrimination protections for LGBT Americans, but the divisions are particularly pronounced among a few groups. A substantial majority (63%) of young white evangelical Protestants (ages 18-29) favor LGBT nondiscrimination protections, compared to less than half (45%) of white evangelical Protestant seniors (ages 65 and older). Nearly as many (44%) white evangelical Protestant seniors oppose such protections, while 10% offer no opinion. There is a similar age gap between younger black Protestants and black Protestant seniors (75% vs. 55%).
A similar, but slightly less prominent pattern exists between younger and older white mainline Protestants (74% vs. 66%), younger and older white Catholics (80% vs. 64%), younger and older Hispanic Catholics (75% vs. 64%), and younger and older religiously unaffiliated Americans (82% vs. 69%).
Religious Affiliation by Party
Within every major religion, Republicans are much less likely than Democrats to support nondiscrimination protections for LGBT people. Just under half of Republican white evangelical Protestants (47%) favor LGBT nondiscrimination protections, compared to over seven in ten (71%) Democratic white evangelical protestants. The divide between Republicans and Democrats is also notable among Jews (64% vs. 89%), white Catholics (61% vs. 82%), white mainline Protestants (62% vs. 82%), black Protestants (47% vs. 67%), religiously unaffiliated Americans (60% vs. 87%), and Hispanic Protestants (53% vs. 67%). There is a smaller divide between Republicans and Democrats on the issue of nondiscrimination protections for LGBT people among Hispanic Catholics (66% vs. 77%).
Geographical Differences
Regions
Overall, there are few differences in support for LGBT nondiscrimination protections across the major regions of the country, although residents of the Northeast (72%) and West (72%) are likelier than residents of the South (65%) to favor nondiscrimination protections for LGBT people, while residents of the Midwest (68%) fall in between. Support for nondiscrimination laws has declined slightly in the Northeast, the West, and the Midwest since 2015 (76%, 75%, and 71%).
States
Majorities of residents of all states support nondiscrimination protections for LGBT Americans. New England states express the most robust support for laws designed to protect LGBT people from discrimination.
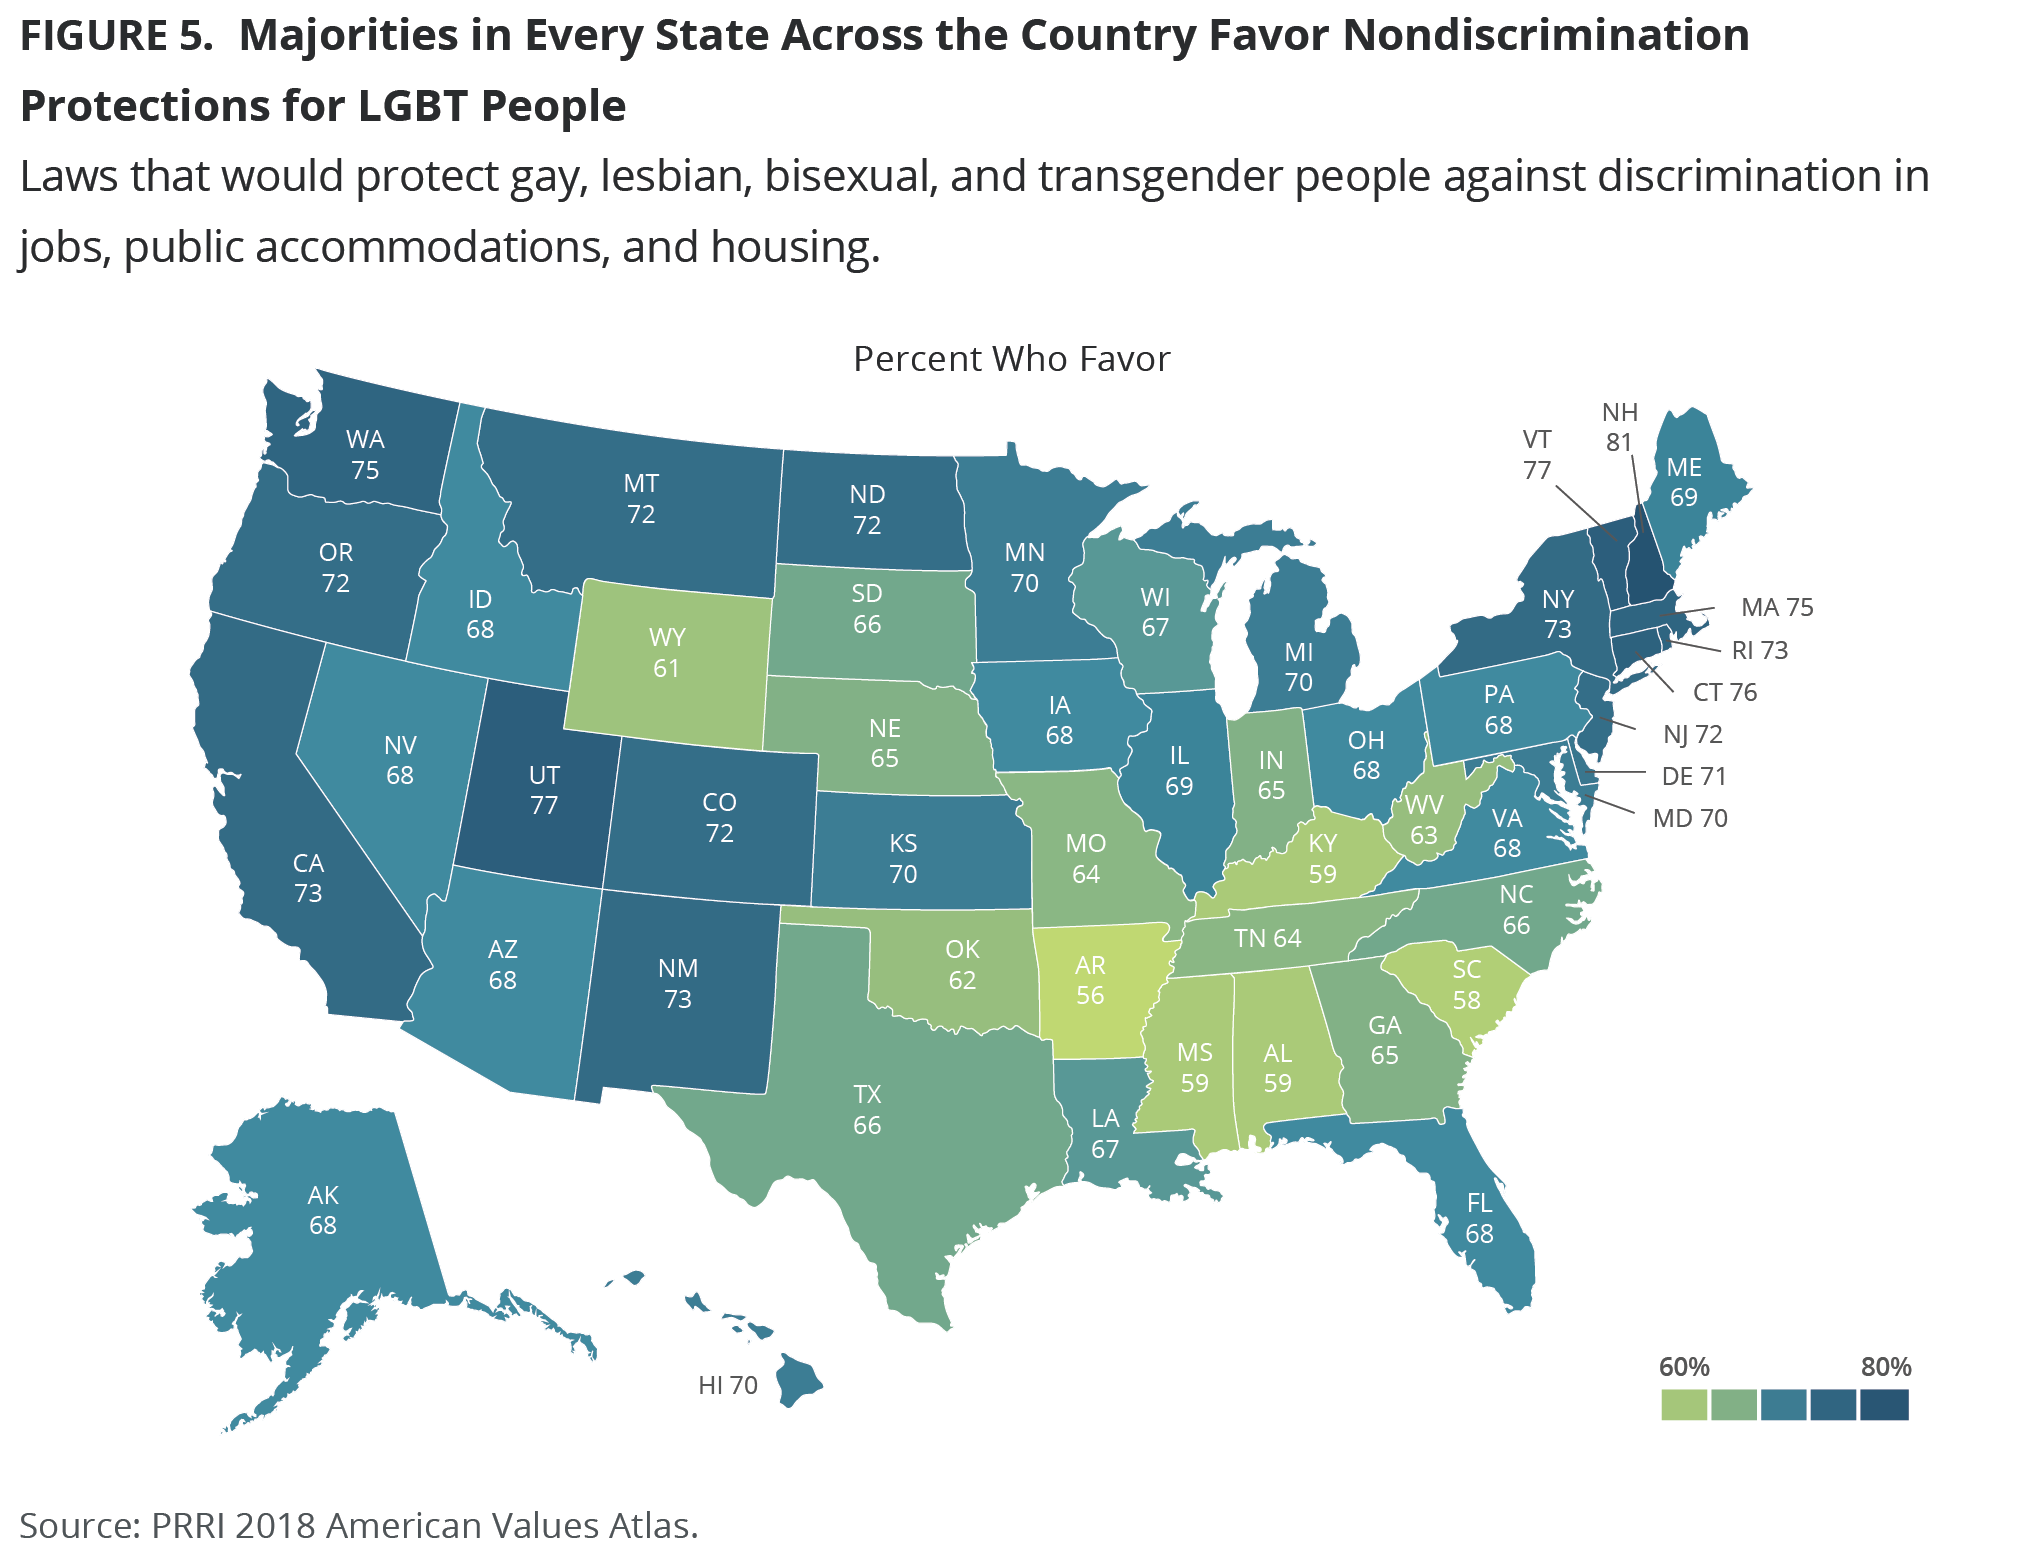
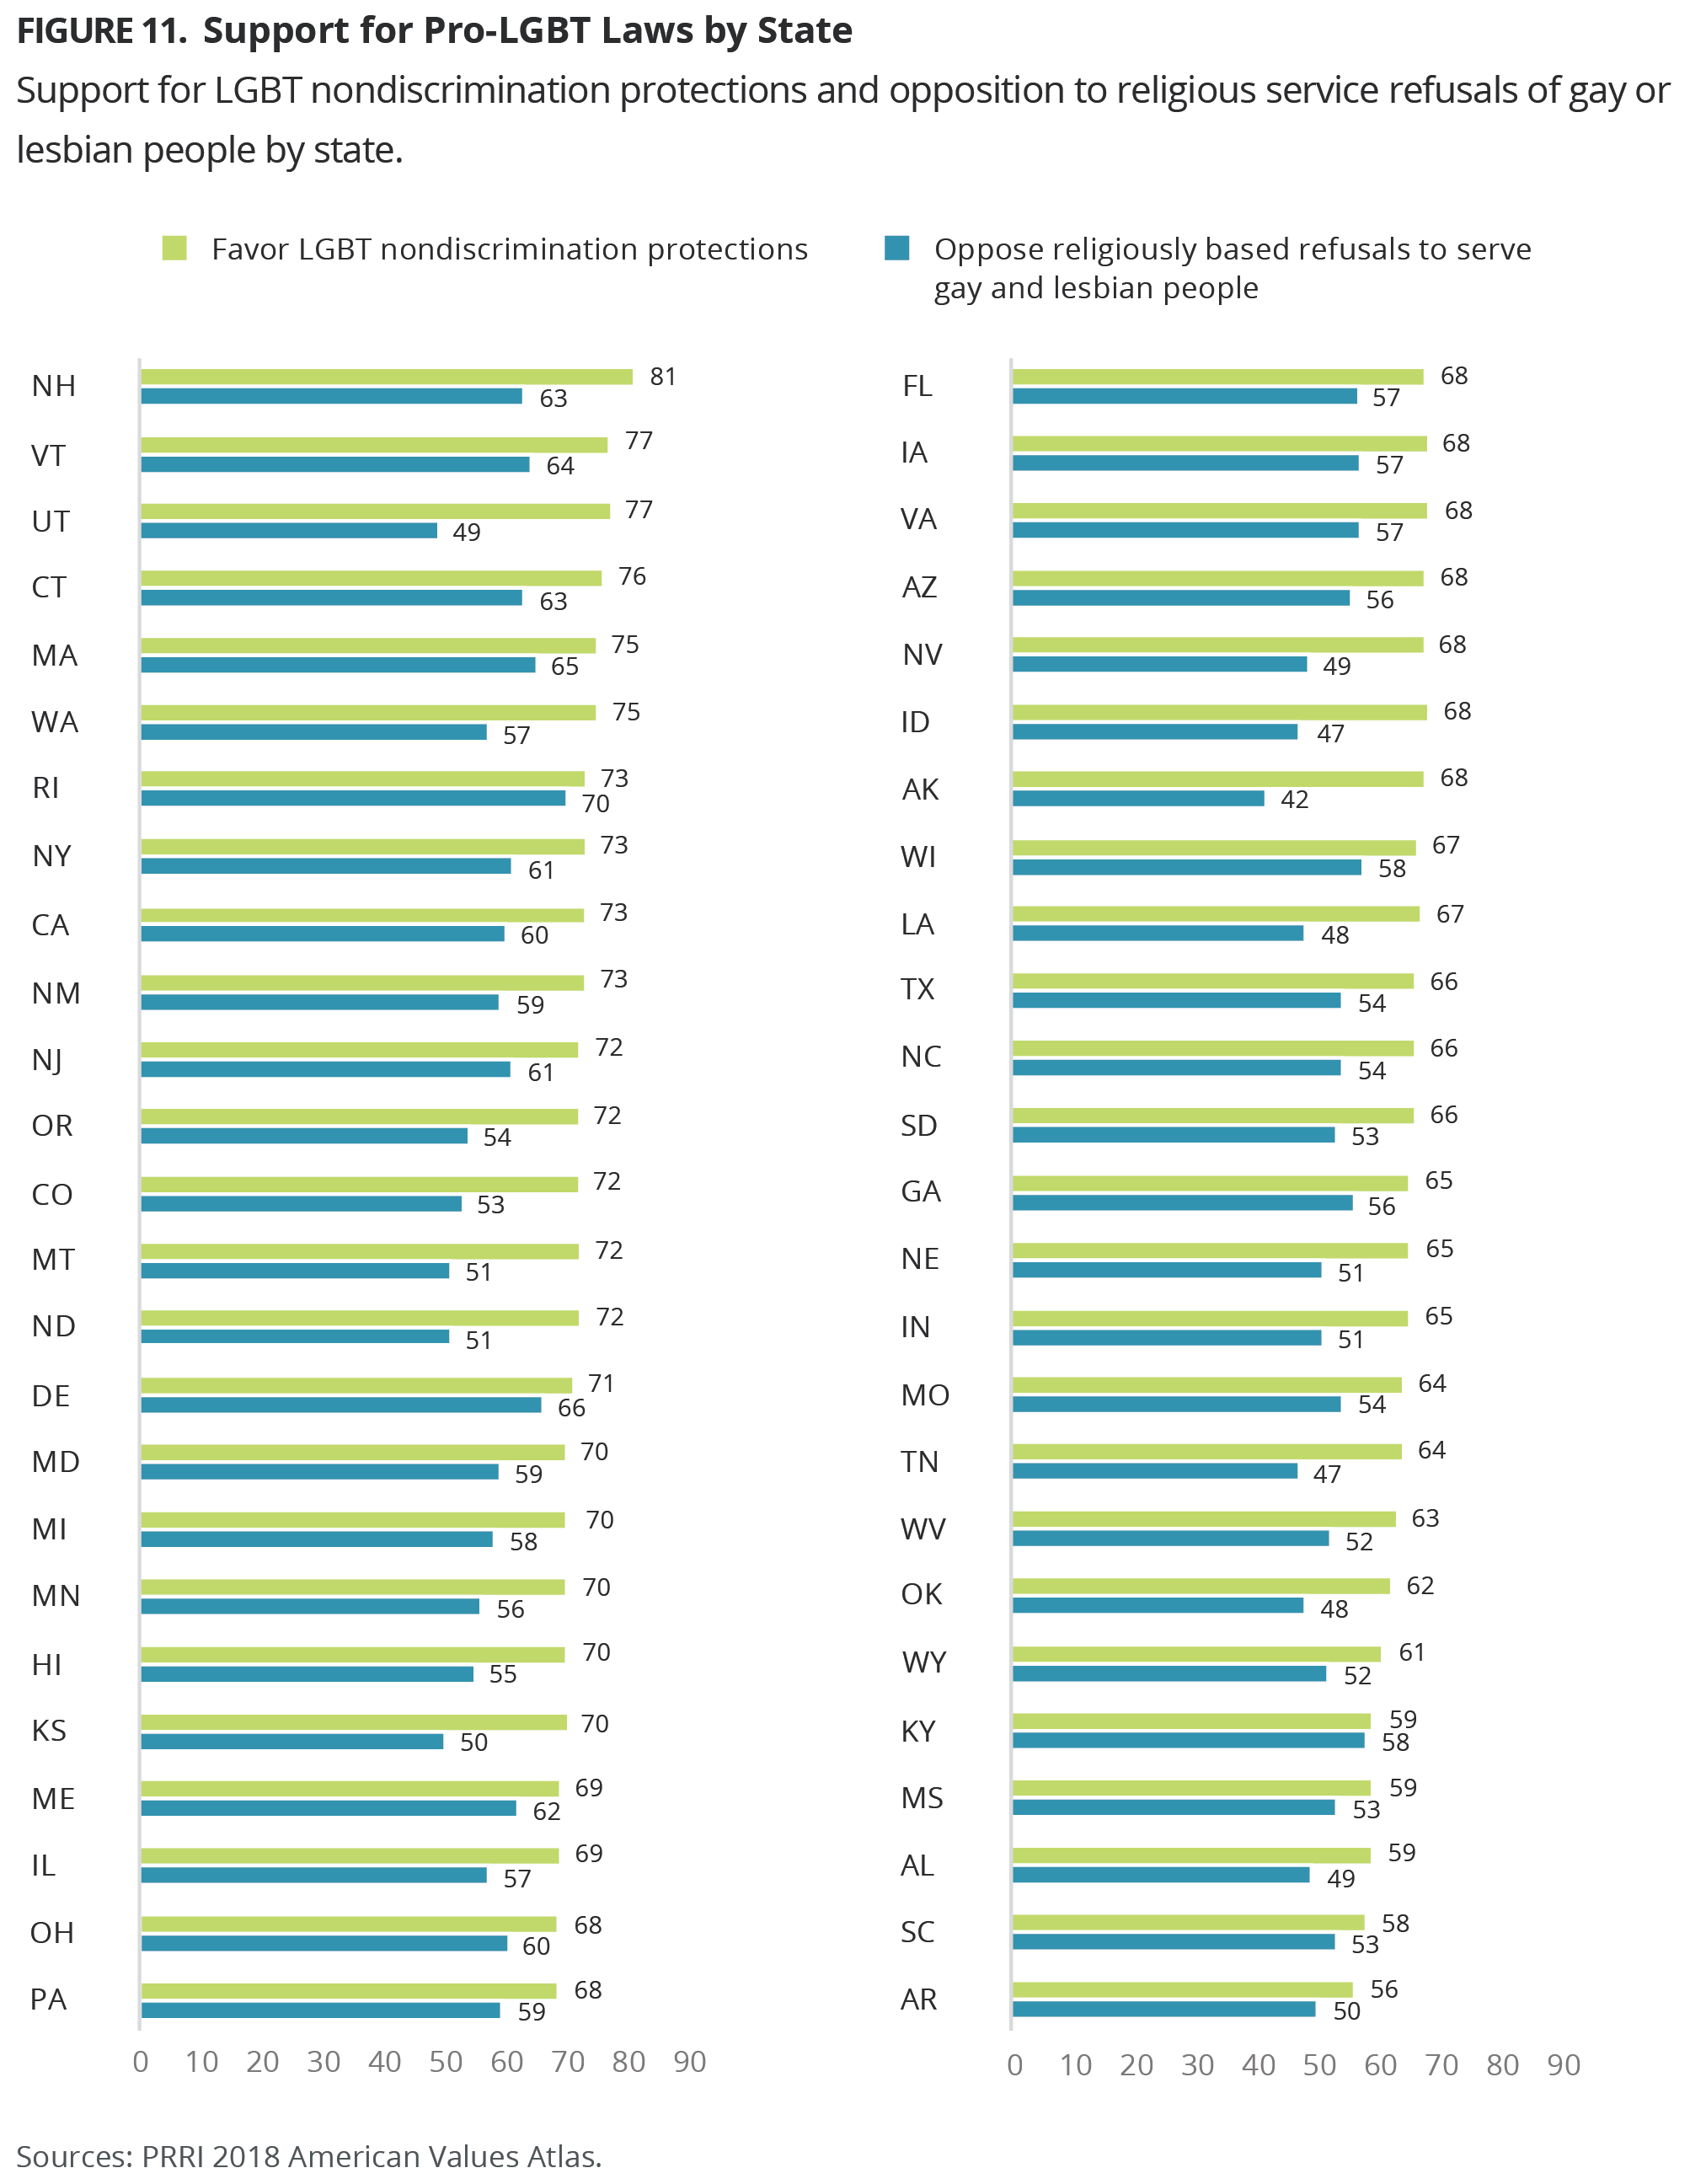
About three-quarters of the residents of New Hampshire (81%), Vermont (77%), Connecticut (76%), Massachusetts (75%), and Rhode Island (73%) favor nondiscrimination protections for LGBT Americans. States in the West also demonstrate high levels of support for nondiscrimination protections for LGBT individuals. More than seven in ten residents of several Western states—including Washington (75%), California (73%), New Mexico (73%), Colorado (72%), and Oregon (72%)—favor laws that would protect LGBT Americans from discrimination. Conversely, states with the lowest levels of support are primarily located in the South, where about six in ten residents of West Virginia (63%), Oklahoma (62%), Mississippi (59%), Kentucky (59%), Alabama (59%), South Carolina (58%), and Arkansas (56%), say LGBT people should be legally protected from discrimination. A few highly-supportive states like Massachusetts, Rhode Island, and Illinois have become slightly less supportive of nondiscrimination protections for LGBT people since 2015 (83%, 83%, and 75%, respectively).
Metropolitan Areas
Similar to larger geographic regions, majorities of residents of all major metropolitan areas favor laws protecting LGBT Americans from various forms of discrimination. There are few sizeable differences among metropolitan areas, but cities with the greatest support for such protections tend to be clustered in the Northeast or the West. Notably, Salt Lake City tops the list of most supportive metropolitan areas, with 84% of residents supporting LGBT nondiscrimination protections. At least three-quarters of the residents of Seattle (78%), Austin (77%), San Jose (77%), Washington DC (76%), Boston (75%), San Francisco (75%), and Portland (75%) metropolitan areas support nondiscrimination protections for LGBT people. By contrast, the cities with lower levels of support relative to other major metropolitan areas are in the South or in Texas, but even in those cities, support is at least six in ten. More than six in ten residents of Atlanta (68%), Orlando (68%), Houston (66%), Nashville (66%), Tampa (65%), Charlotte (65%), San Antonio (65%), Raleigh (64%), Jacksonville (63%), Knoxville (61%), and Birmingham (61%) support LGBT nondiscrimination protections.
From 2015 to 2018, a number of cities have seen a decline in support for nondiscrimination laws to protect LGBT people, including Providence (85% to 70%), Boston (83% to 75%), San Francisco (81% to 75%), Chicago (77% to 71%), Raleigh (76% to 64%), and Tampa (73% to 65%).
Part Two: Religiously Based Service Refusals for LGBT People
Overview and Recent Trends: 2015-2018
In 2018, approximately six in ten (57%) Americans oppose allowing a small business owner in their state to refuse products or services to gay or lesbian people if providing them would violate their religious beliefs. About one in three (36%) Americans support such a policy, and 7% offer no opinion.
Over the last few years, there has been modest fluctuation in attitudes, with slightly higher opposition to religiously based refusals to serve gay and lesbian people recorded in 2016 (61%) and 2017 (60%). Attitudes in 2018 look similar to 2015, when 59% of Americans opposed allowing business owners to refuse products or services to gay and lesbian people for religious reasons.[4]
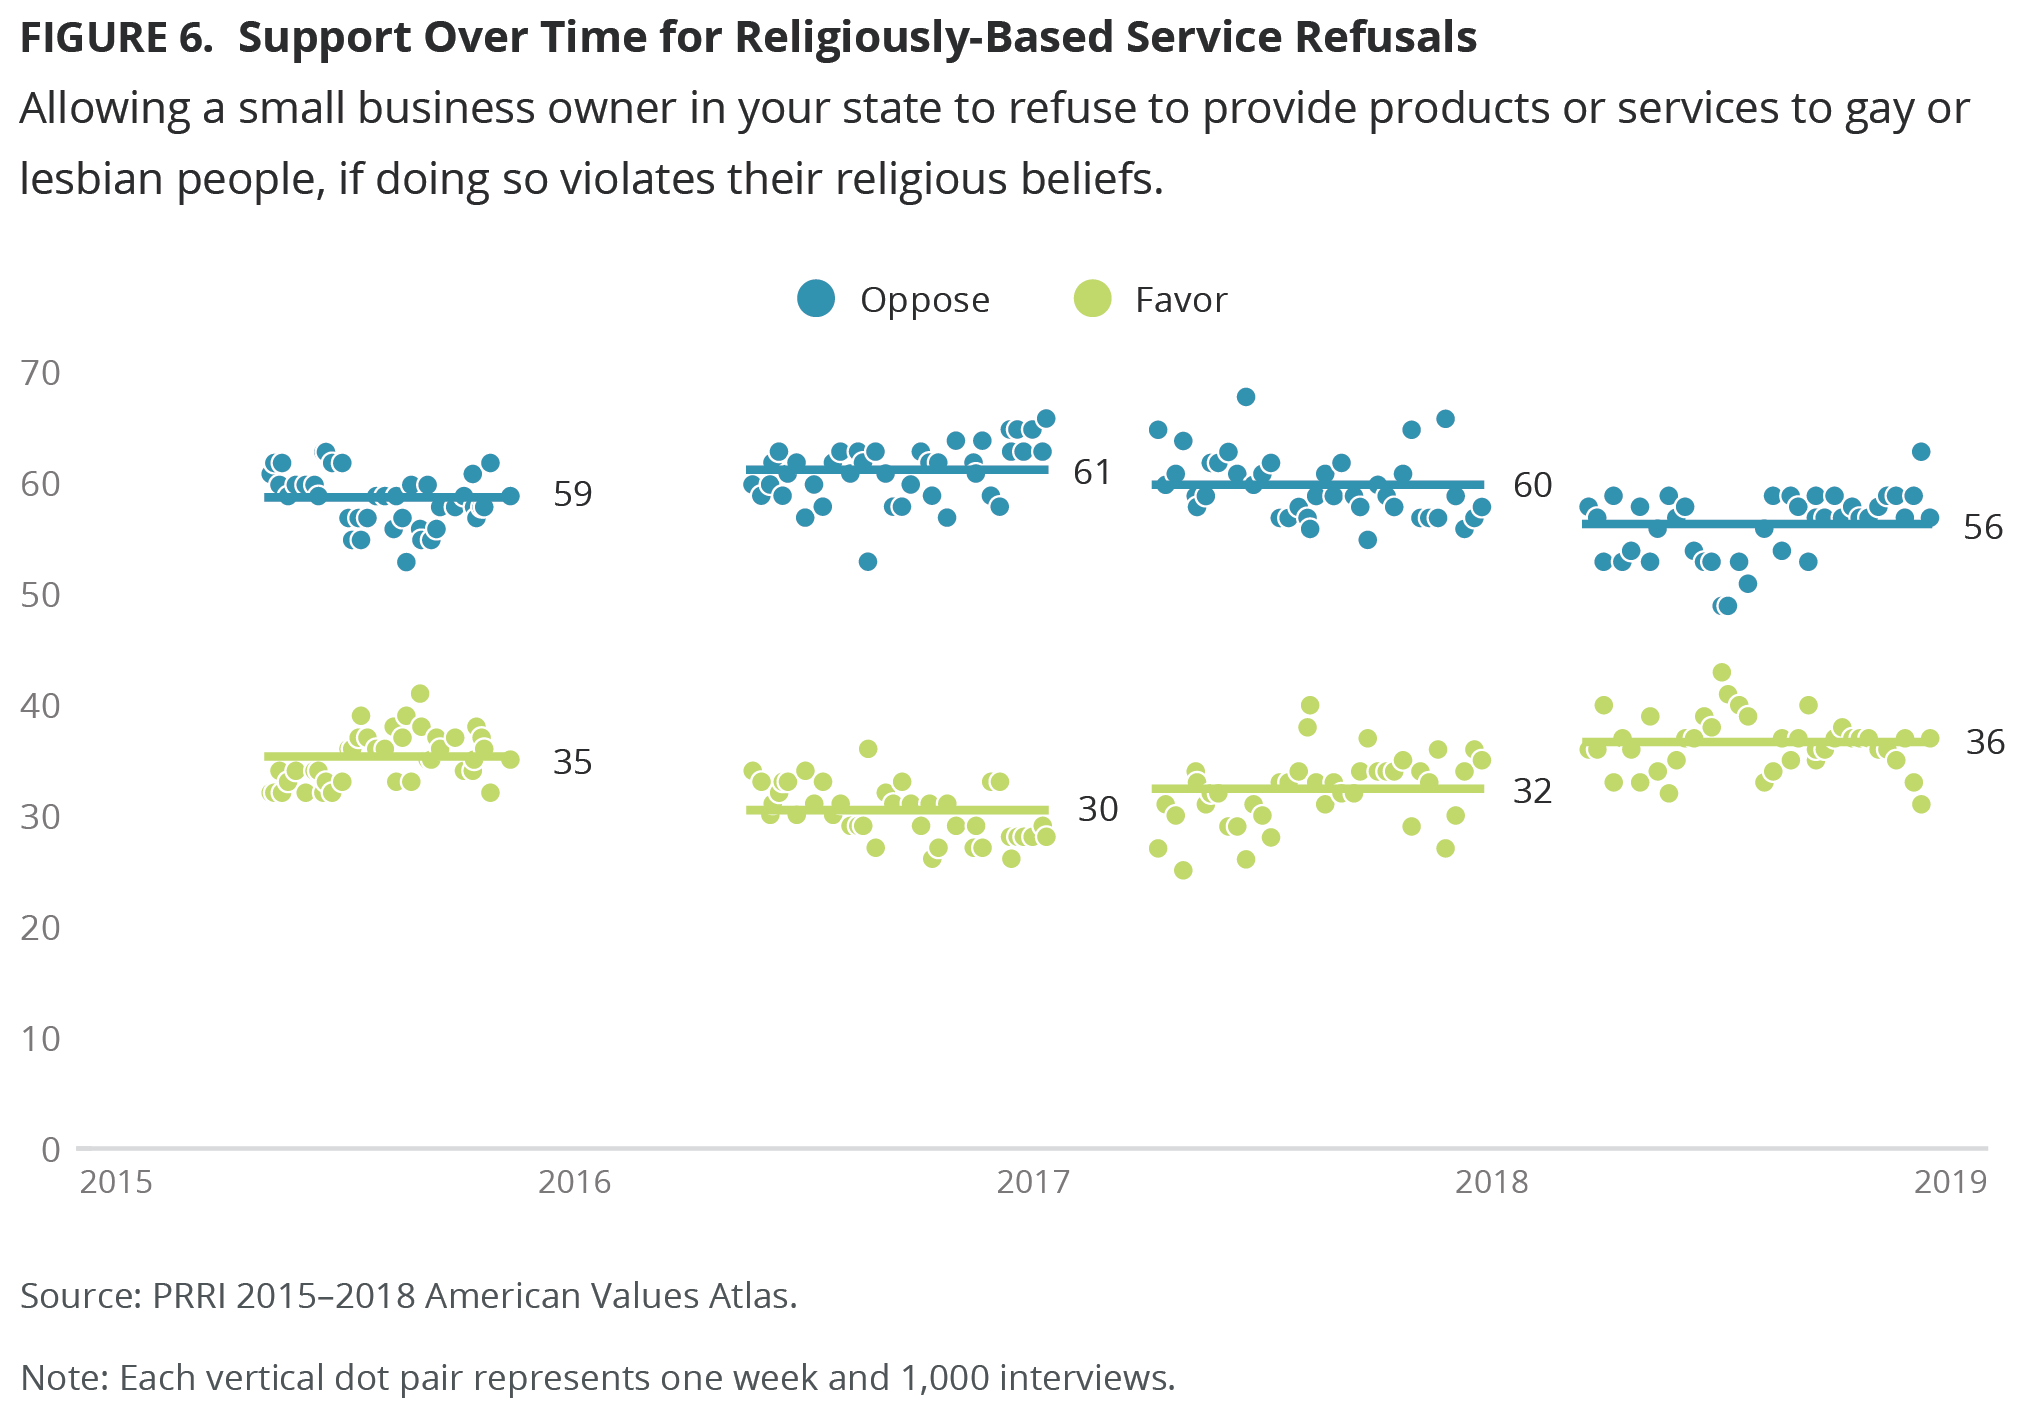
Attitudes in 2018 showed greater fluctuation throughout the year than in previous years. Across the 40 weeks in the field in 2018, the pattern of opposition to religiously based service refusals was roughly U-shaped, with higher opposition recorded in March through May, lower opposition recorded in June and July, then higher opposition rebounding in August through the end of the year. While determining causality between events in the news and public opinion is notoriously difficult, it is notable that the dip in opposition occurred roughly during the two months following the highly publicized U.S. Supreme Court decision on June 4th in Masterpiece Cakeshop, Ltd. v. Colorado Civil Rights Commission, in which a Colorado bakery owner claimed he had a right to refuse to bake a cake for a gay couple based on his own personal religious objections.
Examining shifts among subgroups from the high point of support in 2016 to the low point of support in 2018 does not reveal a discernible pattern. Opposition to religiously based service refusals of gay and lesbian people has declined modestly across virtually every demographic from 2016 to 2018. For example, some of the most notable declines in opposition include more strongly opposed groups such as the religiously unaffiliated (74% to 66%), Americans with postgraduate degrees (68% to 60%), and white mainline Protestants (62% to 54%). However, there are also notable declines in opposition among more divided groups such as Mormons (52% to 40%) and white evangelical Protestants (42% to 37%).
Demographic Differences
There is a modest generational gap on the issue of religiously based refusals to serve gay and lesbian people. Younger Americans (ages 18-29) are more likely than seniors (ages 65 and older) to oppose religiously based refusals to gay and lesbian people (63% vs. 52%).
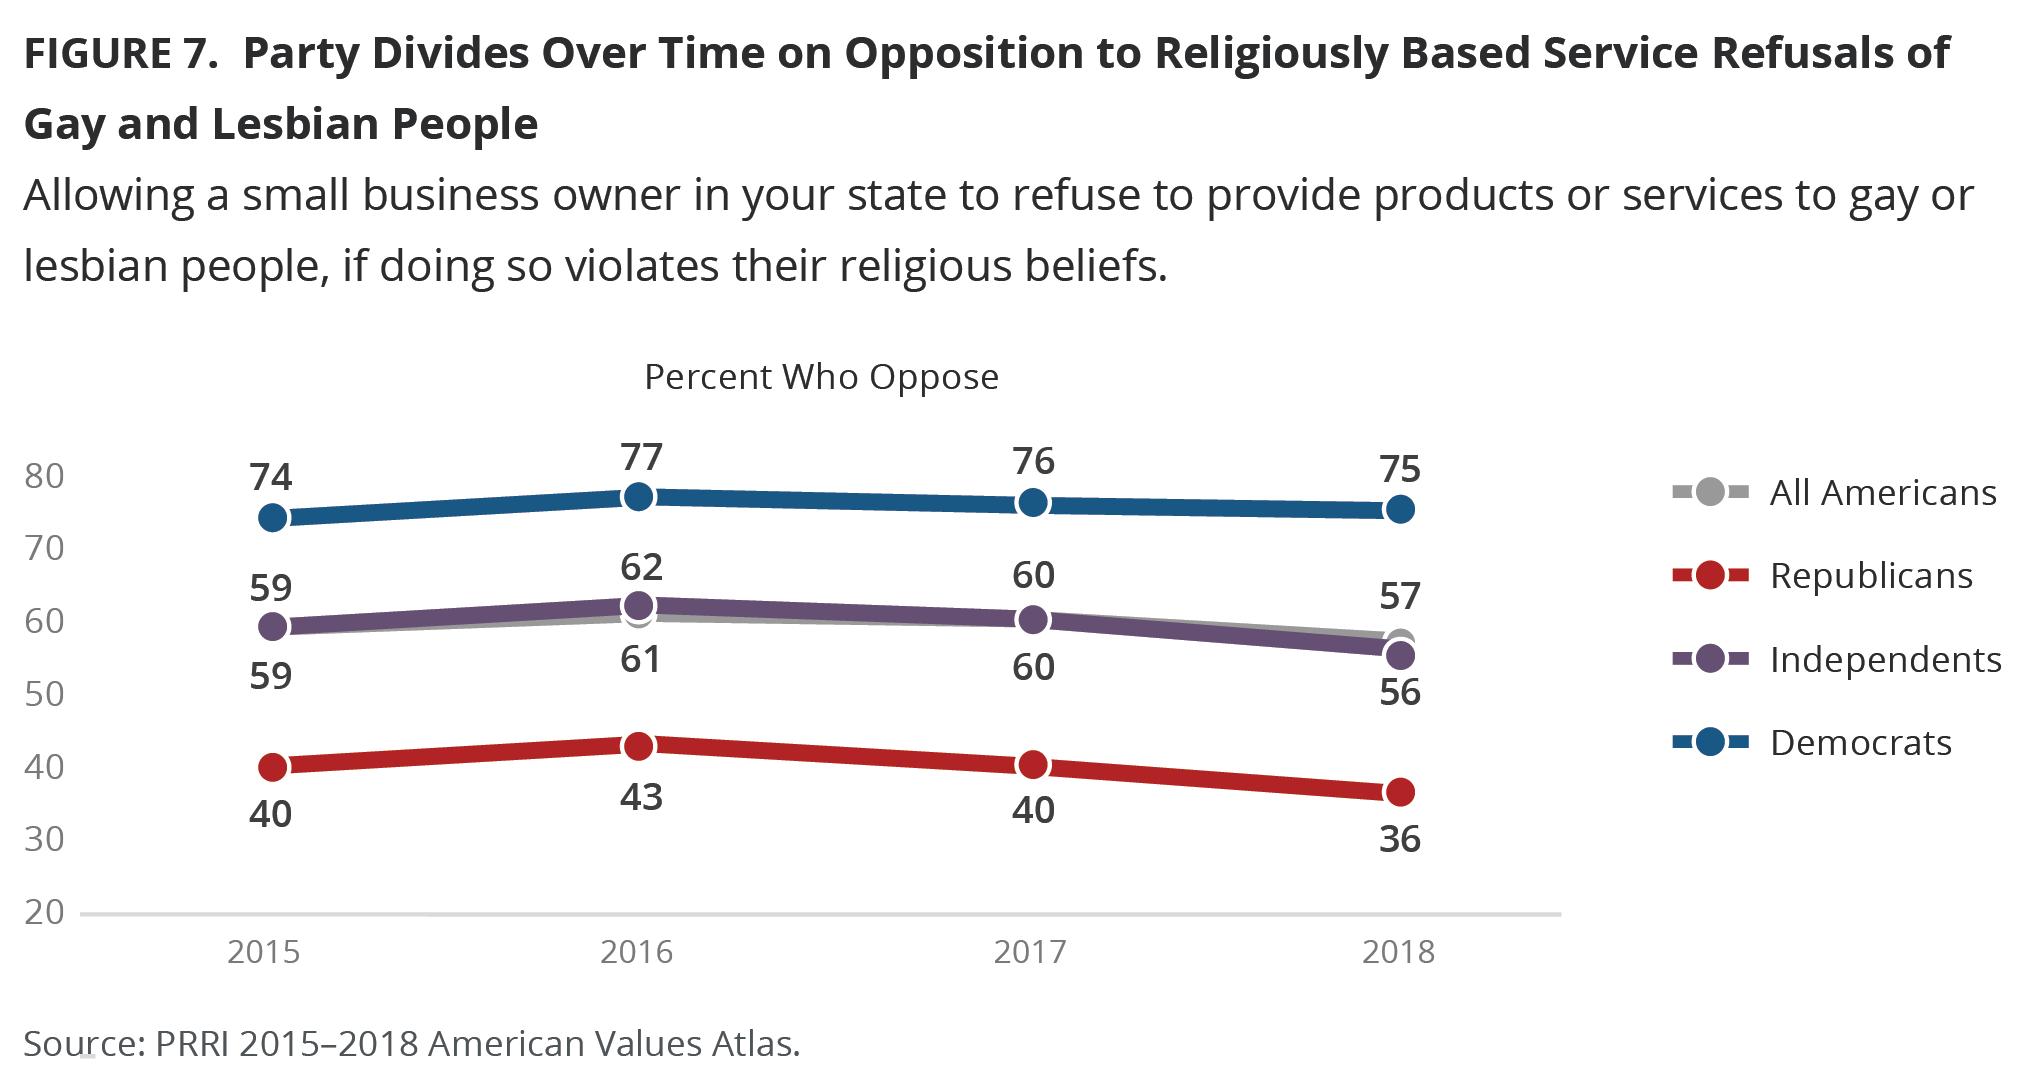
Support for religiously based service refusals varies dramatically by political affiliation. Three-quarters of Democrats (75%) and a majority of independents (56%) oppose religiously based refusals to serve gay and lesbian people, compared to 36% of independents and 20% of Democrats who support such a policy. Perspectives on religiously based service refusals have remained mostly constant among Democrats and independents since 2015 when 74% of Democrats and 59% of independents opposed religiously based service refusals.
By contrast, only 36% of Republicans oppose allowing small business owners to refuse service to gay and lesbian people based on their religious beliefs, compared to nearly six in ten (59%) who support such a policy. Notably, support for religiously based service refusals has risen modestly among Republicans since 2015, when 55% of Republicans favored allowing such refusals and 40% opposed them.
Majorities of Americans of all racial and ethnic groups oppose religiously based service refusals. Black Americans (66%) are likeliest to oppose allowing small business owners to refuse service to gay and lesbian people based on their religious beliefs, followed by Hispanic Americans (60%), Asian-Pacific Islander Americans (59%), people who are mixed race or another race (58%), white Americans (54%), and Native Americans (52%).
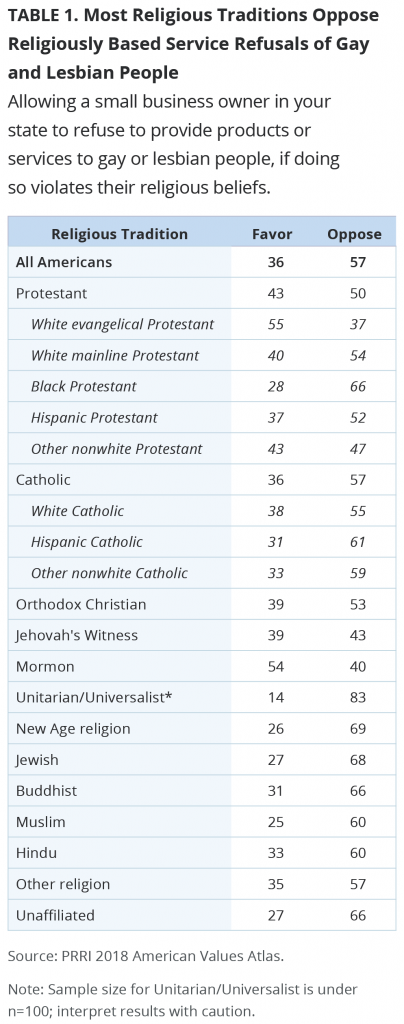
Majorities of most major religious groups oppose religiously based service refusals, including 54% of white mainline Protestants, 66% of black Protestants, 52% of Hispanic Protestants, 55% of white Catholics, 61% of Hispanic Catholics, 59% of other non-white Catholics, 53% of Orthodox Christians, 68% of Jews, 60% of Muslims, 66% of Buddhists, 60% of Hindus, 66% of religiously unaffiliated Americans, 83% of Unitarian Universalists[5], 69% of Americans who identify with New Age religions, and 57% of Americans who identify with other religions.
White evangelical Protestants (55%) and Mormons (54%) stand out as the only religious groups where a majority supports allowing small business owners to refuse to serve gay and lesbian customers if doing so violates their religious beliefs; only 37% of white evangelicals and 40% of Mormons oppose this policy. Jehovah’s Witnesses are divided: a plurality (43%) are opposed to religiously based service refusals, while 39% favor them and 18% offer no opinion. Other non-white Protestants are also divided: a plurality (47%) are opposed, 43% are in favor, and nine percent refused to answer the question.
Selected Demographic Interactions
Partisan Differences by Demographic Subgroups
Party by Ideology
There are substantial divisions by ideology among Republicans, with conservative Republicans exhibiting the most support for religiously based refusals to serve gay and lesbian people. Nearly two-thirds (65%) conservative Republicans support allowing small business owners to refuse service to gay and 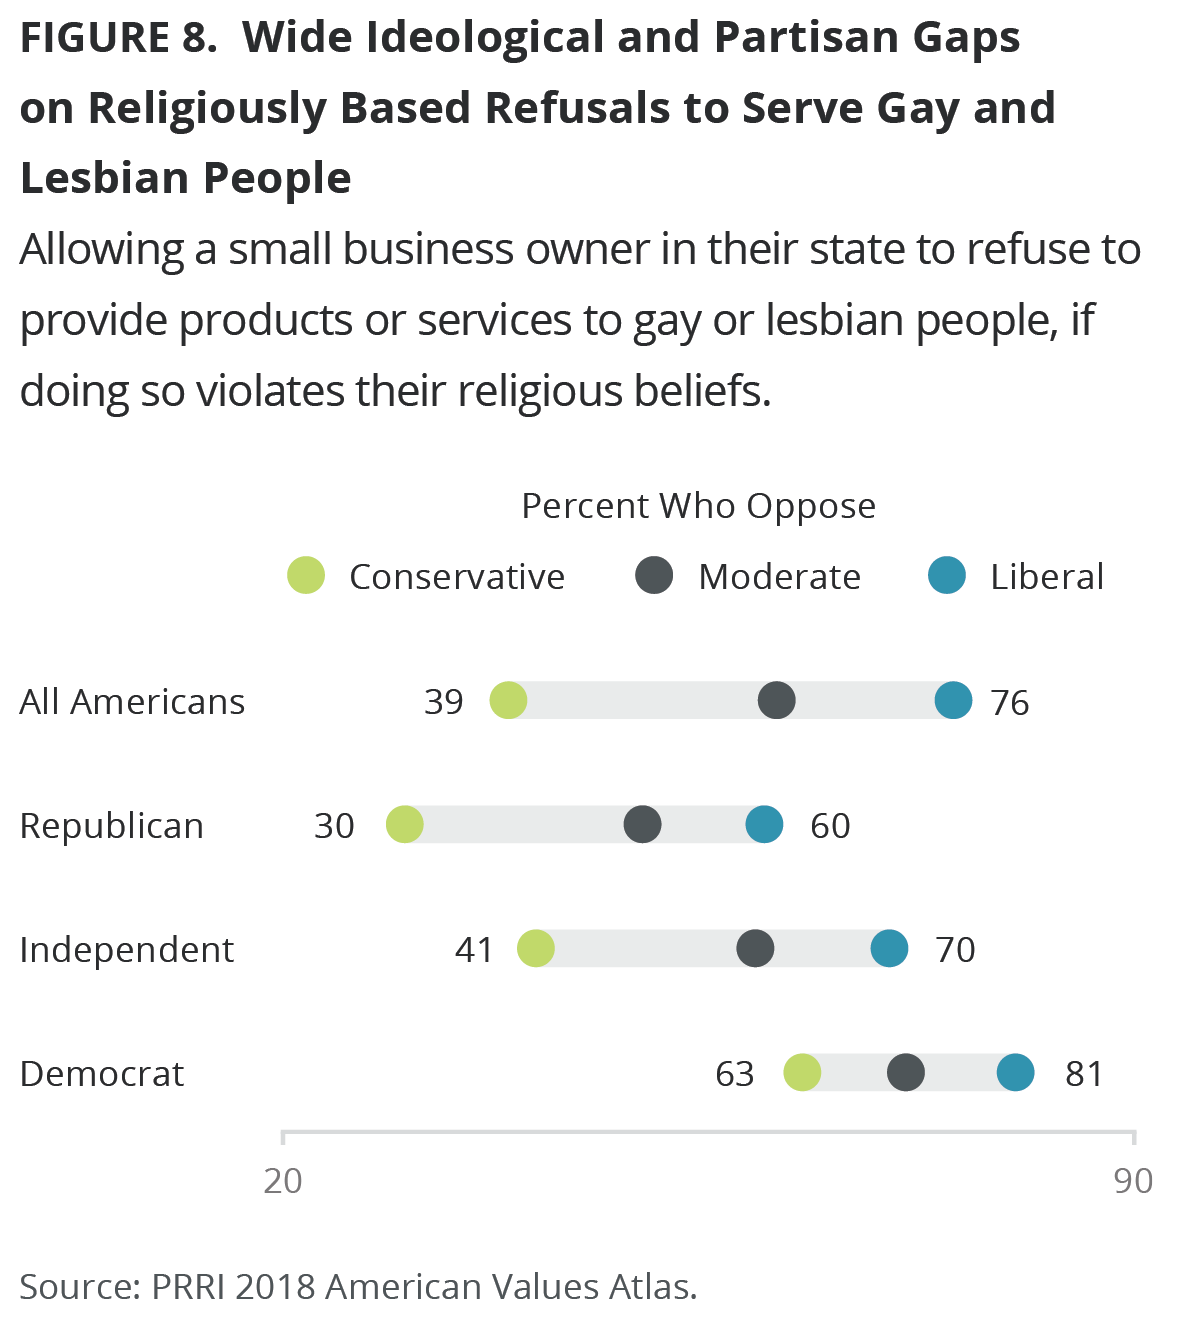 lesbian people based on their religious beliefs, compared to 44% of moderate Republicans and 35% of liberal Republicans. Half (50%) of moderate Republicans and six in ten (60%) liberal Republicans oppose religiously based refusals to serve gay and lesbian people.
A similarly stark ideological divide exists among independents. A slim majority (51%) of conservative independents support religiously based service refusals. However, nearly six in ten (59%) moderate independents and seven in ten (70%) liberal independents are opposed.
Democrats are more unified in their opposition to religiously based service refusals, but there are some noteworthy variations in intensity. About six in ten (63%) conservative Democrats, seven in ten (72%) moderate Democrats, and eight in ten (81%) liberal Democrats oppose religiously based service refusals. Notably, a majority (52%) of liberal Democrats strongly oppose such refusals.
Party by Age
Consistent with age divisions on other questions related to LGBT issues, younger Democrats (79%), younger independents (61%), and younger Republicans (43%) are somewhat more likely than senior Democrats (70%), independents (50%), and Republicans (33%) to oppose religiously based service refusals.
Party by Gender
Independent women (61%) are more likely than independent men (51%) to oppose allowing small business owners to refuse service to gay or lesbian people based on their religious beliefs. Though Republicans are less likely to be opposed, there is a similarly sized gap between Republican women (40%) and Republican men (31%) in their opposition to allowing religiously based service refusals. However, there are few divisions between Democratic men and women on the issue of religiously based service refusals.
Party by Race, Ethnicity, and Education
Compared to their white co-partisans, nonwhite Republicans and independents are more likely to oppose religiously based refusals to serve gay and lesbian people. White Republicans (60%) are likelier than black (45%) or Hispanic (48%) Republicans to favor religiously based service refusals. Similarly, white (39%) independents are likelier than black (31%) or Hispanic (31%) independents to support such refusals. Interestingly, the pattern is reversed among Democrats. White Democrats (79%) are more likely than black (71%) or Hispanic (69%) Democrats to oppose religiously based service refusals.
Notably, educational attainment cuts in opposite directions among white Republicans and Democrats. White Democrats display a more typical pattern of higher education correlating with higher support for LGBT rights. White Democrats with a higher level of educational attainment are more likely to oppose religiously based refusals to serve gay and lesbian people: 84% of Democrats with a postgraduate degree are opposed, compared to 72% of Democrats with a high school degree or less. By contrast, educational attainment works in the opposite direction among white Republicans. White Republicans with a higher level of educational attainment are actually more likely than less-educated white Republicans to support religiously based service refusals. Two-thirds (66%) of white Republicans with a postgraduate degree favor such refusals, compared to 55% of white Republicans with a high school degree or less. Only 29% of white Republicans with a postgraduate degree oppose religiously based service refusals, compared to 39% of white Republicans who have only a high school degree or less.
Party by Evangelical Identification
White evangelicals’ perspectives on religiously based service refusals also vary depending on their political affiliation, as do the perspectives of nonwhite evangelicals. White evangelicals are much likelier to identify as Republican (49%) or independent (32%) than Democrat (12%), while nonwhite evangelicals are likelier to identify as Democrat (46%) or independent (34%), rather than Republican (14%).
Not surprisingly, two-thirds (67%) of white evangelical Republicans support religiously based refusals to serve gay and lesbian people. However, only a slim majority (51%) of white evangelical independents and 27% of white evangelical Democrats support allowing these refusals. Two-thirds (67%) of white evangelical Democrats are opposed to religiously based service refusals.
Racial and Ethnic Differences by Demographic Subgroups
While majorities of Americans of all racial and ethnic groups oppose religiously based service refusals, there are significant differences by age, gender, and education.
Race and Ethnicity by Age
As with the general population, younger Americans of all races are on average approximately ten percentage points likelier than their older counterparts to oppose religiously based refusals to serve gay and lesbian people. At least six in ten younger white (61%), black (70%), Hispanic (64%), Asian-Pacific Islander (61%), and those who identify as mixed or other race (63%) Americans oppose religiously based service refusals, compared to seniors who are white (50%), black (63%), Hispanic (52%), Asian-Pacific Islander (49%), or another race or mixed race (52%).
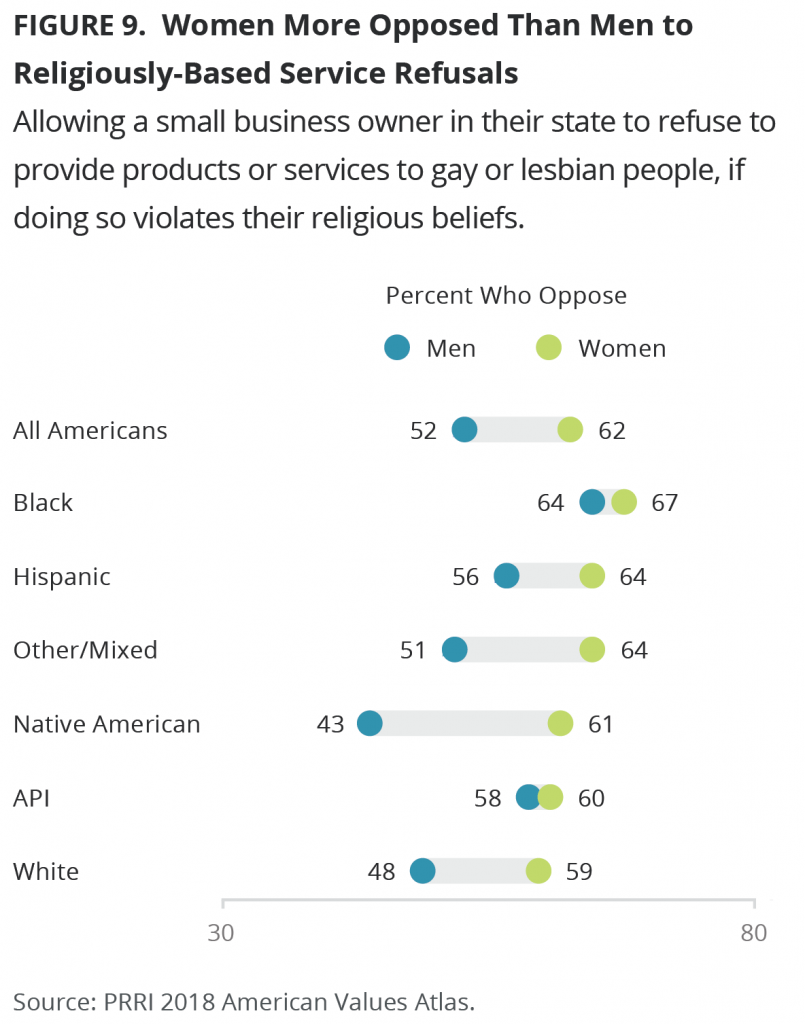
Race and Ethnicity by Gender
White and Hispanic women are likelier than men of the same race to oppose religiously based service refusals. About six in ten (59%) white women oppose allowing small business owners to refuse service to gay and lesbian people based on their religious beliefs, compared to less than half (48%) of white men. Similarly, 64% of Hispanic women oppose religiously based service refusals, compared to 56% of Hispanic men. Similar gaps in opposition exist among those who are mixed or another race between women (64%) and men (51%). No similarly large gender divides exist among Asian-Pacific Islander Americans or black Americans, though black women are moderately more likely than black men to oppose allowing religiously based service refusals (67% vs. 64%).
White men stand out in their support for religiously based service refusals. Majorities of black (64%), Hispanic (56%), and Asian and Pacific Islander Americans (58%) men oppose religiously based service refusals, compared to 48% of white men. Nearly as many white men (45%) favor religiously based service refusals.
Race and Ethnicity by Educational Attainment
There are few significant differences by educational attainment within racial and ethnic groups. In general, however, the trend holds that Americans with a higher level of educational attainment are more likely to oppose religiously based refusals, regardless of their race. For example, white Americans with a postgraduate degree (60%) are more likely than white Americans with a high school degree or less (54%) to oppose religiously based service refusals. Similarly, black Americans with a postgraduate degree (69%) are slightly more likely than black Americans with a high school education (64%) to oppose religiously based service refusals.
Religious Differences by Demographic Subgroups
Majorities of most major religious groups oppose religiously based service refusals. Notably, fault lines within religious groups on this issue are structured less by age than by partisanship.
Religious Difference by Age
Compared to the age differences on the issue of general nondiscrimination protections, generational divides are more modest and varied among religious Americans on the issue of religiously bases service refusals. For example, there are only modest differences in opposition to religiously based service refusals among younger and older white evangelical Protestants (43% vs. 39%) and white mainline Protestants (57% vs. 53%), as well as small but significant differences for religiously unaffiliated Americans (69% vs. 64%). The differences in opposition to this policy between the younger and older members of other religious groups are more substantial: black Protestants (72% vs. 61%), white Catholics (60% vs. 53%), Hispanic Catholics (64% vs. 55%), and other nonwhite Catholics (73% vs. 48%).
Geographical Differences
Regions
Majorities of Americans in all four major regions of the country oppose religiously based refusals to serve gay and lesbian people, but there are some modest variations in intensity. Not surprisingly, residents of the Northeast (61%) are slightly more likely than residents of the South (55%) to oppose religiously based service refusals, while residents of the Midwest (56%) and West (57%) fall in between.
States
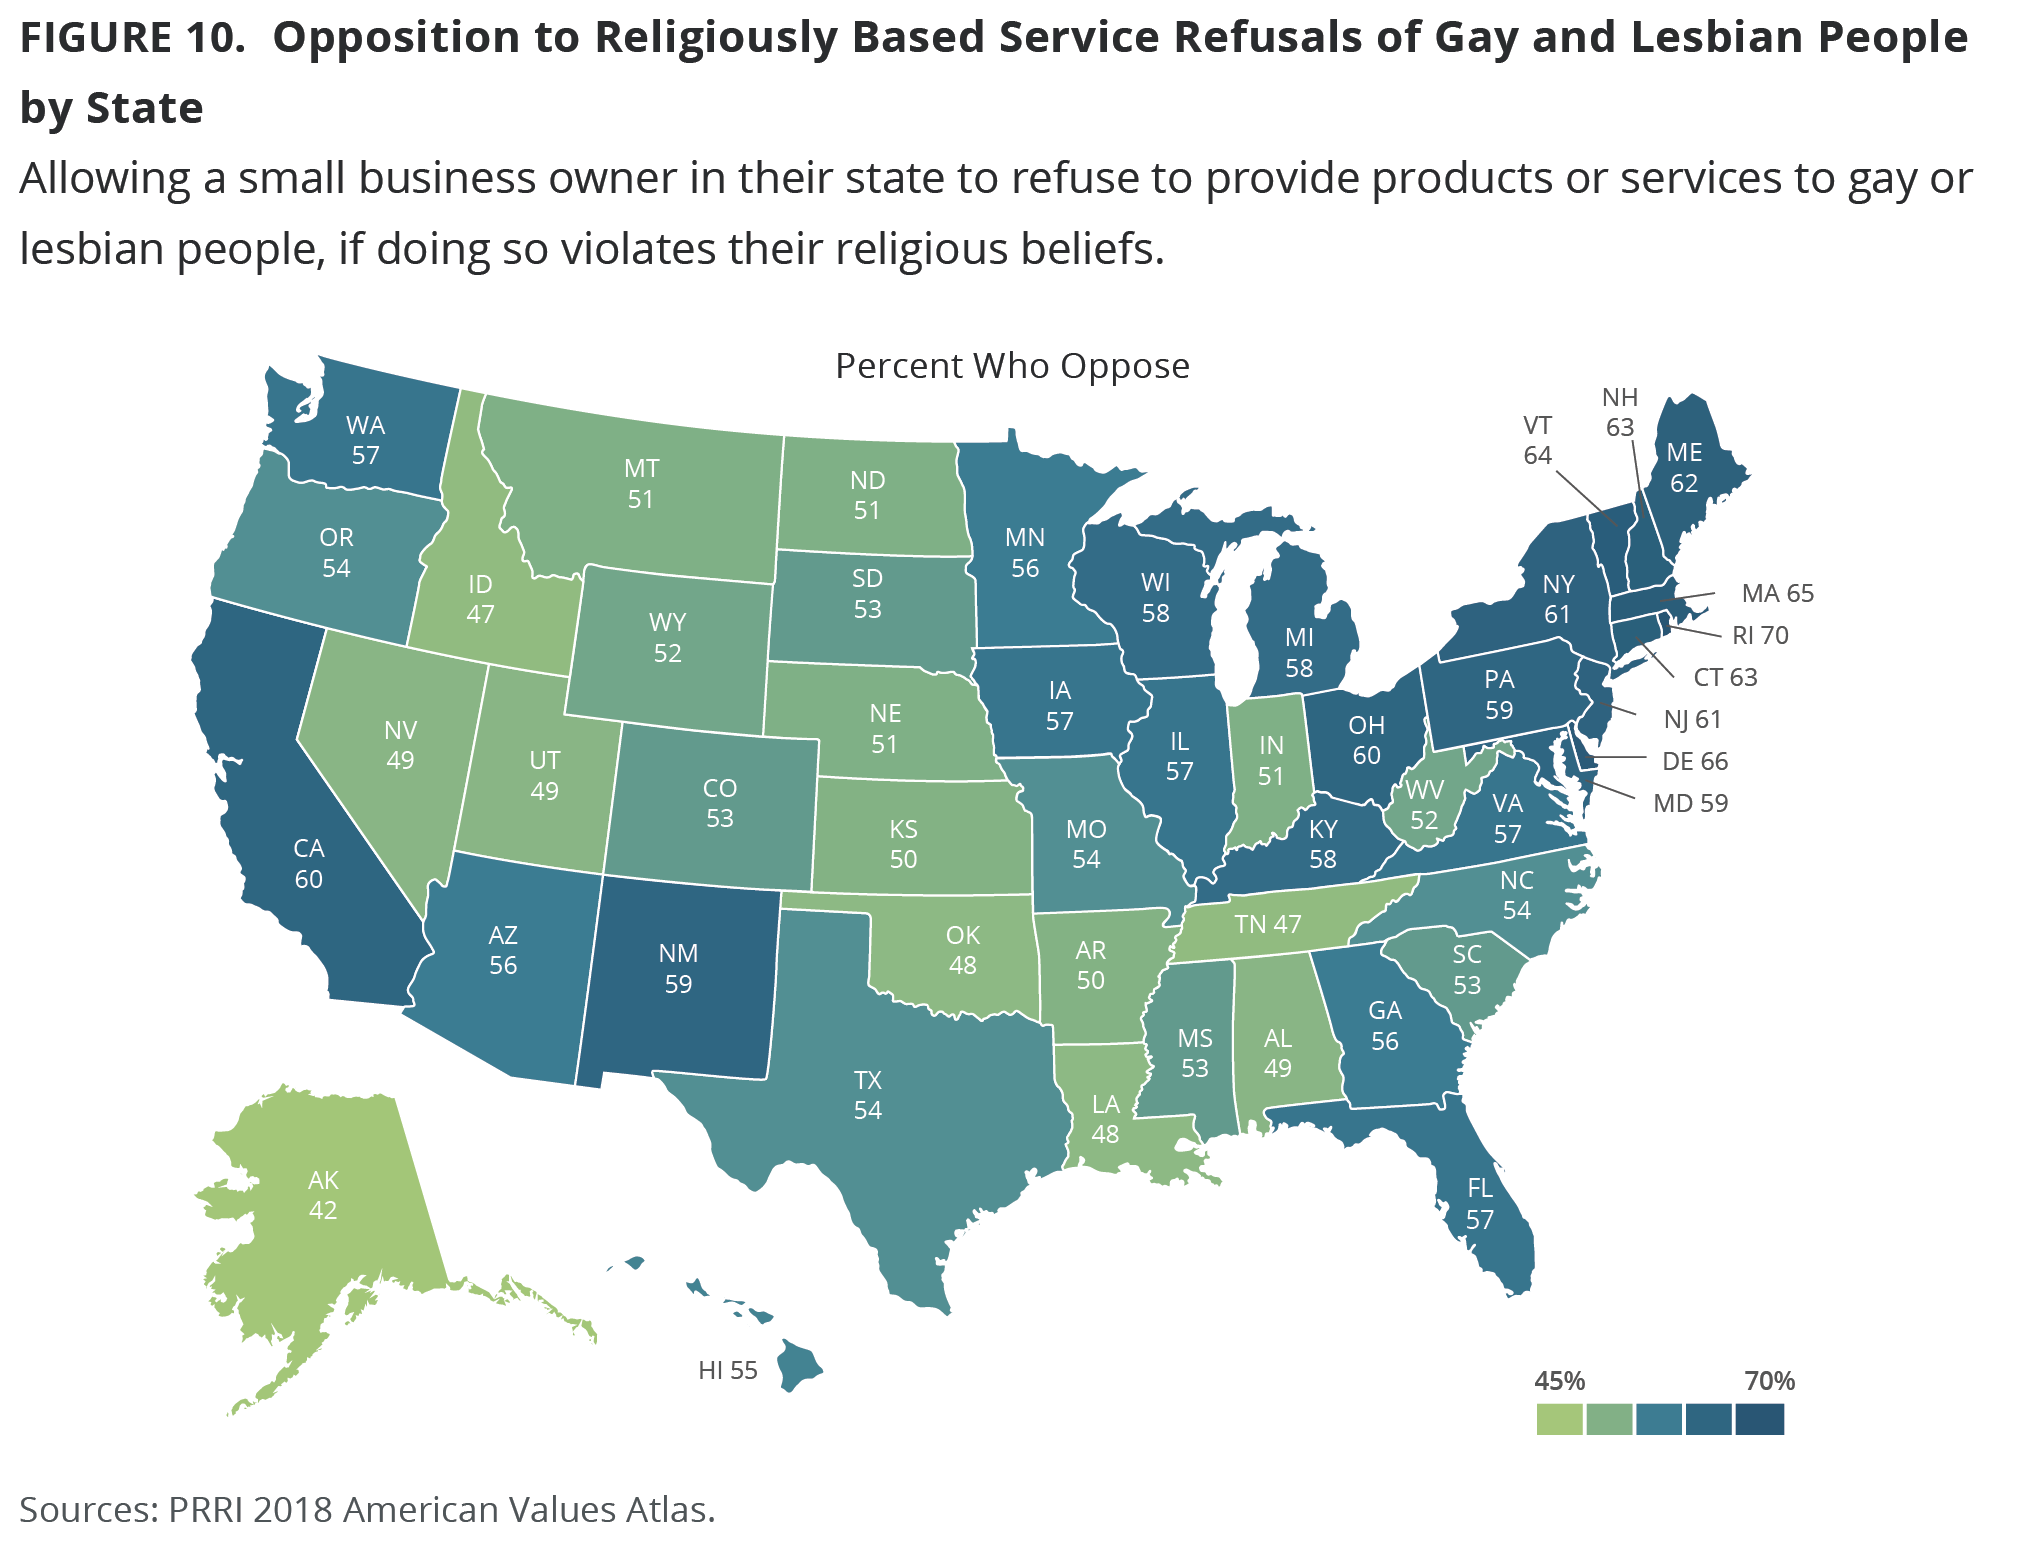
A majority of Americans in 40 states believe small business owners in their state should not be allowed to refuse service to gay and lesbian people. Whereas opposition to nondiscrimination protections is concentrated in the South, opposition to religiously based service refusals is geographically broader—across the West, Midwest, and the South—in states with high percentages of either white evangelical Protestants or Mormons. In 10 states—Arkansas (50%), Kansas (50%), Alabama (49%), Nevada (49%), Oklahoma (48%), Utah (49%), Louisiana (48%), Idaho (47%), Tennessee (47%), and Alaska (42%)—there is less than majority opposition to religiously based service refusals. Additionally, only a slim majority of residents of Nebraska (51%), North Dakota (51%), and Montana (51%) oppose this policy.
In contrast, Northeastern and mid-Atlantic states express the strongest objection to religiously based service refusals. More than six in ten residents of Rhode Island (70%), Massachusetts (65%), Delaware (66%), Vermont (64%), Connecticut (63%), New Hampshire (63%), Maine (62%), New Jersey (61%), and New York (61%) oppose allowing small business owners to refuse service to gay and lesbian customers.
Metropolitan Areas
Majorities of the residents of most major metropolitan areas oppose religiously based service refusals, with three exceptions. Several cities stand out for their relatively low levels of opposition to religiously based service refusals. Less than half (48%) of Nashville residents are opposed to religiously based refusals to serve gay and lesbian people, compared to 44% who favor this policy. Half of residents in Las Vegas (50%) and Raleigh (50%) oppose religiously based service refusals, while 41% favor. Additionally, a slim majority of residents of Houston (53%), Indianapolis (53%), Kansas City (53%), and Portland (53%) oppose allowing small business owners to refuse to serve gay and lesbian customers based on their religious beliefs. At the other end of the spectrum, Boston (67%) and San Francisco (66%) stand out as the cities with the highest levels of opposition to religiously based refusals to serve gay and lesbian people.
Since 2015, opposition to religiously based refusals to serve gay and lesbian people has dropped in a number of cities, such as Buffalo (74% to 55%), New York City (from 70% to 61%), Chicago (69% to 62%), Louisville (66% to 56%), and Raleigh (62% to 50%). However, a few other cities saw opposition to religiously based service refusals increase from 2015 to 2018, including Oklahoma City (46% to 58%).
Part Three: Support for Same-Sex Marriage
Overview and Recent Trends: 2015-2018
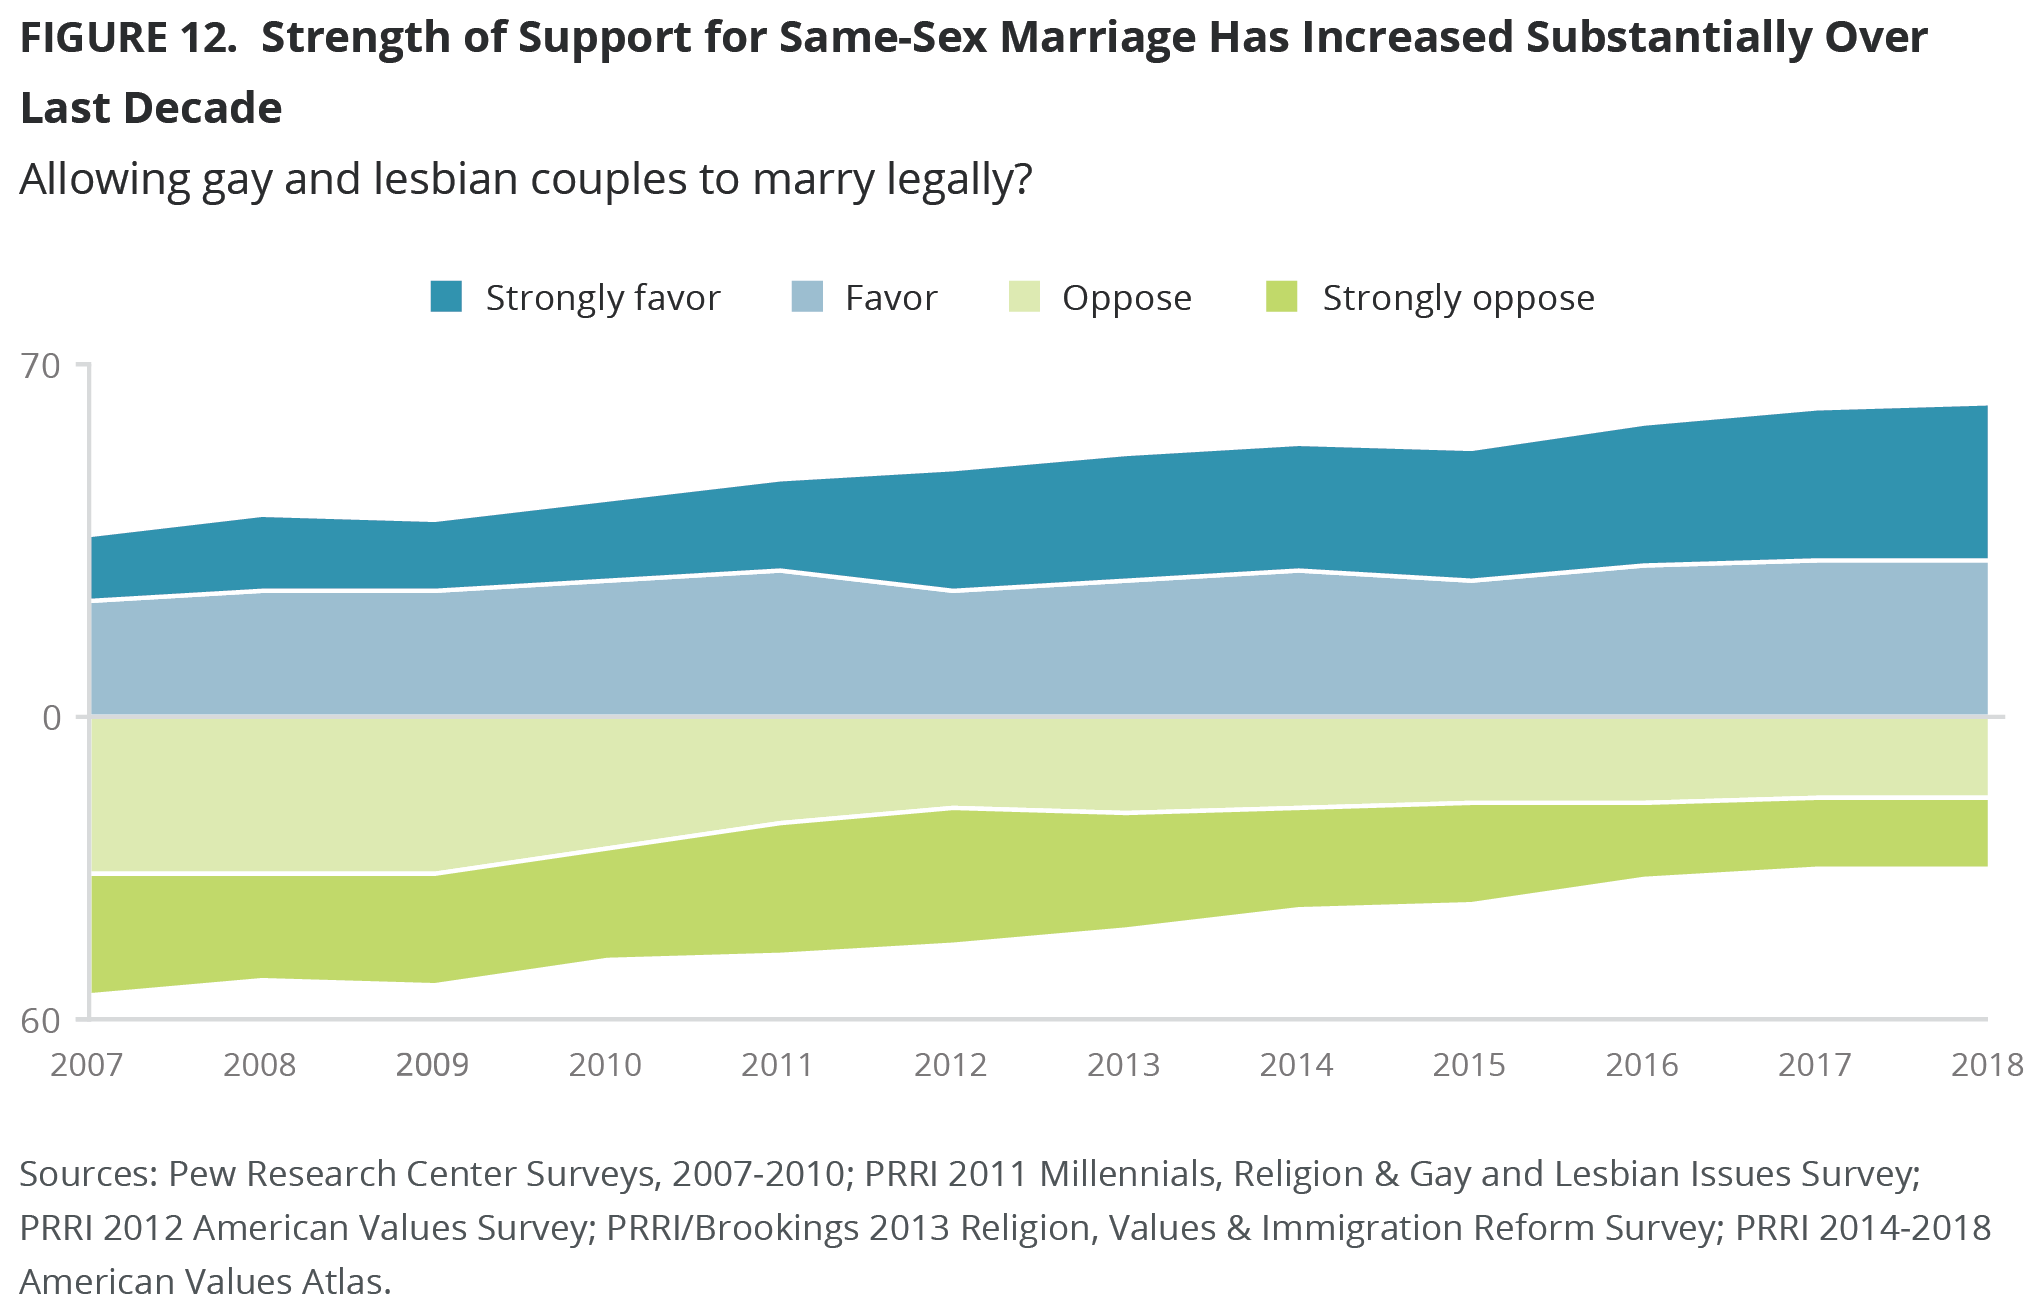
Since the U.S. Supreme Court ruled in 2015 that same-sex couples have a constitutional right to marry, support for same-sex marriage has increased substantially. Currently, more than six in ten (62%) Americans say gay and lesbian couples should be allowed to marry legally, while only about half as many (30%) are opposed.[6] These results represent a nearly ten-point increase from 2015, when a smaller majority (53%) of Americans supported same-sex marriage, and almost four in ten (37%) opposed this policy. And they represent a 26-point increase from 2007, when over one in three (36%) Americans supported same-sex marriage, while a majority (55%) were opposed.[7]
In addition to the overall uptick in support for same-sex marriage, the intensity of support has grown, while strong opposition to same-sex marriage has fallen. In 2007, Americans were substantially more likely to strongly oppose same-sex marriage (24%) rather than strongly favor (13%). Today, the opposite is true: about three in ten (31%) Americans strongly favor same-sex marriage, while only 14% are strongly opposed.
There is a broad consensus among younger Americans (ages 18-29) that same-sex marriage should be legal: nearly eight in ten (79%) support gay marriage, while only 16% are opposed. By contrast, less than half (49%) of seniors (ages 65 and older) favor same-sex marriage, while more than four in ten (43%) are opposed.
Although women (65%) are more likely than men (58%) to support same-sex marriage, generational divides cut across gender. Younger men (77%) are substantially more likely than senior men (47%) to favor legalizing same-sex marriage; similarly, younger women (81%) are much likelier than senior women (50%) to be in support of same-sex marriage.
Partisan gaps in views of same-sex marriage persist, even as the public has become more supportive of the policy overall. Over three-quarters (77%) of Democrats and about two-thirds (65%) of independents favor same-sex marriage, compared to only 41% of Republicans; half (50%) of Republicans continue to oppose same-sex marriage.
However, opposition to same-sex marriage has declined significantly among Republicans over the past decade, while support has risen. Support among Republicans for same-sex marriage has risen 21 percentage points since 2011 when nearly three-quarters (73%) of Republicans opposed legalizing same-sex marriage, while only 20% were in favor.[8] There has also been a shift, albeit less dramatic, in views among independents and Democrats. In 2011, only half (50%) of independents and about two-thirds (65%) of Democrats favored same-sex marriage.
Selected Demographic Interactions
Partisan Differences by Demographic Subgroups
Party by Ideology
Notably, among Republicans, opposition to same-sex marriage is confined to conservative Republicans. Nearly six in ten (59%) conservative Republicans oppose same-sex marriage, compared to 26% of Republicans who identify as either moderate or liberal. There is also a substantial ideological divide among independents and Democrats. Less than half (49%) of conservative independents favor same-sex marriage, compared to 68% of moderate independents and 82% of liberal independents. Similarly, a smaller majority (54%) of conservative Democrats support same-sex marriage, compared to 73% of moderate Democrats and 88% of liberal Democrats.
Party by Age
There is a slightly larger generation gap among Republicans on the issue of same-sex marriage than among independents or Democrats. Half (50%) of Republicans between the ages of 18 and 49 support same-sex marriage, while 42% are opposed. By contrast, more than six in ten (63%) senior Republicans (ages 65 and older) oppose same-sex marriage, and less than three in ten (28%) are in favor. Majorities of Democrats of all ages support same-sex marriage, but Democrats between the ages of 18 and 49 (86%) are likelier to favor gay marriage than Democratic seniors (66%). Similarly, independents between the ages of 18 and 49 are also more likely than independent seniors to support gay marriage (72% vs. 53%).
Religious Differences by Demographic Subgroups
Most major religious groups in the U.S. now support same-sex marriage, including an overwhelming majority of religiously unaffiliated Americans (82%). Roughly two-thirds of white mainline Protestants (68%), Hispanic Catholics (67%), and white Catholics (66%) also favor same-sex marriage. A slim majority of other non-white Protestants (55%) also support legalizing marriage between gay and lesbian people.
There are some exceptions in which not quite a majority within the religious group support same-sex marriage. For example, 48% of black Protestants favor allowing gay and lesbian couples to marry legally, while 45% are opposed and seven percent offer no opinion. Similarly, half (50%) of Hispanic Protestants support gay marriage, while 39% are opposed and 11% offer no opinion.
Among major religious groups, opposition to same-sex marriage remains confined to white evangelical Protestants. About one-third (34%) of white evangelical Protestants support same-sex marriage today, while six in ten (60%) are opposed, including 30% who are strongly opposed. There are notable generational gaps among white evangelical Protestants: four in ten (40%) of those under age 50 favor same-sex marriage, compared to 27% of those ages 50 and over.
Among most other religious groups, there are slightly more pronounced gaps between those under 50 years of age and those age 50 and older: white Catholics (76% vs. 60%), nonwhite Catholics (74% vs. 60%), nonwhite Protestants (60% vs. 36%), and the religiously unaffiliated (87% vs. 72%).
Racial and Ethnic Differences
Majorities of all racial and ethnic groups support same-sex marriage, including three-quarters (75%) of Asian-Pacific Islander Americans, 68% of Americans who identify with another race or as mixed race, 65% of Hispanic Americans, 62% of white Americans, 56% of black Americans, and 55% of Native Americans.
There is a modest gender gap among white men and women, with white women (67%) more likely than white men (57%) to support same-sex marriage. There are no similar gender differences among black and Hispanic Americans.
Black and white Americans with a higher level of educational attainment are generally more likely to support same-sex marriage. More than seven in ten (73%) white Americans with a postgraduate degree favor allowing gay and lesbian couples to marry legally, compared to 55% of white Americans with a high school degree or less. Similarly, more than six in ten (63%) black Americans with a postgraduate degree support same-sex marriage, compared to 52% of black Americans with a high school degree or less.
Geographical Differences
Although majorities of the residents of all four major regions of the U.S. support the legality of same-sex marriage, there are some variations in intensity. Residents of the Northeast (70%) and West (67%) are likelier to favor allowing gay and lesbian couples to marry legally, compared to 60% of Midwest residents and 56% of residents of the South.
Part Four: Exploring the Nondiscrimination Protections vs. Religious Refusals Gap
Who Supports Nondiscrimination Protections, but also Supports Religious Service Refusals?
Among those who favor laws that provide nondiscrimination protections for LGBT people, a majority (61%) are also opposed to religiously based refusals to serve gay and lesbian people. However, about one-third (34%) of those who support nondiscrimination protections also nonetheless favor allowing small business to refuse to serve LGBT people for religious reasons.
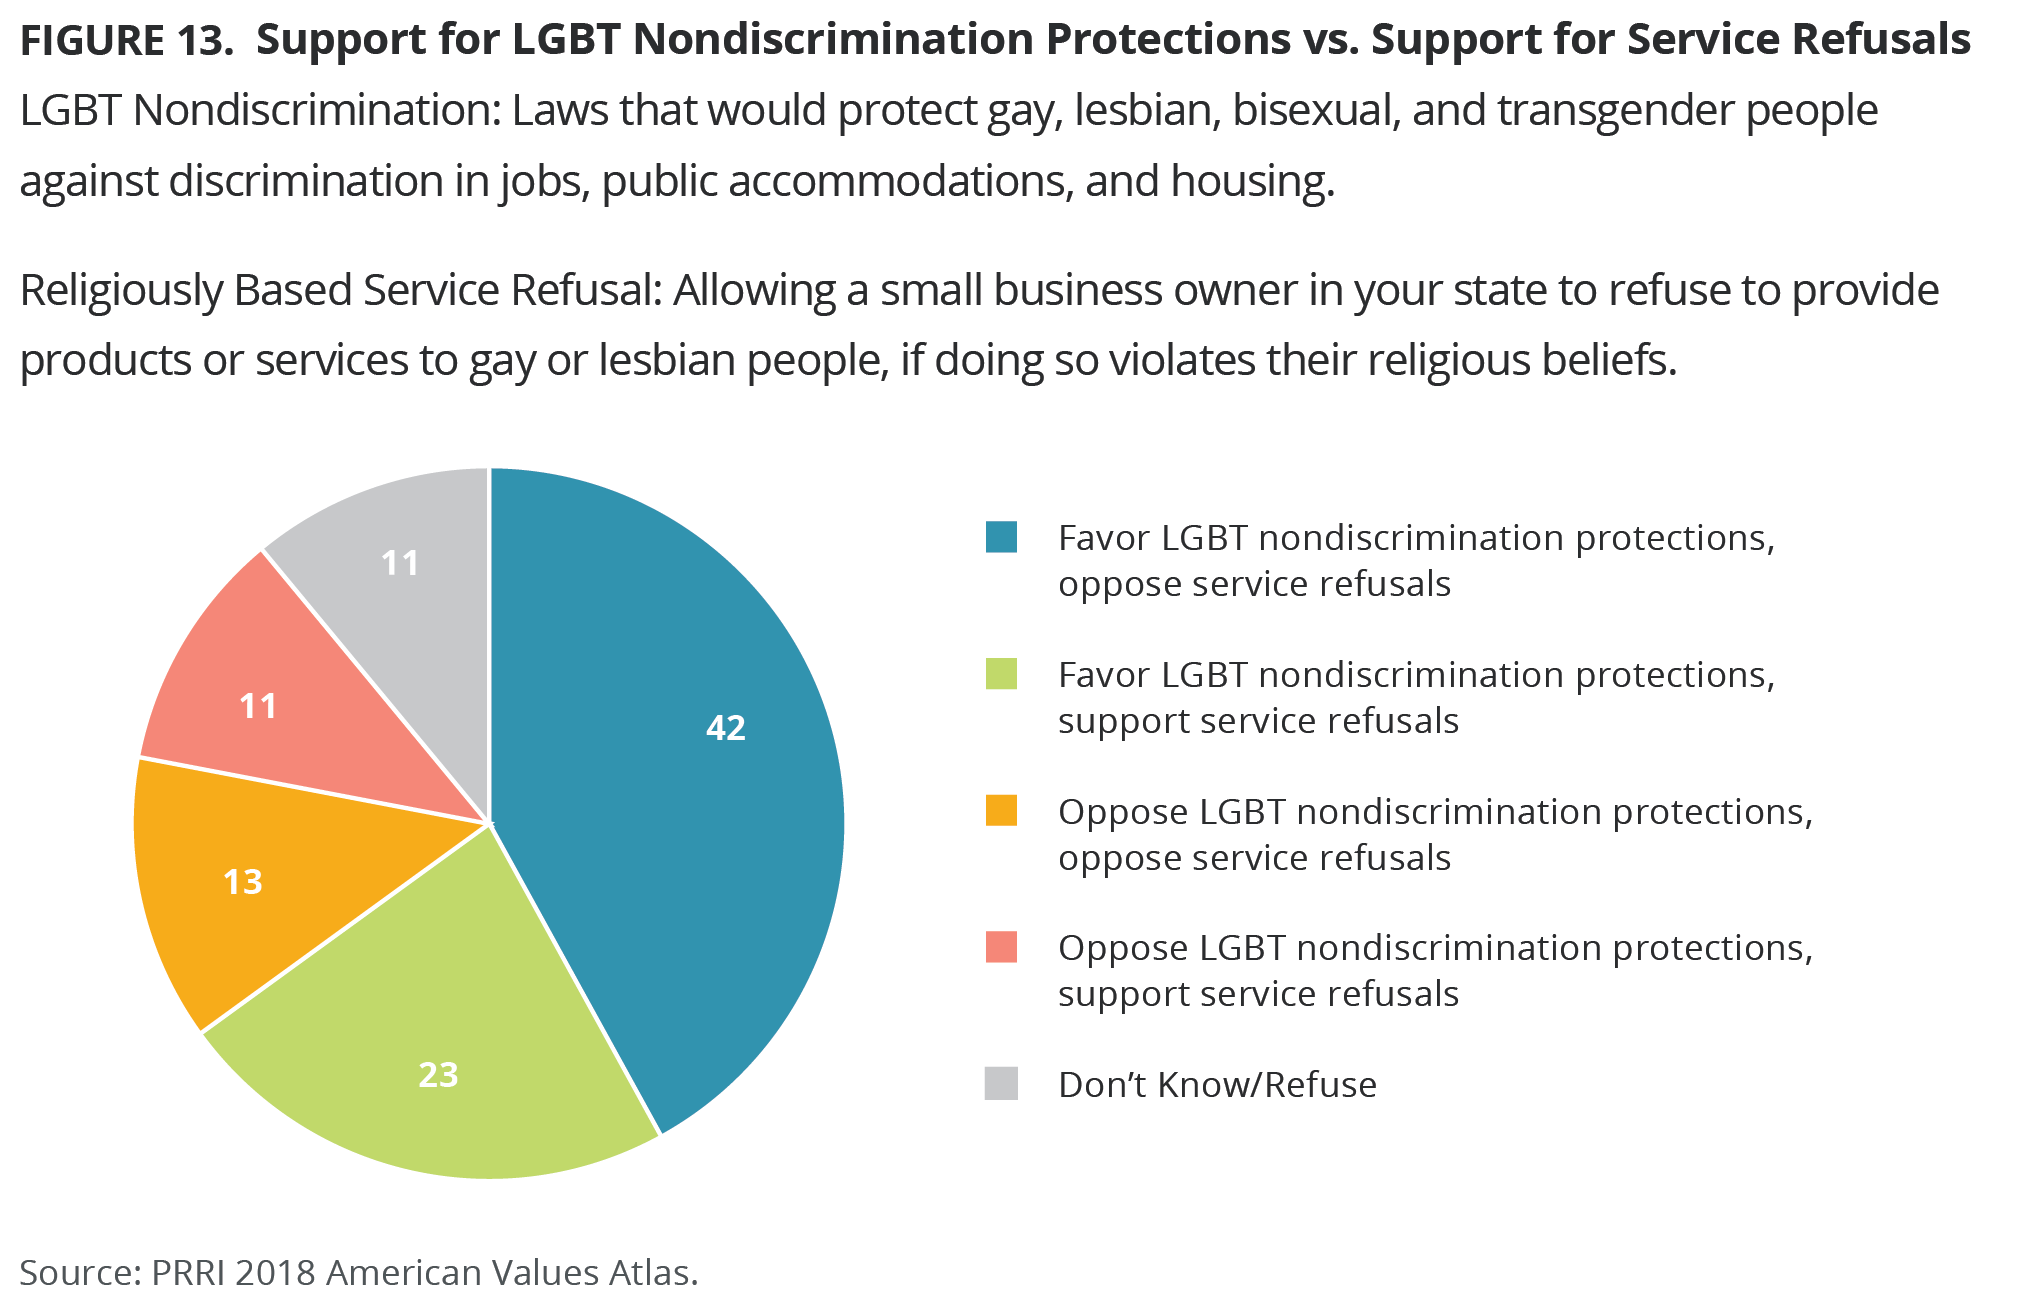
Overall, about four in ten (42%) Americans favor nondiscrimination protections for LGBT people and oppose allowing businesses to refuse services to LGBT people on religious grounds. Conversely, 11% of Americans oppose nondiscrimination policies for LGBT people, and favor allowing small businesses to refuse services to LGBT people on religious grounds. Interestingly, 13% of Americans oppose nondiscrimination policies for LGBT people and also oppose allowing small businesses to serve LGBT people on religious grounds. Finally, about one-quarter (23%) of Americans favor nondiscrimination policies for LGBT people, but simultaneously believe that businesses should be allowed to refuse services to LGBT people on religious grounds.
Among those who are in favor of nondiscrimination protections but also support religiously based service refusals, a plurality (42%) are independents, one-third (33%) are Republicans, and less than one in five (19%) are Democrats. This group skews more Republican than Americans in general, where roughly one-quarter (24%) are Republican and one in three (30%) are Democrats. Independents make up a slightly larger proportion of this group (42%) compared to the American public (39%).
Notably, those who support nondiscrimination protections while favoring religious exemptions do not differ from the population overall in terms of age. By contrast, those who support nondiscrimination protections without religious exemptions skew younger (25% age 18-29; 16% age 65 and older) than the general public (21% ages 18-29; 20% age 65 and older).
Those favoring nondiscrimination protections while favoring religiously based service refusals do not differ greatly from the general public in terms of religious affiliation, with the exception of religiously unaffiliated Americans who are slightly underrepresented in this group (21% vs. 25% of all Americans). By contrast, those who support nondiscrimination protections without favoring religious exemptions are more likely than the general public to be religiously unaffiliated (33% vs. 25% of all Americans).
Demographic Differences
Women are more likely than men to support nondiscrimination protections without religious exemptions (48% vs. 36%, respectively). Women and men are roughly equally as likely to say they support both nondiscrimination policies and religious exemptions to those policies (22% and 25%)
There is also a notable generational gap, with half (50%) of younger Americans (18-29), compared to only one-third (33%) of seniors (ages 65 and older), supporting nondiscrimination laws and also opposing service refusals. This generational gap does not appear among Americans who support both nondiscrimination laws and religiously based service refusals: 23% of both younger Americans and seniors hold this position.
Looking at political divides, over six in ten Democrats (61%) support nondiscrimination laws but oppose religious exemptions, compared to 42% of independents and 21% of Republicans. A third of all Republicans (33%) support both nondiscrimination laws and service refusals, while only a quarter (25%) of independents and 15% of Democrats hold the same view.
White Americans (25%) are slightly more likely than other racial and ethnic groups to support both nondiscrimination laws and religiously based service refusals; about one in five black (19%), Hispanic (22%), Asian-Pacific Islander (23%), and mixed or other race (21%) Americans fall into this group. Black (44%), Asian-Pacific Islander (44%), other or mixed race (44%), and Hispanic (43%) Americans are more likely to fall into the group supporting nondiscrimination protections but opposing religiously based service refusals than any other group.
Americans who identify with New Age religions (63%), Jews (57%), religiously unaffiliated Americans (55%), Buddhists (53%), Hindus (48%), and Americans belonging to other religions (46%) are all particularly likely to support nondiscrimination laws and oppose religiously based refusals to serve LGBT people, while Orthodox Christians (39%), Hispanic Protestants (33%), Other Protestants (32%), Jehovah’s Witnesses (28%), Mormons (26%), and white evangelical Protestants (23%) are less likely to hold this view.
Religious groups that support nondiscrimination laws and also support religiously based service refusals include sizable numbers of Mormons (40%), white evangelical Protestants (29%), Hindus (27%), and white Catholics (26%).
Methodology
The 2018 American Values Atlas (AVA) is a project of PRRI. Results for all demographic, religious affiliation and political affiliation questions were based on 54,357 bilingual telephone interviews (including 32,569 cell phone interviews) conducted between January 3, 2018 and December 30, 2018 by professional interviewers under the direction of SSRS. Results for questions on specific issues (e.g., LGBT issues) are based on a subset of 40,292 telephone interviews (including 24,149 cell phone interviews) conducted between March 14, 2018 and December 16, 2018. Results for questions on same-sex marriage are based on a subset of 4,028 telephone interviews (including 2,413 cell phone interviews) conducted between March 14, 2018 and March 25, 2018 and between June 27, 2018 and July 8, 2018. The AVA was made possible a generous grant from an anonymous donor with additional support from The Nathan Cummings Foundation, The Evelyn and Walter Haas, Jr. Fund, The Gill Foundation, and United Universalist Veatch Program at Shelter Rock.
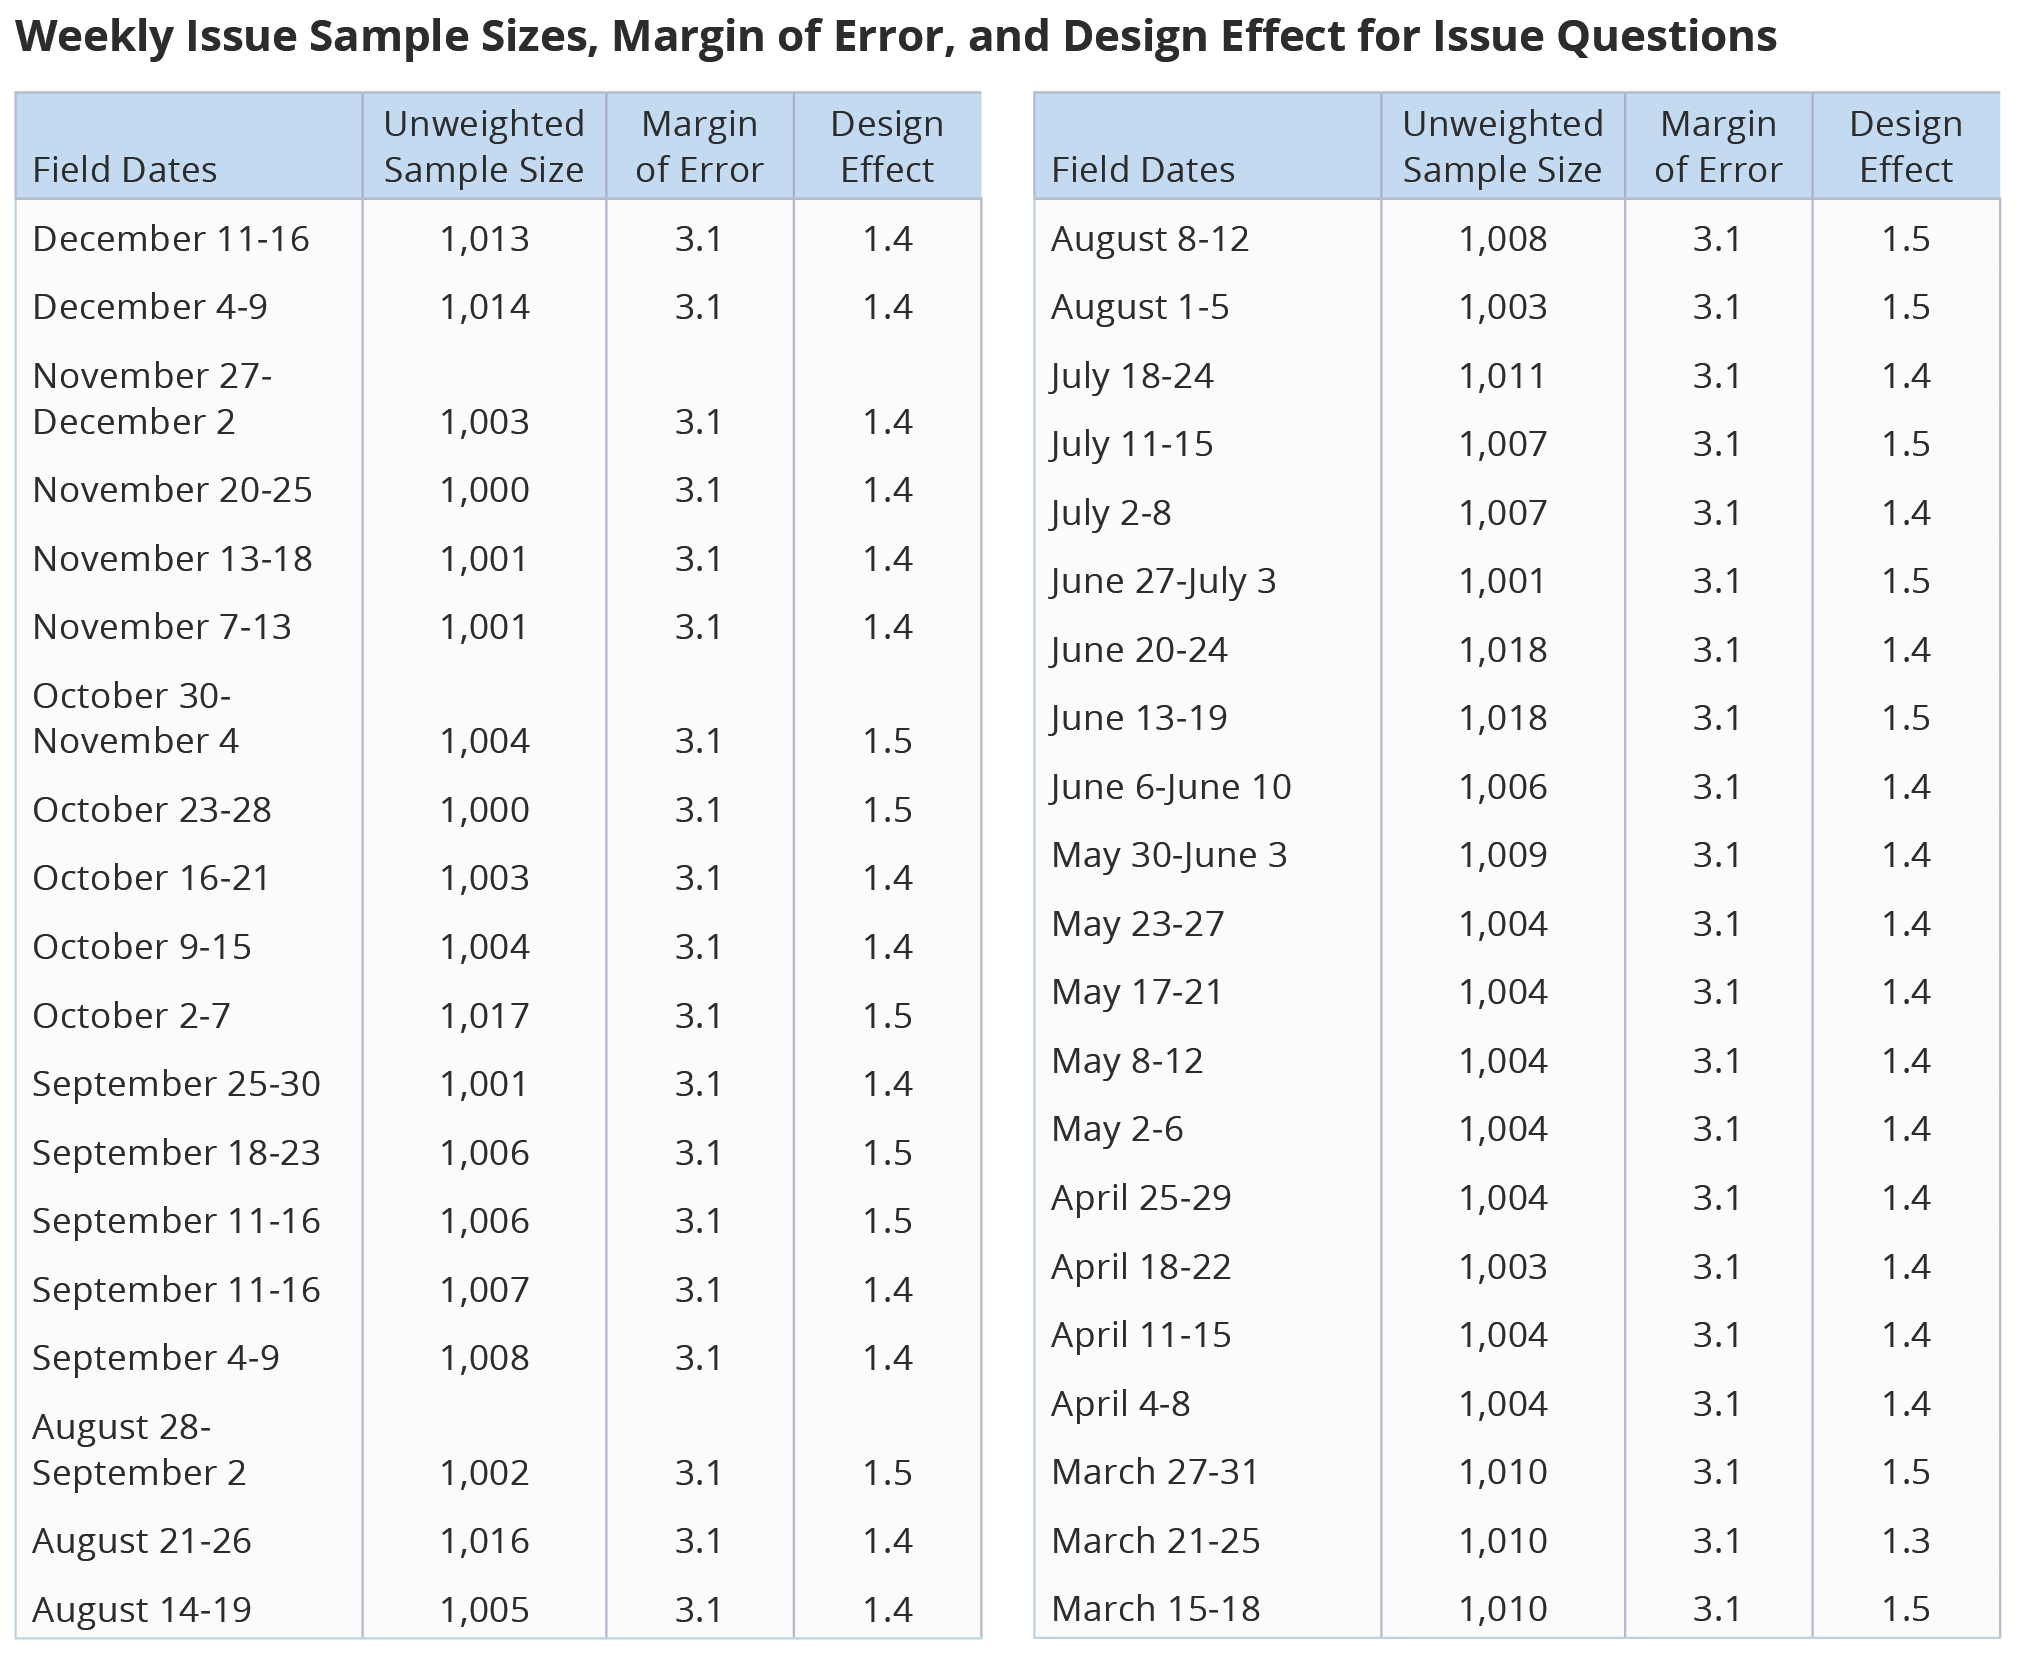
Throughout 2018, at least 1,000 interviews were completed each week, with about 600 interviews conducted among respondents on their cell phones. Each week, interviewing occurred over a five- or six-day period, starting Tuesdays or Wednesdays and going through Sunday or Monday. The selection of respondents within households was accomplished by randomly requesting to speak with the youngest adult male or female currently living in the household.
Data collection was based on stratified, single-stage, random-digit-dialing (RDD) of landline telephone households and randomly generated cell phone numbers. The sample was designed to represent the total U.S. adult population from all 50 states, including Hawaii and Alaska. The landline and cell phone samples were provided by Marketing Systems Group.
The weighting was accomplished in two separate stages. The first stage of weighting corrects for different probabilities of selection associated with the number of adults in each household and each respondent’s telephone usage patterns. In the second stage, sample demographics were balanced to match target population parameters for gender, age, education, race and Hispanic ethnicity, region (U.S. Census definitions), population density, and telephone usage. The population density parameter was derived from 2010 Census data. The telephone usage parameter came from an analysis of the January-June 2017 National Health Interview Survey. All other weighting parameters were derived from an analysis of the U.S. Census Bureau’s March 2017 Current Population Survey.
The sample weighting was accomplished using iterative proportional fitting (IFP), a process that simultaneously balances the distributions of all variables. Weights are trimmed so that they do not exceed 4.0 or fall below 0.25 to prevent individual interviews from having too much influence on the final results. The use of these weights in statistical analysis ensures that the demographic characteristics of the sample closely approximate the demographic characteristics of the target populations.
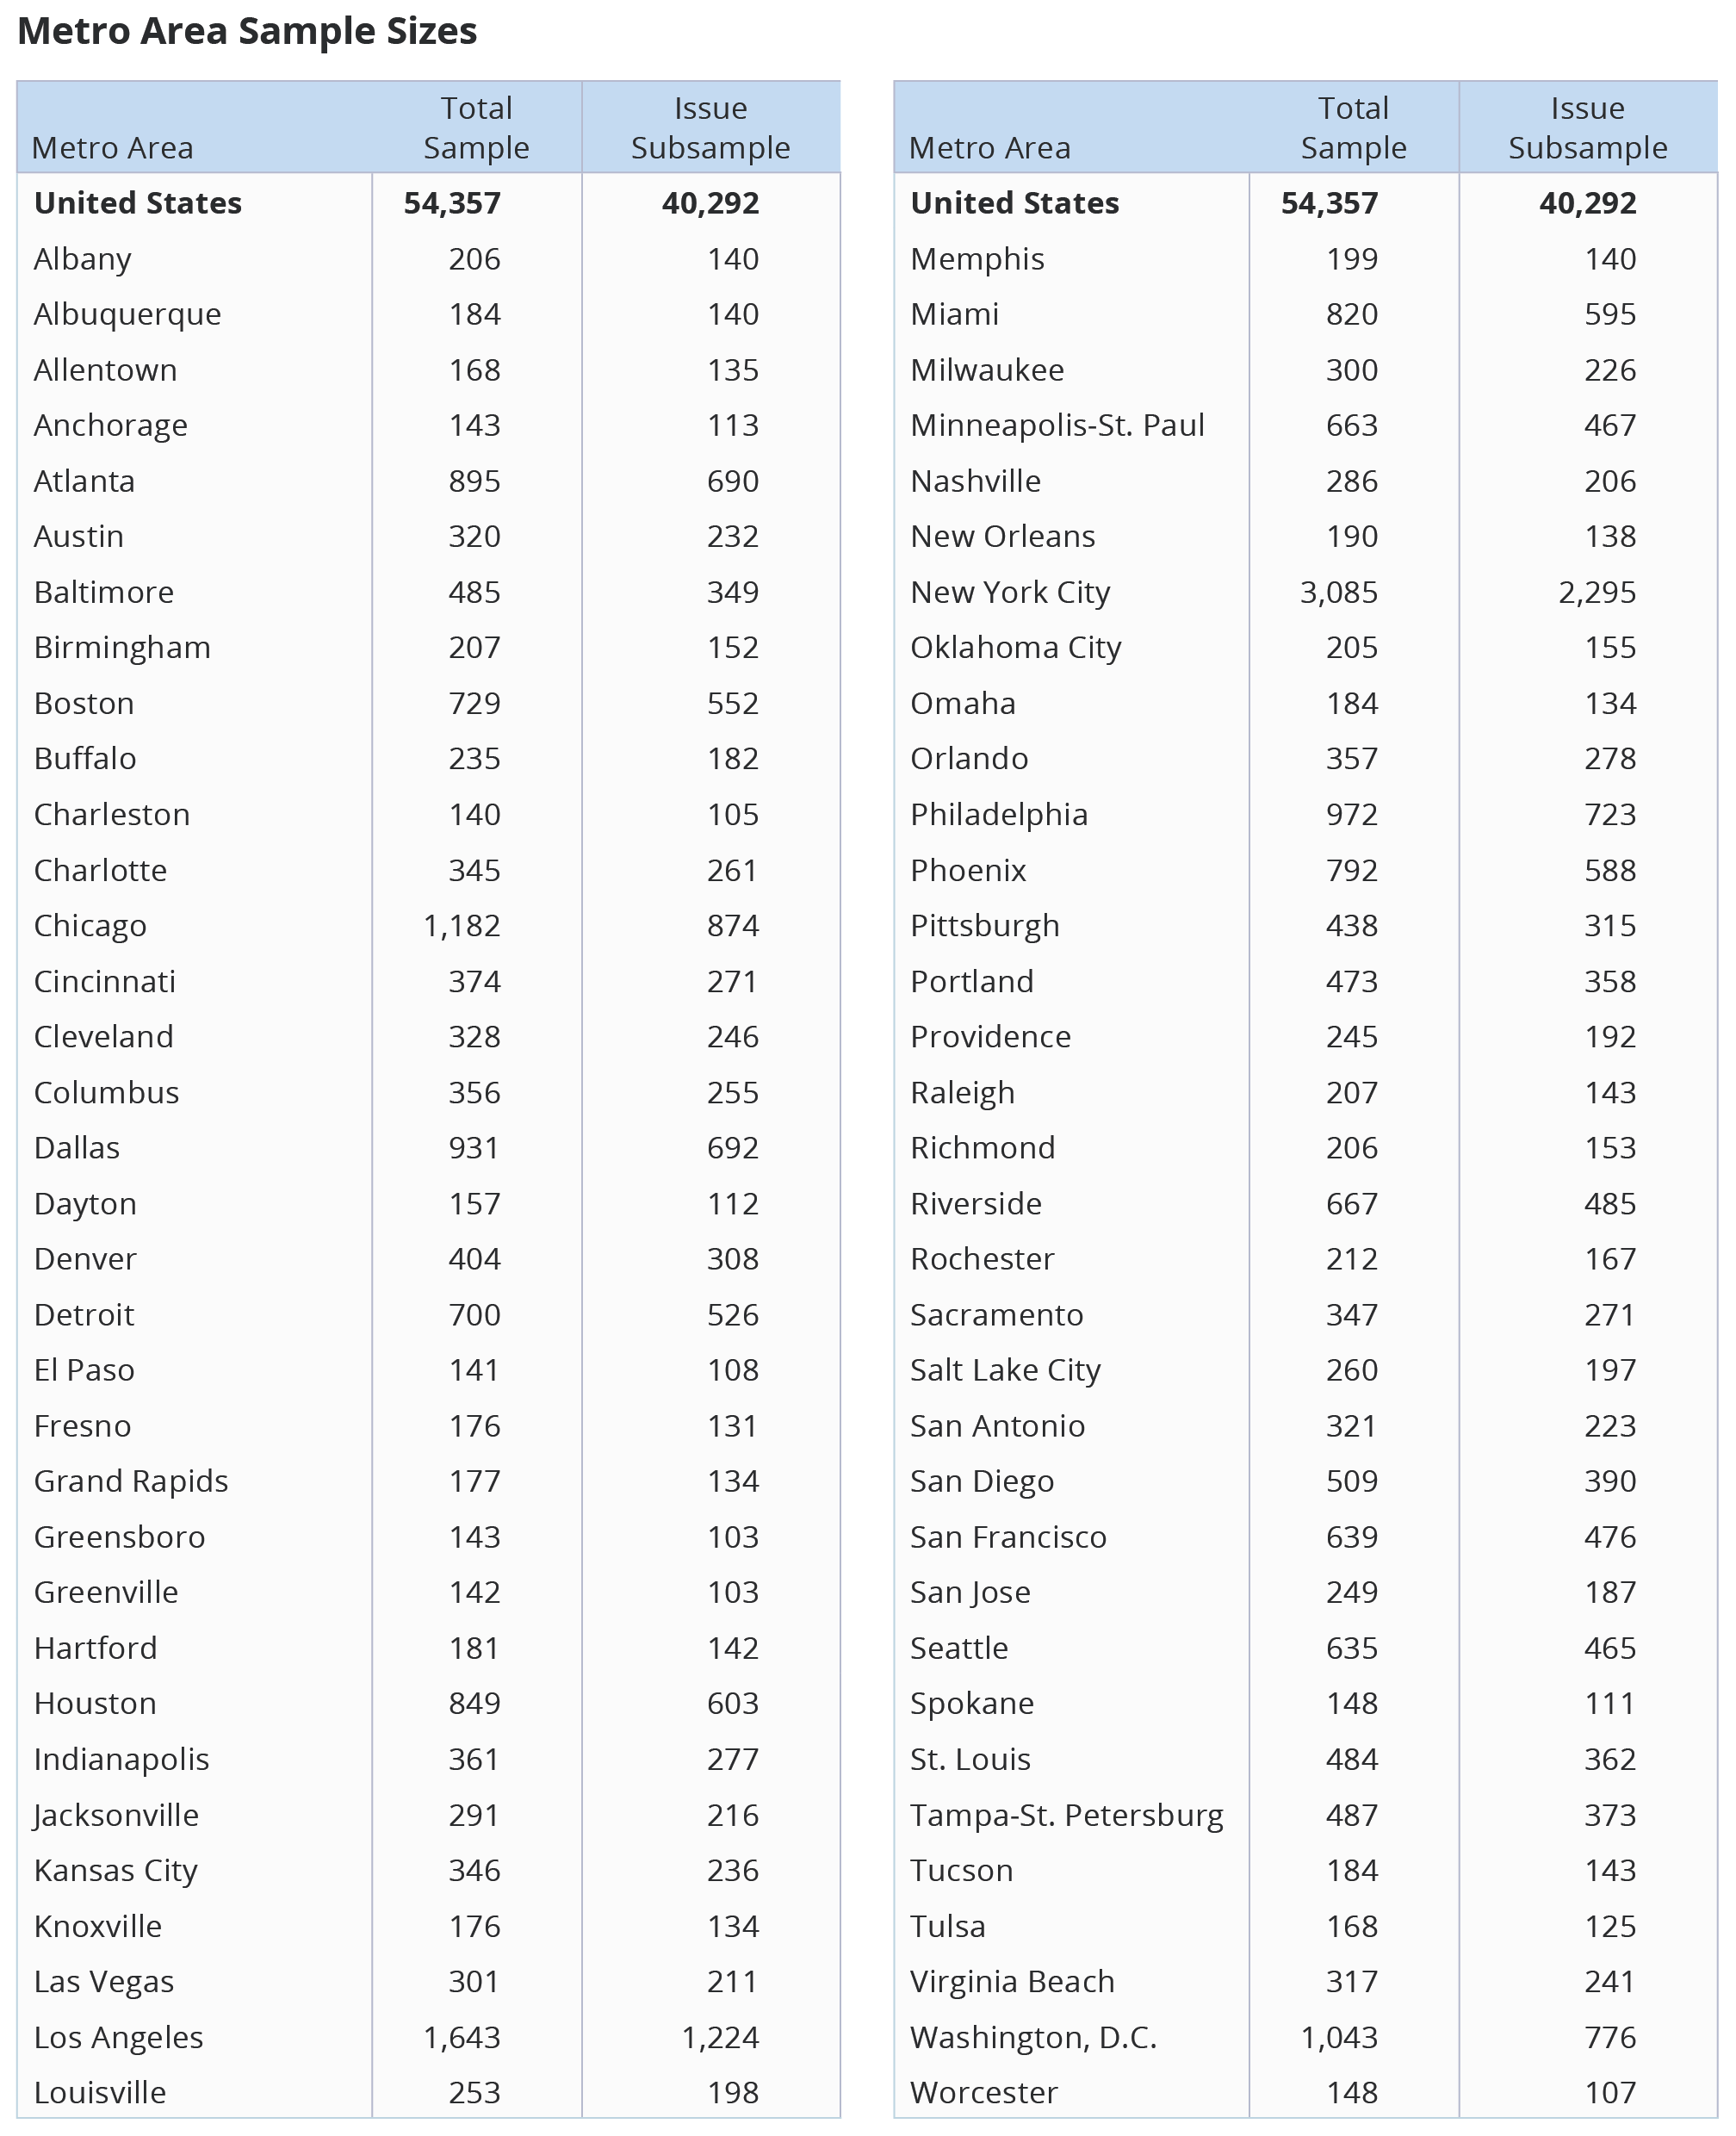
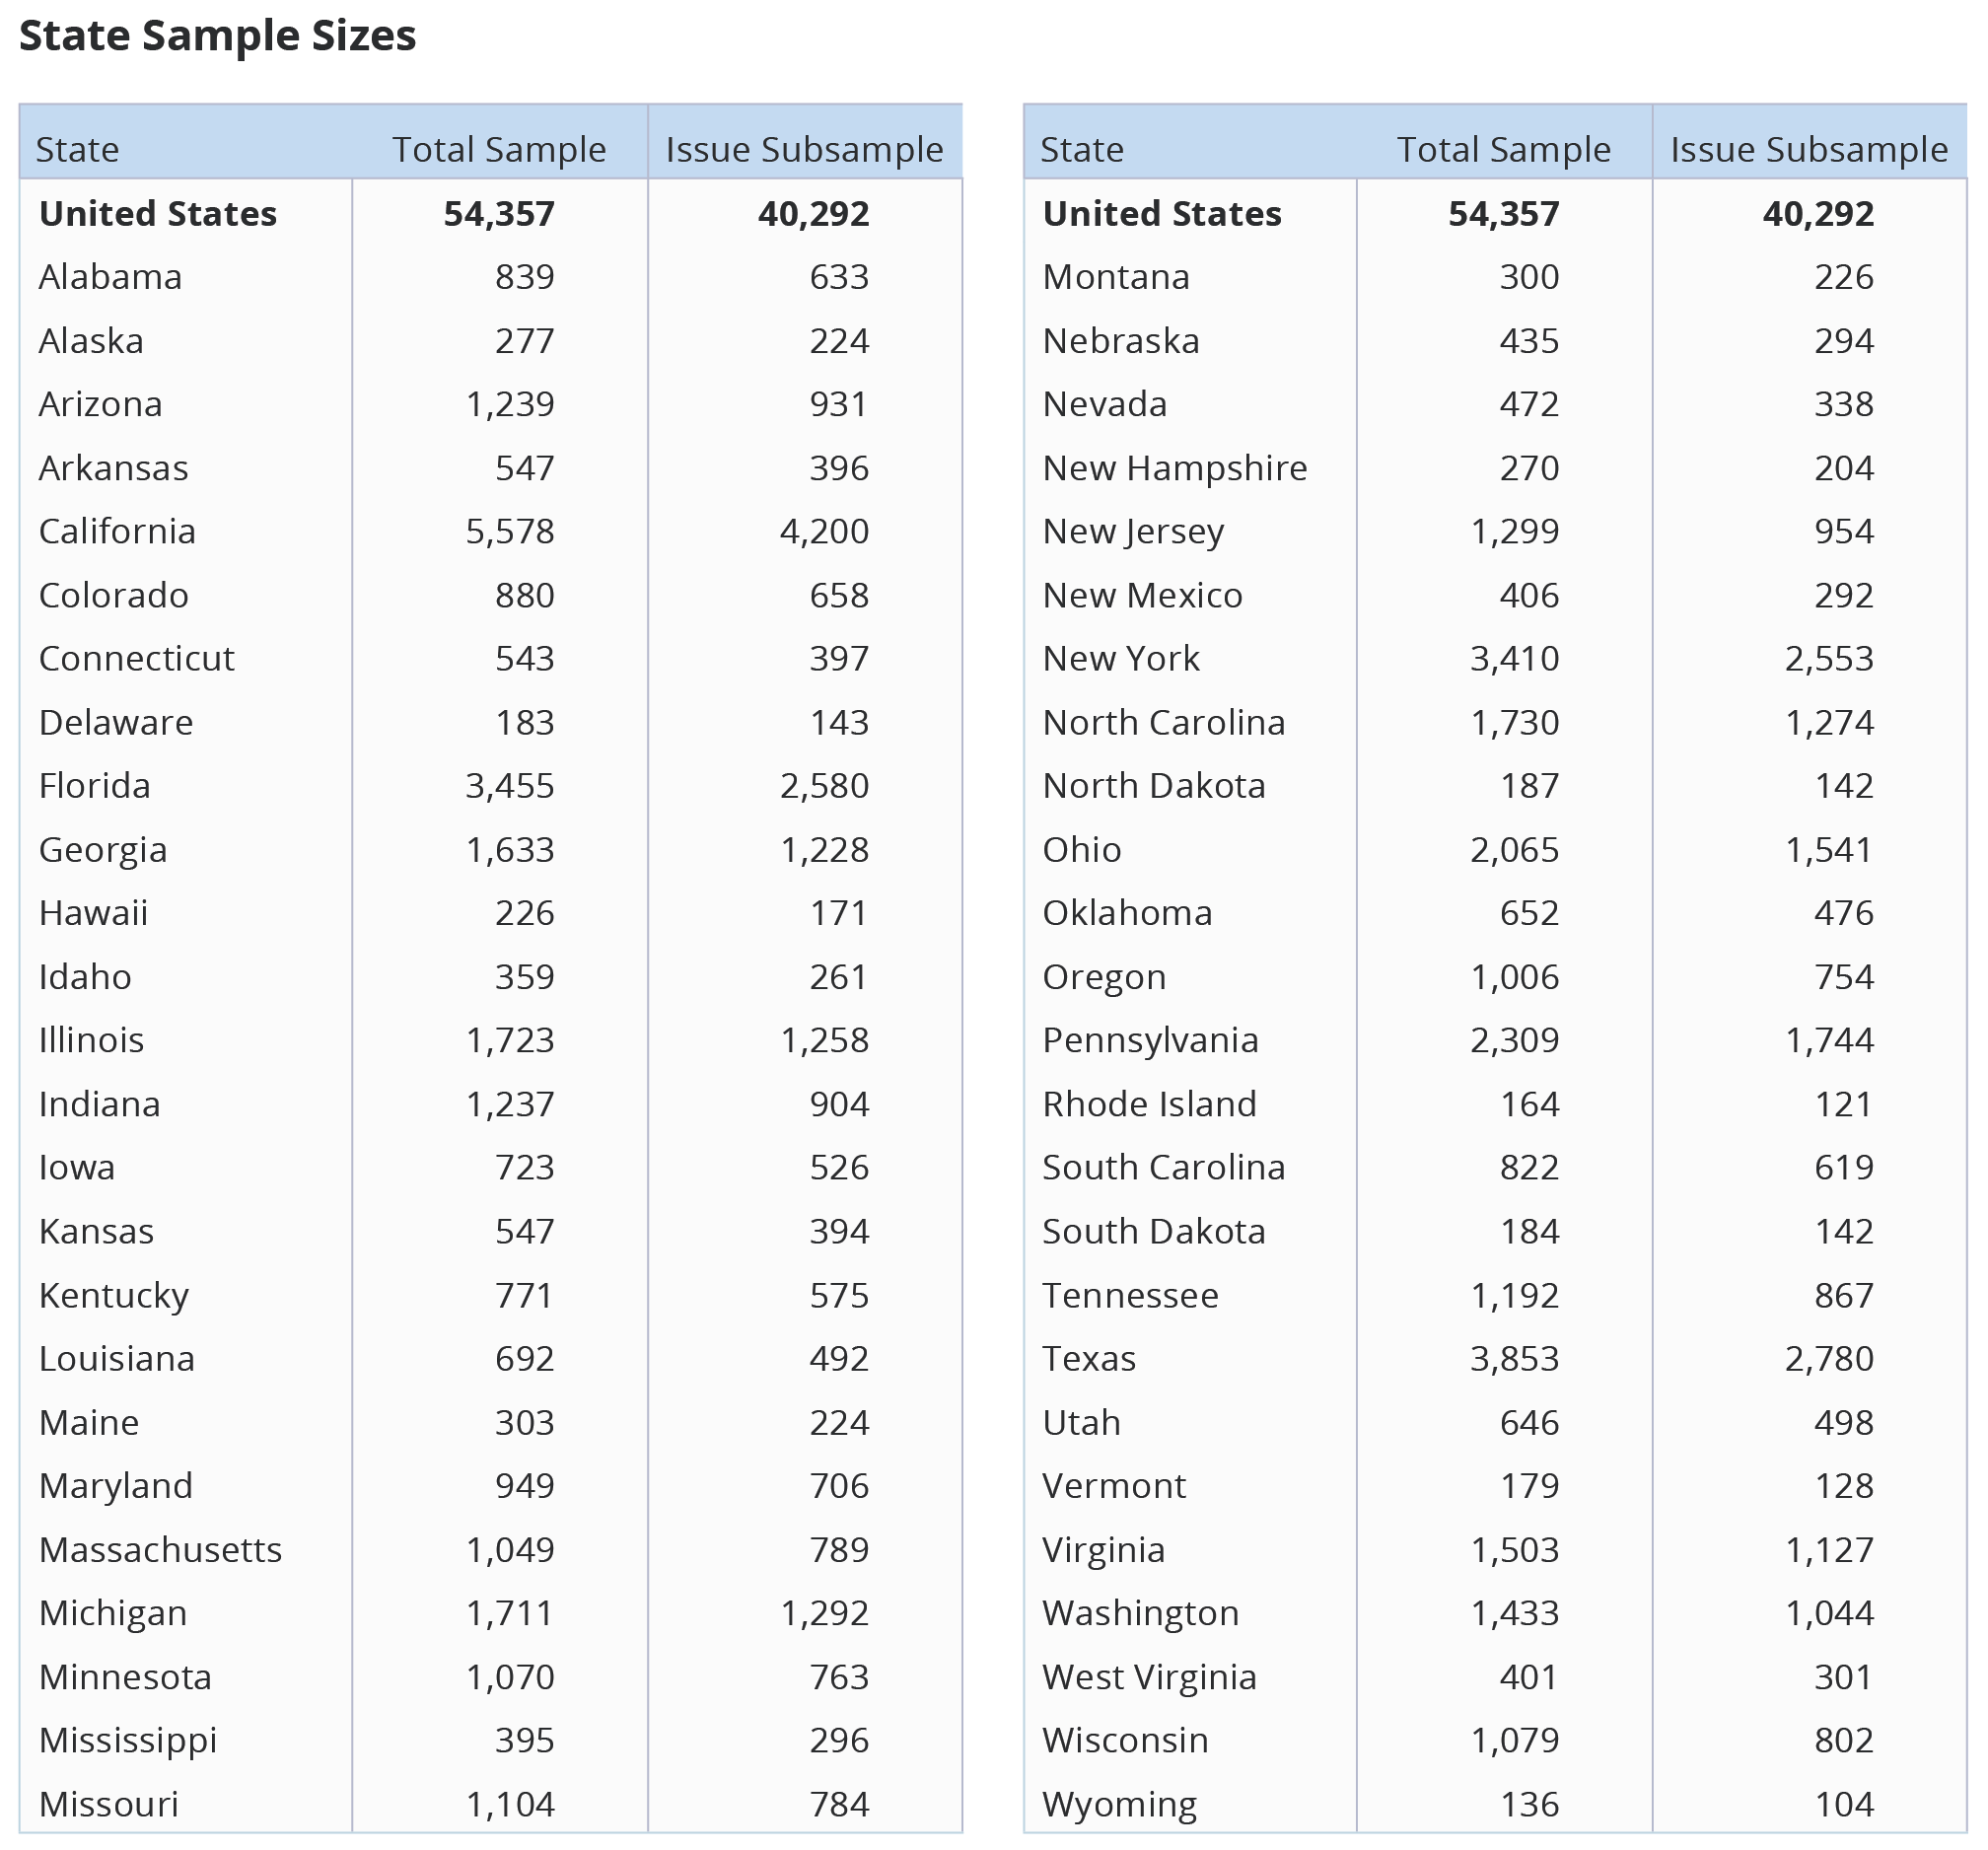
The table below shows the sample sizes for all 50 states and 30 metro areas for both sample and issue subsample. The margin of error for the total sample is +/- 0.4 percentage points at the 95% level of confidence. The margin of error for issue subsample is +/- 0.5 percentage points at the 95% level of confidence. The margin of error for the same-sex marriage question subsample is +/-1.5 percentage points at the 95% level of confidence. The design effect for the total sample, the issue subsample, and the same-sex marriage question subsample is 1.4. In addition to sampling error, surveys may also be subject to error or bias due to question wording, context, and order effects.
Endnotes
[1] PRRI American Values Atlas, 2015 and 2017. All references to 2015 and 2017 data in this report refer to these datasets. PRRI 2016 August Survey.
[2] PRRI 2014 LGBT Issues & Trends Survey; PRRI May 2013 Religion & Politics Survey; PRRI 2011 LGBT Survey. Survey in 2011 asked only about protections for employment.
[3] Sample size for Unitarian Universalists is under n=100; interpret results with caution.
[4] All trend analysis in this section refers to PRRI’s American Values Atlas datasets, 2015-2018.
[5] Sample size for Unitarian Universalists is under n=100; interpret results with caution.
[6] The question on same-sex marriage was not included in the full 2018 LGBT Issue Module for the American Values Atlas. Analysis of 2018 attitudes on same-sex marriage in this section is based on combined results (N=4,028) of two PRRI surveys: a survey of 2,020 respondents conducted in March 2018 and a survey of 2,008 respondents conducted in July 2018.
[7] Pew Research Center for The People & The Press and Pew Forum on Religion and Public Life, Religion and Public Life Survey, August 2007.
[8] PRRI/RNS 2011 LGBT Policy & Knowledge Survey.