Delayed Vehicle Maintenance | Q1 – Q2 2020
Each quarter, IMR interviews 25,000 households about how they’ve serviced and maintained all the vehicles in their household (IMR Vehicle Maintenance Tracking Study) and, equally as important, what service, maintenance and repairs they know their vehicle(s) need but intentionally have not performed. We classify these repairs as delayed maintenance.
Delayed maintenance increased to 20.1% in Q2 2020 or 2.5% from 17.6% in Q1 2020. While 2.5% may be a small number, it represents, approximately, an additional 8.5 million vehicles from the prior quarter that have knowingly put off a service or repair.
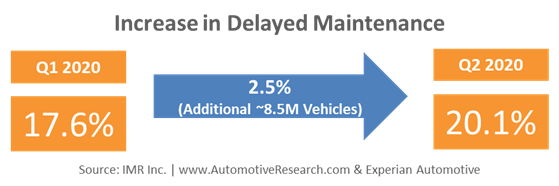
Since IMR began tracking delayed maintenance in 2016, the rate has slowly declined quarter over quarter from nearly 23.6% of vehicles reporting one or more service or repairs delayed to 17.6% in Q1 2020. That steady decline in delayed maintenance was clearly interrupted as we entered Q2 2020 with the shelter-in place orders and as we watched miles driven plummet.
Aftermarket Sweet Spot and Delayed Vehicle Maintenance
According to Experian Automotive, as of the March 30, 2020 Q1 US VIO data release, the Aftermarket sweet spot, vehicles between 6 and 12 years old, grew year over year for the first time in over 5 years. That sweet spot represents 31.5% of vehicles on the road and Experian expects continued growth amongst that vehicle cohort over the next 4+ years.
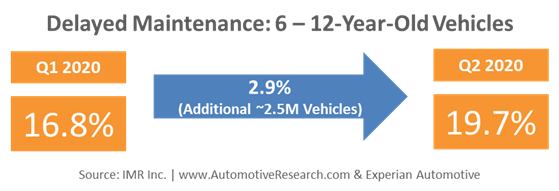
With that sweet spot of vehicles growing, coming out of the shelter-in place orders, while businesses begin to reopen and miles driven increase, there’s ample vehicle repair opportunity as households with those vehicles delayed maintenance at a rate of 19.7% in Q2 2020, up from 16.8% in Q1 2020.
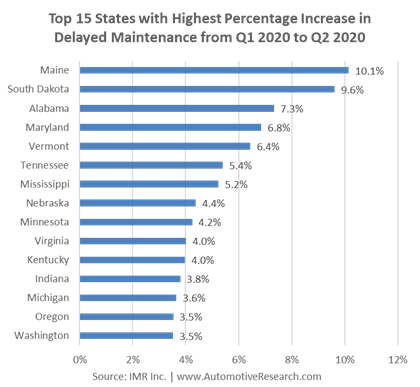
Delayed Maintenance by State
Compared to the Q2 2020 national rate for delayed maintenance of 20.1%, consumers in some states reported a higher rate of delaying maintenance than others.
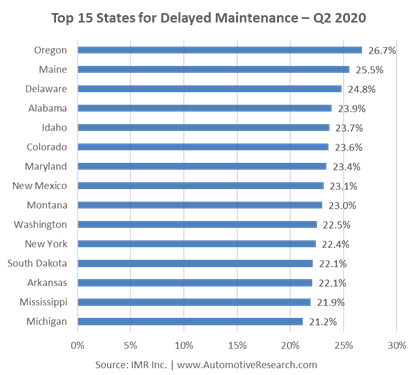
The chart below shows the percentage increase in delayed maintenance by state from the prior quarter. Some of the states with the highest rate of delayed maintenance (above) also saw some of the largest increases (below).
Top 10 Delayed Maintenance Categories
The Delayed Maintenance Tracking Study tracks 100 parts, services, and chemicals. Each can be evaluated on its own to garner category-based insights. When looking at the consumer intention regarding being a DIYer for the part/service they’ve delayed versus having their vehicle professionally repaired, 31.4% say they’re opting to be DIYers when the time comes to make the repair/perform the service. However, that number is typically driven by the categories which are experiencing the most delays. Some categories have seen a substantial pickup in DIY intention versus others.
The following categories are the top 10 categories for delayed maintenance, in order of highest percentage of vehicles delaying to lowest:
- Oil Changed
- Tires (New)
- Battery (Car)
- Scheduled Maintenance
- Brake Shoes/Pads
- Brake Discs/Rotors/Drums
- Air Filter
- Other Collision, Paint or Body Repairs
- Major/Minor Paint Work
- Wiper Blades
Coming to Market for Delayed Vehicle Service & Repairs
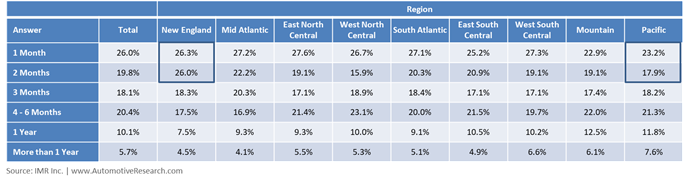
For those households that plan on having the delayed service/repair performed on their vehicle, their time to market is shown, below, in aggregate, by region of the country. In total, 45.8% plan to come to market within two months. However, that changes slightly by region. 52.3% of New Englanders plan to be in market within two months compared to 41.1% in the Pacific region.
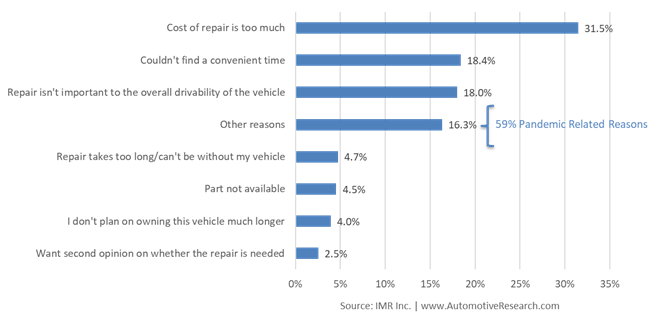
Why Vehicle Maintenance was Delayed
Historically, the top three reasons for consumers delaying maintenance has not changed position. However, there were significantly more ‘other reasons’. 59% of the ‘other reasons’ cited were related to the pandemic, shelter-in place orders, stores/shops being closed, etc.
Unemployment, miles driven, consumer confidence and other factors affect how consumers behave when making choices about maintaining their vehicles. As 2020 moves forward, IMR will continue to monitor changes in delayed maintenance, the consumer demographics most effected as well as monitor price sensitivity as well as DIY intention.
Learn More About In-Depth Consumer Demographics
Interested in automotive market research?
Call 630-654-1079 or submit a contact form to find out how IMR research can help your business.If you enjoyed this article, please check out some additional posts
Challenges for Independent Repair Shops and Technicians the Remainder of 2020 (COVID-19 Update)
Disruption in Auto Parts Availability Affecting Repair Shop Purchasing Behavior
Automotive Parts & Service Consumer Purchasing Behavior During an Economic Downturn
Challenges for Independent Repair Shops and Technicians in 2020
Cell Phone Usage in Bays at Independent Repair Shops
The Hispanic DIY Auto Maintenance & Repair Consumer
Consumers Delaying Vehicle Routine Maintenance
Part Delivery Times at Independent Automotive Repair Shops
Independent Auto Repair Shop Private Label/Store Brand Purchasing
Independent Auto Repair Shop’s Competitor Perceptions & Differentiation
Independent Auto Repair Shop’s Biggest Competitors
View IMR’s Automotive Research Infographics
How Repair Shops Are Investing
How Auto Repair Shops Perceive Their Competition
Cell Phone Usage in Bays at Independent Automotive Repair Shops
Insights Into the Hispanic DIY Automotive Maintenance & Repair Consumer Profile
Challenges for Independent Repair Shops and Technicians in 2020
Automotive Repair Shops Reveal Their Biggest Competitors
Auto Part Delivery Times at Independent Automotive Repair Shops
The Store-Brand Automotive Part Market
Aftermarket Sweet Spot, Consumer Vehicle Maintenance, COVID-19 Aftermarket Insights, COVID-19 Delayed Vehicle Maintenance, Delayed Vehicle Maintenance, DIFM Delayed Maintenance, DIY Delayed Maintenance, Vehicle Repair Opportunities