Examining the 2023 AEWR
TOPICS
Farm LaborAFBF Staff

photo credit: Mark Stebnicki, North Carolina Farm Bureau; used with permission.
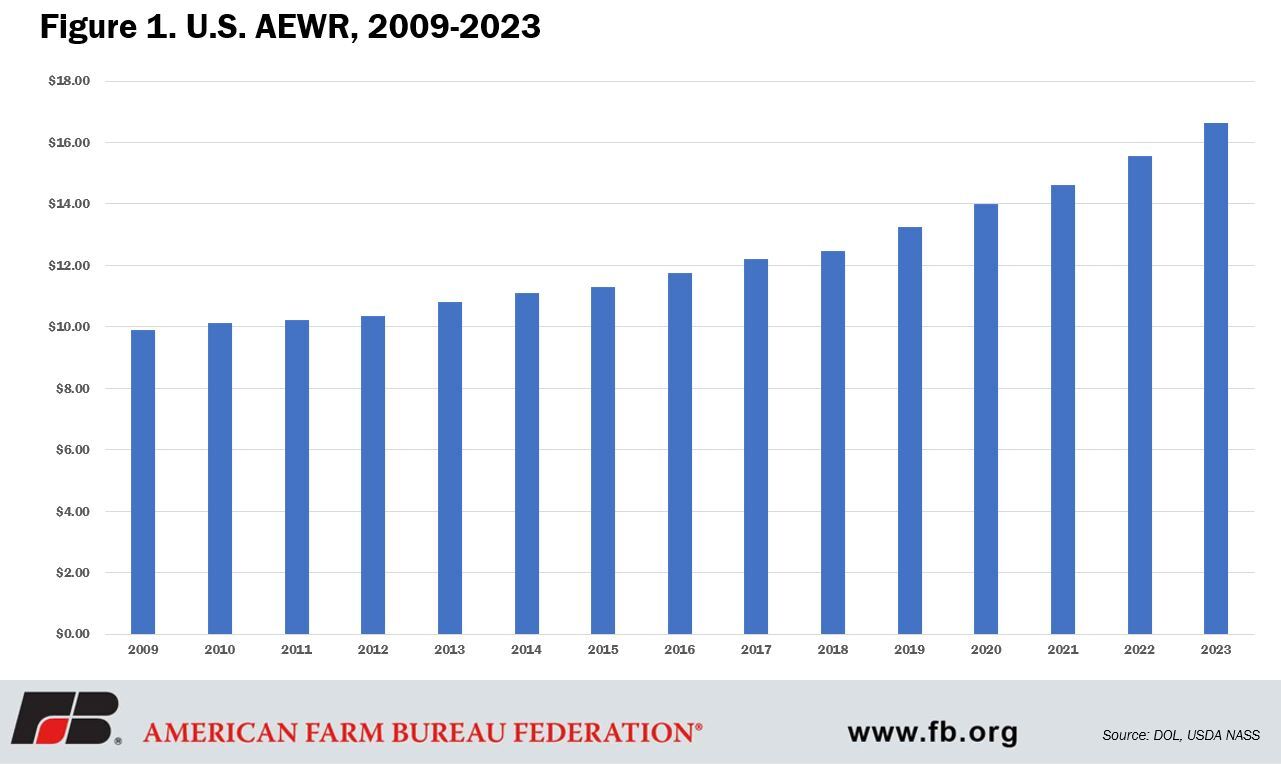
The week of Thanksgiving, USDA National Agricultural Statistics Service’s released the semi-annual Farm Labor Report. The report includes quarterly estimates of number of hired workers, average hours worked per worker and average hourly wage rates. The report also provides an annual weighted average hourly wage rate for field workers, field and livestock workers combined, and all hired workers, based on the quarterly estimates. Of utmost importance to users of the H-2A visa program, the field and livestock workers’ combined wage rate for 2022 contained in the FLR becomes the Adverse Effect Wage Rate utilized in the H-2A program in 2023. So, while the rates don’t become official until they are released by the Department of Labor in the Federal Register, usually around mid-December, the rates published in the FR are typically unchanged from what is published in the FLR. Given the overall tightness in the U.S. labor market, few would be surprised that the fiscal year 2022 U.S. average field and livestock workers’ combined wage rate rose, but the 6.8% fiscal year-over-fiscal year increase outpaced the 5.3% fiscal year-over-fiscal year growth in seasonally adjusted average hourly earnings of all private employees and will continue to put significant pressure on the bottom lines of farmers with significant labor needs.
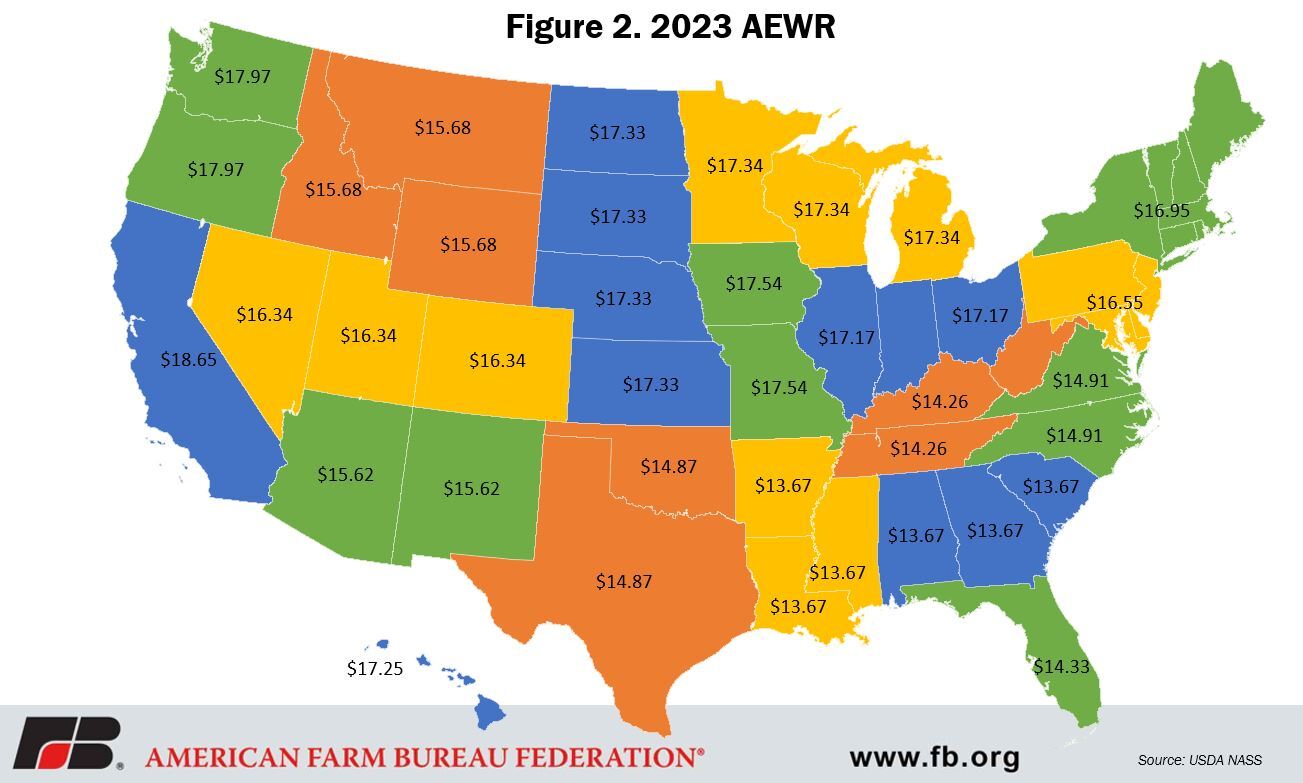
As mentioned above, the field and livestock workers’ combined wage rate is the basis for the AEWR, but the AEWR is not a national rate, rather it is set at the farm labor region as defined in the FLR. There are 15 farm labor regions, plus individual rates for California, Florida and Hawaii. So, while the 2022 U.S. average field and livestock workers’ combined wage rate was $16.62 per hour, up $1.06 per hour or 6.8% from 2021, there are considerable differences between regions. (For the purpose of this article the average field and livestock workers’ combined wage will be referred to as the wage rate.)
In 2023, every state will have an AEWR in excess of $13 per hour. Six states (Alabama, Georgia, South Carolina, Arkansas, Louisiana and Mississippi) will have an AEWR between $13.00 and $13.99. Eight states (Kentucky, Tennessee, West Virginia, Florida, Oklahoma, Texas, North Carolina and Virginia) will have an AEWR between $14.00 and $14.99. Five states (Arizona, New Mexico, Idaho, Montana and Wyoming) will have an AEWR between $15.00 and $15.99. Seventeen states (Colorado, Nevada, Utah, Delaware, Maryland, New Jersey, Pennsylvania, Connecticut, Maine, Massachusetts, New Hampshire, New York, Rhode Island and Vermont) will have an AEWR between $16.00 and $16.99. And sixteen states will have an AEWR in excess of $17.00 per hour (Illinois, Indiana, Ohio, Hawaii, Kansas, Nebraska, North Dakota, South Dakota, Michigan, Minnesota, Wisconsin, Iowa, Missouri, Oregon, Washington and California).
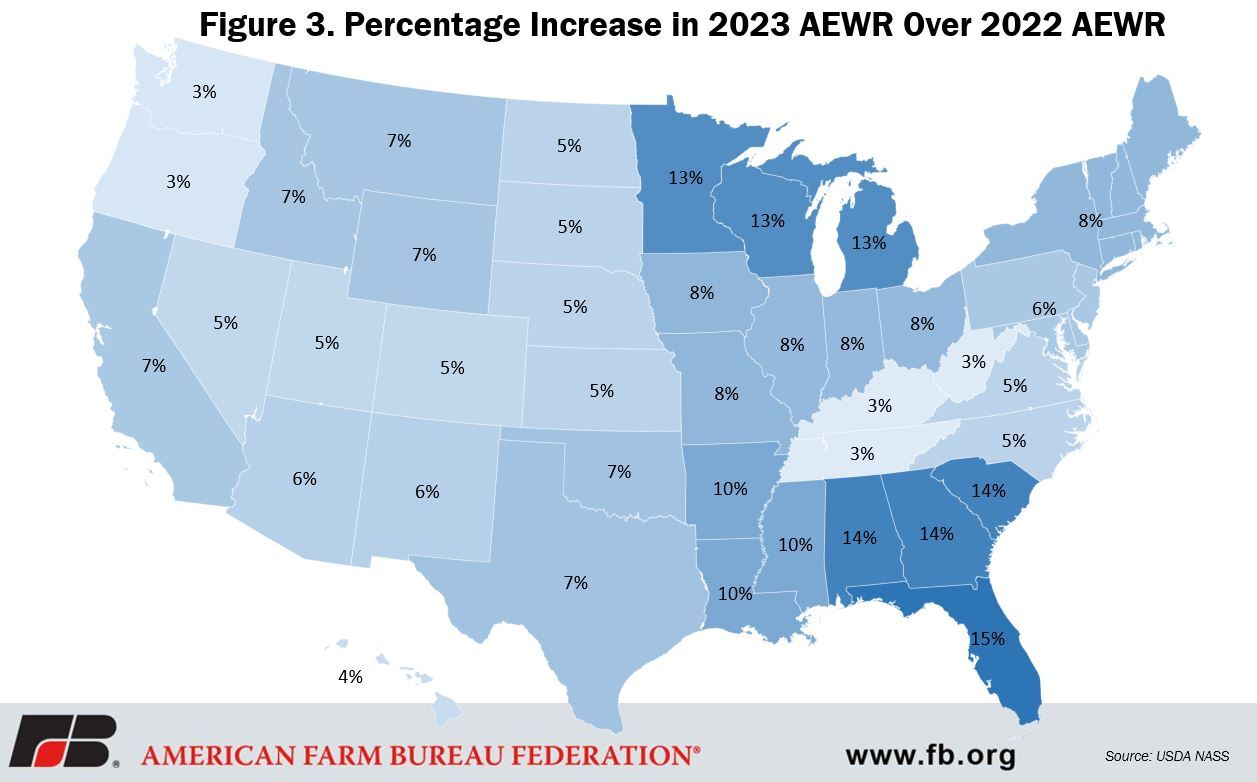
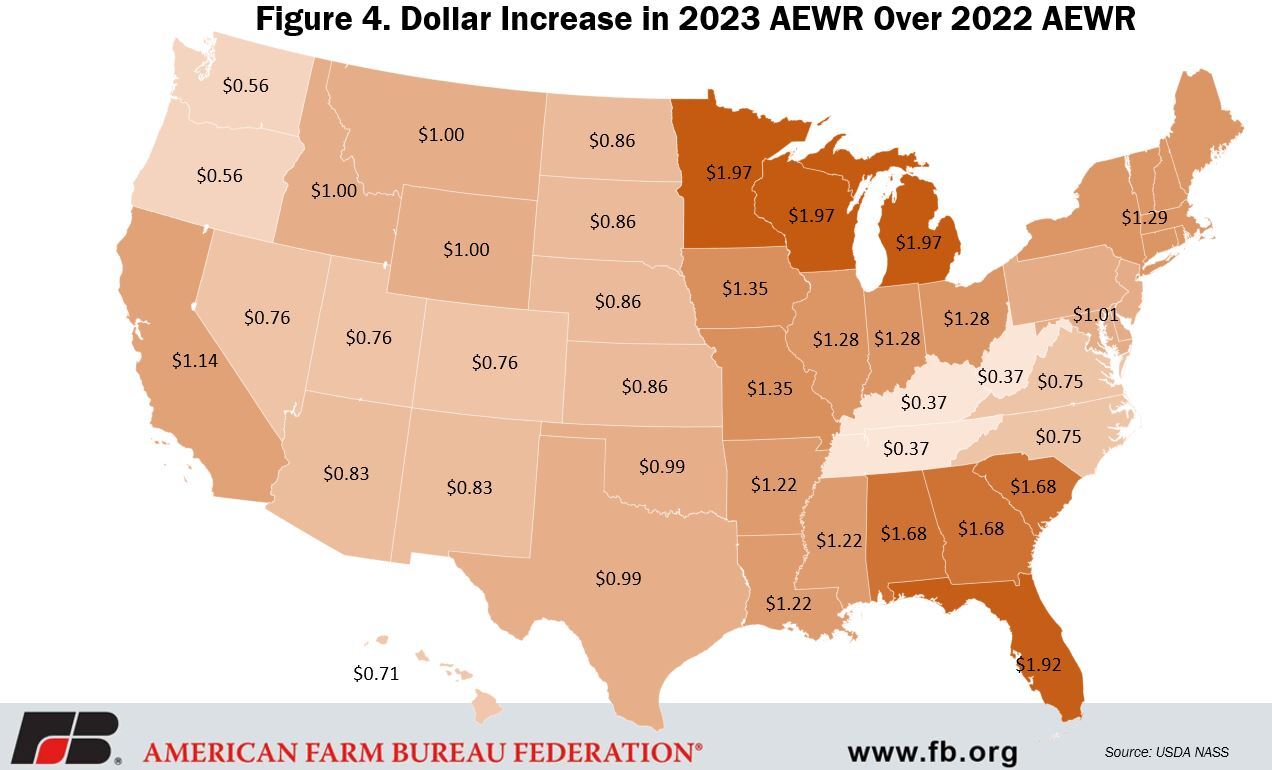
Unlike in 2021, every farm labor region and state experienced a higher average wage rate in 2022 and will subsequently have a higher AEWR in 2023. The Appalachian II region (Kentucky, Tennessee and West Virginia) had the smallest increase in terms of dollar per hour and percentage with a $0.37 per hour or 2.7% increase. Florida had the largest percentage increase – 15.5%. The Lake region (Michigan, Minnesota and Wisconsin) had the largest increase in dollar terms – $1.97 per hour. Once again in 2022, California had the highest overall wage rate at $18.65 per hour.
Conclusion
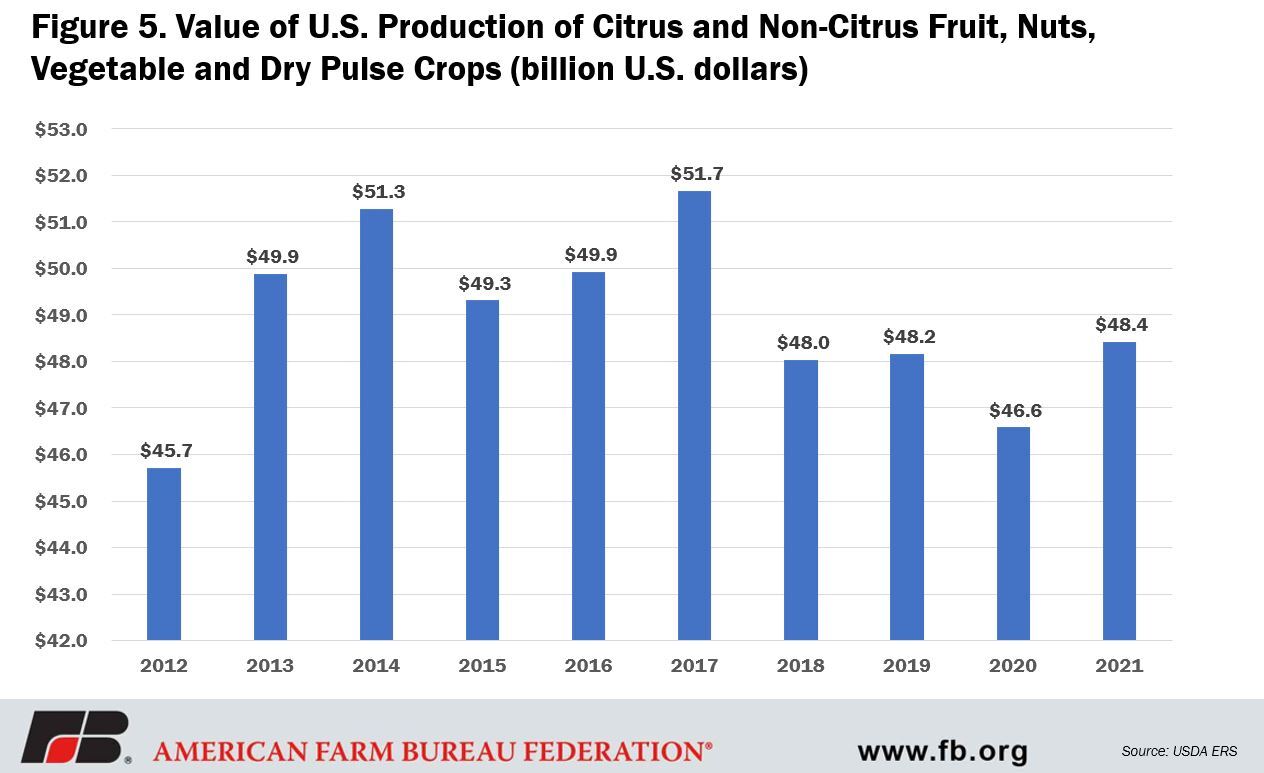
While the H-2A program is utilized by farmers and ranchers across the U.S. for a variety of seasonal or temporary farm work, it is most closely associated with the fruit and vegetable sector, often short-handed to specialty crops. Like all other farmers and ranchers, specialty crop growers face a 2023 growing season filled with increased input costs from diesel fuel, electricity, seeds, fertilizer, cash rent to interest rates, just to name a few. With the release of the FLR we now know that labor costs will also be rising. With labor costs accounting for up to 38.5% of total production expenses in the fruit and tree nuts sector and 28.5% in the vegetable and melons sector (Castillo et al., 2021), this increase is no small part of the budget. Meanwhile, the value of U.S. production of citrus and non-citrus fruit, nuts, vegetable and dry pulse crops in 2021 at $48.4 billion was largely constant over the last four years. 2023 is shaping up to be another challenging growing season.