Nationwide Home-Flipping Rate Declines Following Year of Increases; Raw Profits on Home Flips Jump to New High; Typical Profit Margins on Flips Reverse Extended Downturn but Remain Low
IRVINE, Calif. – Sept. 22, 2022 — ATTOM, a leading curator of real estate data nationwide for land and property data, today released its second-quarter 2022 U.S. Home Flipping Report showing that 115,198 single-family houses and condominiums in the United States were flipped in the second quarter. Those transactions represented 8.2 percent of all home sales in the second quarter of 2022, or one in 12 transactions. The latest portion was down from 9.7 percent, or one in every 10 home sales, in the nation during the first quarter of 2022, but still up from 5.3 percent, or one in 19 sales, in the second quarter of last year.
Despite the decline, the home-flipping rate during the second quarter of this year still stood at the third-highest level since 2000, below the high point registered in the first quarter of 2022.

“The second quarter was another strong showing for fix-and-flip investors. The total number of properties flipped was the second-highest total we’ve recorded in the past 22 years, and the median sales price of a flipped property – $328,000 – was the highest ever,” said Rick Sharga, executive vice president of market intelligence for ATTOM. “The big question is whether the fix-and-flip market will begin to lose steam as overall home sales have declined dramatically over the past few months, and the cost of financing has virtually doubled over the past year.”
Among all flips nationwide, the gross profit on typical transactions (the difference between the median purchase price paid by investors and the median resale price) hit $73,700 in the second quarter of 2022. That was up 10 percent from $67,000 in the first quarter of 2022 and up 10.1 percent from $66,944 in the second quarter of 2021.
Typical profit margins, meanwhile, rose during the second quarter of this year after six straight periods when they had fallen or virtually stayed the same. The typical gross-flipping profit of $73,700 in the second quarter of 2022 translated into a 29 percent return on investment compared to the original acquisition price. While that remained down from 33 percent a year earlier – and far below the peak of 53.1 percent this century, which hit in 2016 – the latest margin was up from 25.8 percent in the first quarter of 2022.

Profit margins improved in the second quarter of 2022 as median resale prices trends on flipped homes improved compared to what was happening when investors were buying homes.
Specifically, in the second quarter of 2022, the typical resale price on flipped homes reached another all-time high of $328,000. That was up slightly from $327,000 in the first quarter of 2022 and 21.5 percent from $270,000 a year earlier.
The quarterly gain, while tiny, was better than the 2 percent decline in prices that investors were seeing when they originally bought their properties. The price-change gap between buying and selling resulted in profit margins going up from the first to the second quarter of 2022.
The latest trends reflect a segment of the housing market that remained busier than usual in the second quarter but also continued to earn relatively weak profits that fell well beneath the broader market’s performance.
Home flipping rates drop in 80 percent of local markets
Home flips as a portion of all home sales decreased from the first quarter of 2022 to the second quarter of 2022 in 161 of the 202 metropolitan statistical areas around the U.S. analyzed for this report (80 percent). Rates mostly were down by less than percentages points. (Metro areas were included if they had a population of 200,000 or more and at least 50 home flips in the second quarter of 2022.)
Among those metros, the largest flipping rates during the second quarter of 2022 were in Tucson, AZ (flips comprised 14.5 percent of all home sales); Phoenix, AZ (14.1 percent); Jacksonville, FL (13.8 percent); Atlanta, GA (13.6 percent) and Gainesville, GA (13.5 percent).
Aside from Tucson, Phoenix, Jacksonville and Atlanta, three other metro areas with a population of more than 1 million ranked in the top 10 for highest flipping rates in the second quarter. They were Charlotte, NC (13.1 percent); Tampa, FL (12.2 percent) and San Antonio, TX (11.9 percent).
The smallest home-flipping rates among metro areas analyzed in the second quarter were in Honolulu, HI (1.7 percent); Hilo, HI (3.1 percent); Wichita, KS (3.5 percent); Bremerton, WA (4 percent) and Seattle, WA (4.3 percent).
“Fix-and-flip activity is mirroring overall housing market trends, with much of the activity, and the highest returns largely coming from the West and Southeast,” Sharga noted. “In fact, even though the highest gross profits came from the most expensive states, 14 of the 18 states where flips accounted for a higher percentage of overall home sales than the national average were in the South, Southeast, and Western states.”
Typical home flipping returns rise in more than half of metro areas
The median $328,000 resale price of homes flipped nationwide in the second quarter of 2022 generated a gross flipping profit of $73,700 above the median investor purchase price of $254,300. That resulted in a typical 29 percent profit margin.
Profit margins increased from the first quarter of 2022 to the second quarter of 2022 in 122 of the 202 metro areas with enough data to analyze (60 percent), although they remained down since the second quarter of last year in 57 percent of the markets analyzed.
The biggest quarterly increases in profit margins came in Huntsville, AL (ROI up from 18.2 percent in the first quarter of 2022 to 84.5 percent in the second quarter of 2022); Tallahassee, FL (up from 42.1 percent to 94.6 percent); Buffalo, NY (up from 88.2 percent to 133.3 percent); Canton, OH (up from 22.8 percent to 63.9 percent) and Fort Smith, AR (up from 38.7 percent to 76.6 percent).
Markets with the largest returns on investment for typical home flips completed during the second quarter of 2022 were Buffalo, NY (133.3 percent return); Pittsburgh, PA (127.3 percent); Lake Charles, LA (125.5 percent); Scranton, PA (109.9 percent) and Harrisburg, PA (96 percent).
Aside from Buffalo and Pittsburgh, the largest investment returns in the second quarter among metro areas with a population of at least 1 million were in Philadelphia, PA (82.1 percent); Detroit, MI (77.8 percent) and Baltimore, MD (73.5 percent).
Metro areas with the smallest profit margins on typical home flips in the second quarter of 2022 were Tyler, TX (1.4 percent return); Jackson, MS (1.9 percent); Boise, ID (4.5 percent); Medford, OR (8.6 percent) and Lafayette, LA (9.7 percent).
Raw profits remain highest in western and northeastern regions, lowest in the South and Midwest
The highest raw profits on median-priced home flips in the second quarter of 2022, measured in dollars, remained concentrated in the West and Northeast. Sixteen of the top 20 were in those regions, led by San Jose, CA (typical gross profit of $292,500); San Francisco, CA ($250,000); Salinas, CA ($203,125); San Diego, CA ($177,000) and Seattle, WA ($174,999).
At the opposite end of the range, 17 of the 20 lowest raw profits on typical home flips were spread across the South and Midwest. The smallest were in Tyler, TX ($4,000); Jackson, MS ($5,223); Lafayette, IN ($15,518); Boise, ID ($20,133) and Lexington, KY ($23,500).
All-cash investing dips, but remains a majority of the flipping market
Nationwide, 60.3 percent of homes flipped in the second quarter of 2022 had been purchased by investors with cash. That figure was down from 63.2 percent in the first quarter of 2022 and from 60.9 percent in the second quarter of 2021. Meanwhile, 39.7 percent of homes flipped in the second quarter of 2022 had been bought with financing. That was up from 36.8 percent in the prior quarter and from 39.1 percent a year earlier.
Among metropolitan areas with a population of 1 million or more and sufficient data to analyze, those with the highest percentage of flips in the second quarter of 2022 that had been purchased with cash were in Buffalo, NY (80 percent), Detroit, MI (77.7 percent); Tucson AZ (76.4 percent); Cincinnati, OH (74.7 percent) and Cleveland, OH (74.5 percent).
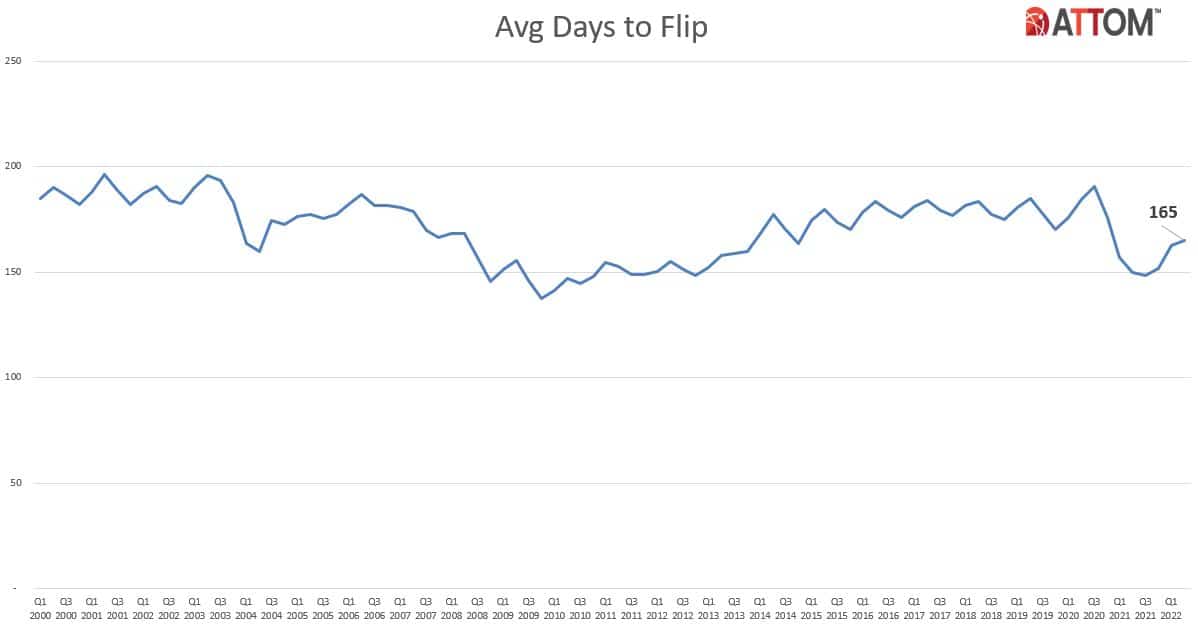
Average time to flip nationwide rises slightly again
The average time it took from purchase to resale on home flips rose to 165 days in the second quarter, marking the third quarterly increase in a row. While the latest figure was less the historical averages, it was up from 162 days in the first quarter of 2022 and from 150 in the second quarter of 2021.
Investor resales to FHA buyers drop to 15-year low
Of the 115,198 U.S. homes flipped in the second quarter of 2022, only 7.5 percent were sold to buyers using loans backed by the Federal Housing Administration (FHA). That was down from 7.9 percent in the prior quarter and from 7.6 percent in the second quarter of 2021, to the lowest quarterly mark since late 2007.
Among the 202 metro areas with a population of at least 200,000 and at least 50 home flips in the second quarter of 2022, those with the highest percentage of flipped properties sold to FHA buyers — typically first-time home purchasers — were Modesto, CA (27.9 percent); Visalia, CA (25.9 percent); Lake Charles, LA (21.1 percent); Springfield, MA (19.9 percent) and Fort Smith, AR (18.1 percent).
One in five counties have home-flipping rate of at least 10 percent
Home flips accounted for at least 10 percent of all home sales in 256, or 22 percent, of the 1,168 counties around the U.S. with at least 10 flips in the second quarter of 2022. That was down from about a third of all counties with enough data to measure in the first quarter of 2021. The leaders in the second quarter of this year were Lumpkin County, GA (north of Atlanta) (21.5 percent); Douglas County, GA (outside Atlanta) (18.8 percent); McCurtain County, OK (north of Dallas, TX) (17.7 percent); Paulding County, GA (outside Marietta) (17.5 percent) and Screven County, GA (north of Savannah) (17.4 percent).
Report methodology
ATTOM analyzed sales deed data for this report. A single-family home or condo flip was any arms-length transaction that occurred in the quarter where a previous arms-length transaction on the same property had occurred within the last 12 months. The average gross flipping profit is the difference between the purchase price and the flipped price (not including rehab costs and other expenses incurred, which flipping veterans estimate typically run between 20 percent and 33 percent of the property’s after-repair value). Gross flipping return on investment was calculated by dividing the gross flipping profit by the second sale (purchase) price.
About ATTOM
ATTOM provides premium property data to power products that improve transparency, innovation, efficiency and disruption in a data-driven economy. ATTOM multi-sources property tax, deed, mortgage, foreclosure, environmental risk, natural hazard, and neighborhood data for more than 155 million U.S. residential and commercial properties covering 99 percent of the nation’s population. A rigorous data management process involving more than 20 steps validates, standardizes, and enhances the real estate data collected by ATTOM, assigning each property record with a persistent, unique ID — the ATTOM ID. The 30TB ATTOM Data Warehouse fuels innovation in many industries including mortgage, real estate, insurance, marketing, government and more through flexible data delivery solutions that include bulk file licenses, property data APIs, real estate market trends, property navigator and more. Also, introducing our newest innovative solution, that offers immediate access and streamlines data management – ATTOM Cloud.
Media Contact:
Christine Stricker
949.748.8428
christine.stricker@attomdata.com
Data and Report Licensing:
949.502.8313


