

May 26, 2021


The authors thank Karen Conner, Sarah Rawlins, and Matt Sedlar for editorial assistance.
President Biden has indicated his intention to promote policies that radically reduce greenhouse gas emissions to limit damage to the environment from climate change. This implies a substantial reduction in the use of fossil fuels in the coming decades.
Cutbacks in the use of oil and natural gas will inevitably lead to job loss in these industries. This study projects the amount of displacement that can reasonably be anticipated. It breaks down these projections into the loss of jobs where skills can be readily transferred, (for example, accountants and salespeople) and the loss of jobs where the skills are largely industry specific (such as oil field roustabouts). The study also attempts to put this projected job loss in a context that makes it more meaningful. Specifically, it compares these projected annual losses to the jobs lost in manufacturing during the rise of the trade deficit between 2000 and 2007, and to the normal amount of job loss the economy sees in a day.
These comparisons show that even assuming an aggressive schedule of phasing out these fossil fuel industries over two decades, the annual job loss will be an order of magnitude smaller than the average number of jobs lost in manufacturing between each year between 2000 and 2007. The projected annual job loss will also be less than the number of workers that employers typically fire or lay off in a single day.
The starting point for these calculations is the number of people employed in the oil and gas industries in 2019. The year 2019 was selected instead of 2020 to avoid distortions from the extraordinary impact of the pandemic-related recession. The first column of Table 1 shows total employment in the nine industries that are primarily involved in the drilling, processing, and distribution of oil and natural gas.
| Total Employment | Workers with Nontransferable Skills | ||
|---|---|---|---|
| (percent) | |||
| Oil and gas extraction | 143,600 | 33.5 | 48,106 |
| Support activities – for oil and gas operations | 270,000 | 75.5 | 203,850 |
| Oil and gas pipeline construction | 171,300 | 81.1 | 138,924 |
| Mining and oil and gas field machinery | 69,600 | 61.7 | 42,943 |
| Petroleum refineries – manufacturing | 68,800 | 65.7 | 45,202 |
| Petroleum merchant wholesalers | 104,000 | 44.6 | 46,384 |
| Pipeline transportation | 51,500 | 63.1 | 32,497 |
| Fossil fuel power generation | 83,100 | 57.8 | 48,032 |
| Natural gas distribution | 110,100 | 44.1 | 48,554 |
| Total oil and gas | 1,072,000 | 61.1 | 654,492 |
Source: Bureau of Labor Statistics, Current Employment Situation.
The total number of workers employed in these industries in 2019 was 1,027,000, approximately 0.7 percent of total payroll employment in 2019.1 (In 2020, employment in these industries dropped by 123,000 to 949,000.)
The next step is to determine the percentage of workers in each industry who had jobs with skills that were not transferable. The Bureau of Labor Statistics’ National Employment Matrix-Industry has detailed data on the occupational breakdown for each industry. This series was used to determine which workers were likely to have skills that were largely industry-specific and which workers had skills that could probably be transferable to other sectors if they lost their jobs in the fossil fuel industry. The breakdown of occupations is shown in Table 2, which also indicates which occupations were treated as having transferable skills. (The appendix gives the basis for the calculation of the number of jobs with nontransferable skills in each industry.)
| (thousands) | |
|---|---|
| Employment | |
| Management occupations | 77,191 |
| Business and financial operations occupations | 71,621 |
| Computer and mathematical operations | 24,674 |
| Architecture and engineering operations | 63,048 |
| Life, physical, and social science operations | 24,799 |
| Legal occupations | 4,617 |
| Arts, design, entertainment, sports, and media occupations | 4,356 |
| Protective service operations | 1,682 |
| Building and grounds cleaning and maintenance occupations | 2,633 |
| Sales and related occupations | 39,166 |
| Office and administrative support occupations | 102,347 |
| Construction and extraction occupations | 276,897 |
| Installation, maintenance, and repair occupations | 117,668 |
| Production occupations | 147,877 |
| Transportation and material moving occupations | 109,649 |
| Total nontransferable skills | 654,723 |
Source: Bureau of Labor Statistics, National Employment Matrix.
The breakdown between occupations treated as having transferable skills and those that do not largely falls along white-collar and blue-collar occupation categories. This breakdown is not exact, since there will be some white-collar occupations where skills may not be easily transferable. For example, a person who has worked as a salesperson in the fossil fuel industry for 20 years may find that their skills are not easily transferred to other sectors.
This also goes in the opposite direction. Many people employed in transportation occupations in the fossil fuel industry can likely find employment in transportation in other sectors if they lose their job in the fossil fuel industry. It is not that different driving a truck that carries parts for a pipeline than driving a truck that carries car parts or parts for windmills.
The breakdown in Table 2 shows that just over 655,000 of the jobs in the fossil fuel industry have nontransferable skills. By far, the largest category of workers with nontransferable skills is in construction and extraction occupations, accounting for more than 40 percent of the total. Even in this category, there are occupations such as welders and electricians, which involve skills that can likely be transferred easily to other industries.
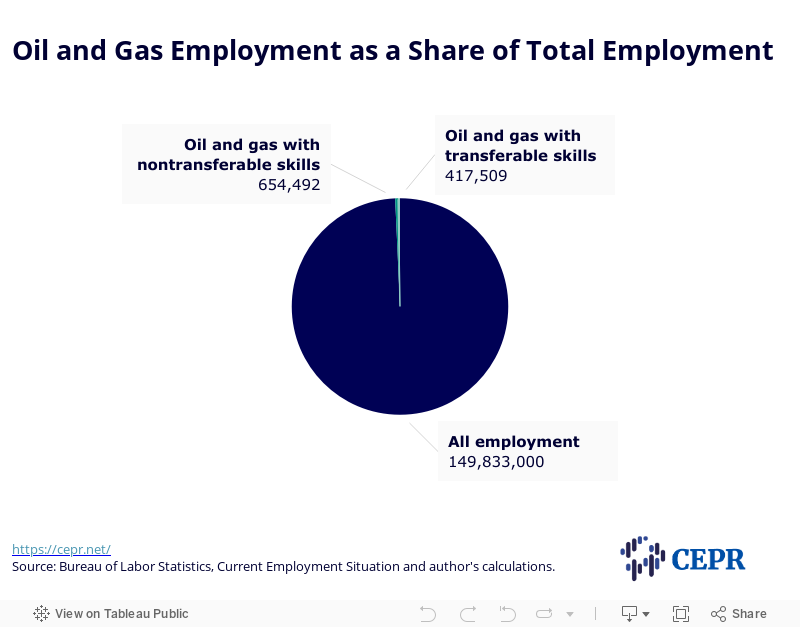
Employment in the oil and gas industries is not an especially large share of the economy. The 1,027,000 jobs in the industry in 2019 were less than 8.5 percent of the people employed in the restaurant industry in 2019. It was less than 6.6 percent of employment in the retail sector, and 6.3 percent of employment in health care. Relative to the economy as a whole, the jobs in the fossil fuel industry were less than 0.7 percent of total employment in 2019, with the jobs with nontransferable skills being 0.43 percent of total employment. This is shown in Figure 1.
Figure 1
If the Biden administration moves aggressively towards shifting towards clean energy, the jobs in the fossil fuel industry will be eliminated over time. If fossil fuel consumption was largely eliminated over a 20-year period (an extreme scenario), it would imply a loss of an average of 53,600 jobs annually over this period. If the jobs with nontransferable skills were eliminated at the same pace, the loss would be 32,700 a year.
To get an idea of how large a disruption this rate of job loss is, it is worth comparing it to other sources of job loss. An obvious basis of comparison is the job loss in manufacturing that the United States experienced between 2000 and 2007, primarily due to the growth of the trade deficit. Over the seven years from December of 2000 to December of 2007, the country lost 3,435,000 manufacturing jobs, just under 20 percent of the total. This comes to an average job loss of 491,000 a year (See Figure 2).
The reason for selecting December of 2007 as an endpoint is that is the month the Great Recession started. In other words, this job loss in manufacturing is all pre-Great Recession. The economy lost another 2,293,000 manufacturing jobs by the trough of the Great Recession in February of 2010, for a total of 5,728,000 jobs. (1,346,000 Of these jobs were regained by February of 2020 before the pandemic hit.) If we looked at manufacturing job loss from December of 2000 to the Great Recession trough, the average pace would be 625,000 a year (See Figure 2).
Figure 2
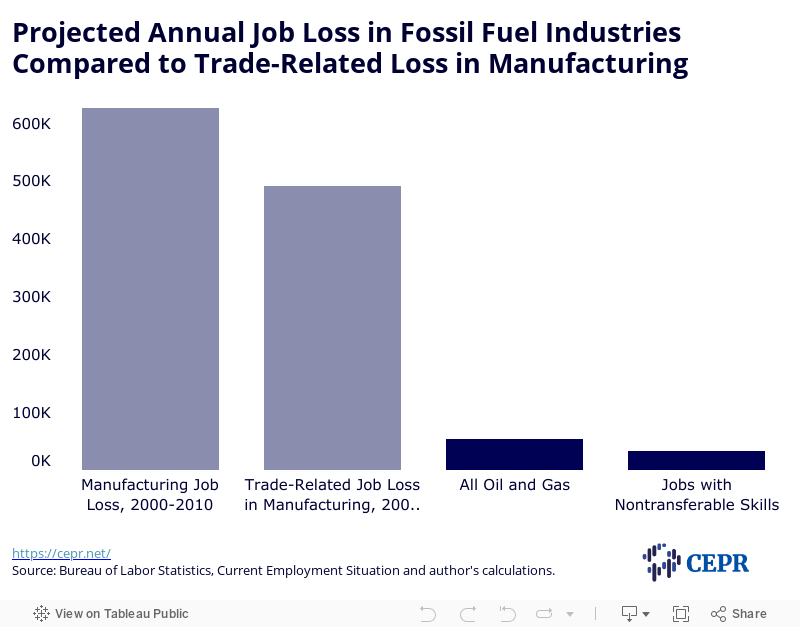
As can be seen in the comparisons in Figure 2, the annual job loss in manufacturing over the years 2000 to 2007 was almost 10 times as large as the projected job loss in the oil and gas industries, if they are phased out over 20 years. The rate of job loss from 2000 to the trough of the Great Recession was more than 12 times as large. If we use the rate of loss of jobs with nontransferable skills as the base of comparison, the annual rate of job loss in manufacturing from 2000 to the 2010 trough of the recession was almost 20 times as large.
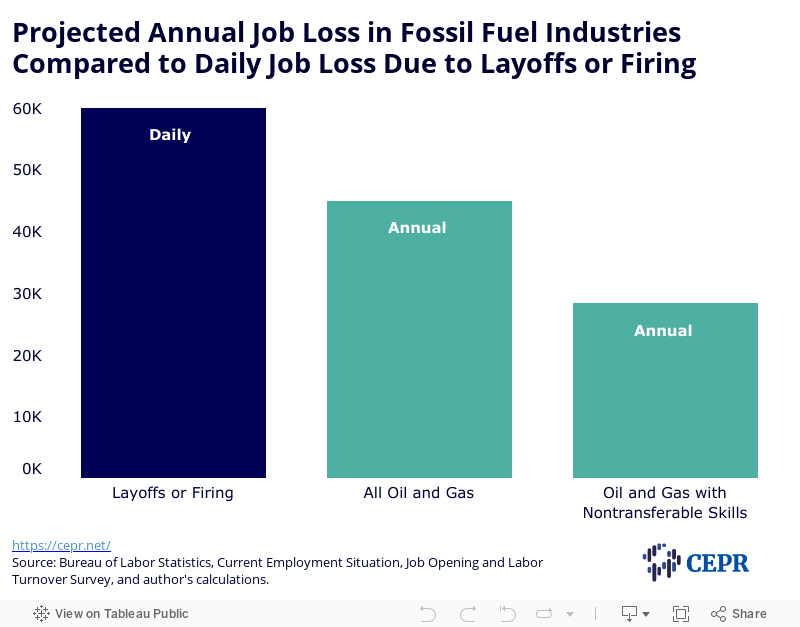
Another useful base of comparison is the number of people who reported losing their job through either layoffs or firings every month. The Bureau of Labor Statistics Job Opening and Labor Turnover Survey (JOLTS) provides monthly data on the number of people who lose their job either through layoff or firing. In 2019, a total of 21,850,000 workers were either laid off or fired. This comes to an average of just under 60,000 workers a day. This daily rate of job loss is more than 10 percent higher than the annual rate of projected job loss in the fossil fuel industry. It is more than 80 percent higher than the annual rate of job loss of jobs with nontransferable skills. This comparison is shown in Figure 3.
Figure 3
There are three reasons why the figures in the table could overstate the size of the job loss resulting from an aggressive move away from fossil fuels. The first reason is the assumption of a 20-year phaseout period is a very ambitious pace for reducing greenhouse gas emissions. While a rapid phaseout is desirable from the standpoint of limiting the damage from climate change, it is likely that it will take longer than 20 years to move the country away from fossil fuels. If we assume, for example, that a phase out takes place over 30 years, then the annual rate of job loss would be one-third less than the numbers shown in Figures 1-3.
The second reason is that 2019 was chosen as the base year to exclude the impact of the pandemic recession. In 2020, employment in fossil fuel industries fell by 123,000 to 949,000. While some of these jobs will come back as the economy moves out of recession in 2021, it is likely that many will not. If 2020 was used as the basis for comparisons, then the annual job loss would be 11.5 percent smaller than the numbers shown in Figures 1-3. If we assumed that half the jobs lost in the pandemic recession come back, then the annual job loss would be 5.8 percent less than indicated in these figures. That would translate into an annual job loss of 47,400 industry jobs overall, and 29,000 jobs with nontransferable skills.
The final reason is a question of how we think about the job loss implied by these calculations. There are a large number of people who leave their jobs voluntarily. According to the JOLTS data cited above, in 2019, 25.5 percent of workers quit their jobs voluntarily. In the mining industry, the figure was 24.6 percent.2 (Some workers left more than one job over the course of the year, so these figures would count some individuals more than once.)
People choose to leave their jobs for a wide variety of reasons. Some may change jobs within the industry. Others may look to leave the industry altogether. Some workers get injured on the job and may have to look for work in a different industry for this reason. And, workers retire. If workers in the oil and gas industry have 30-year careers on average, that would mean 3.3 percent retire in a normal year. If the industry is shedding 5 percent of its jobs each year over a 20-year period, that would not be much faster than the pace at which workers retire.
This does not mean that the job loss from a 20-year phaseout of fossil fuel use can be entirely met by retirements without any workers being laid off. There will invariably be cases where a refinery or power plant is closed, and all the workers are laid off, which will almost certainly include many workers who are not ready for retirement.
But this calculation does give us some perspective on the size of the prospective job loss from phasing out fossil fuel consumption. It should be possible to meet most of the loss of jobs in the sector through retirements and other voluntary quits. The workers who are laid off due to cutbacks will be the exception.
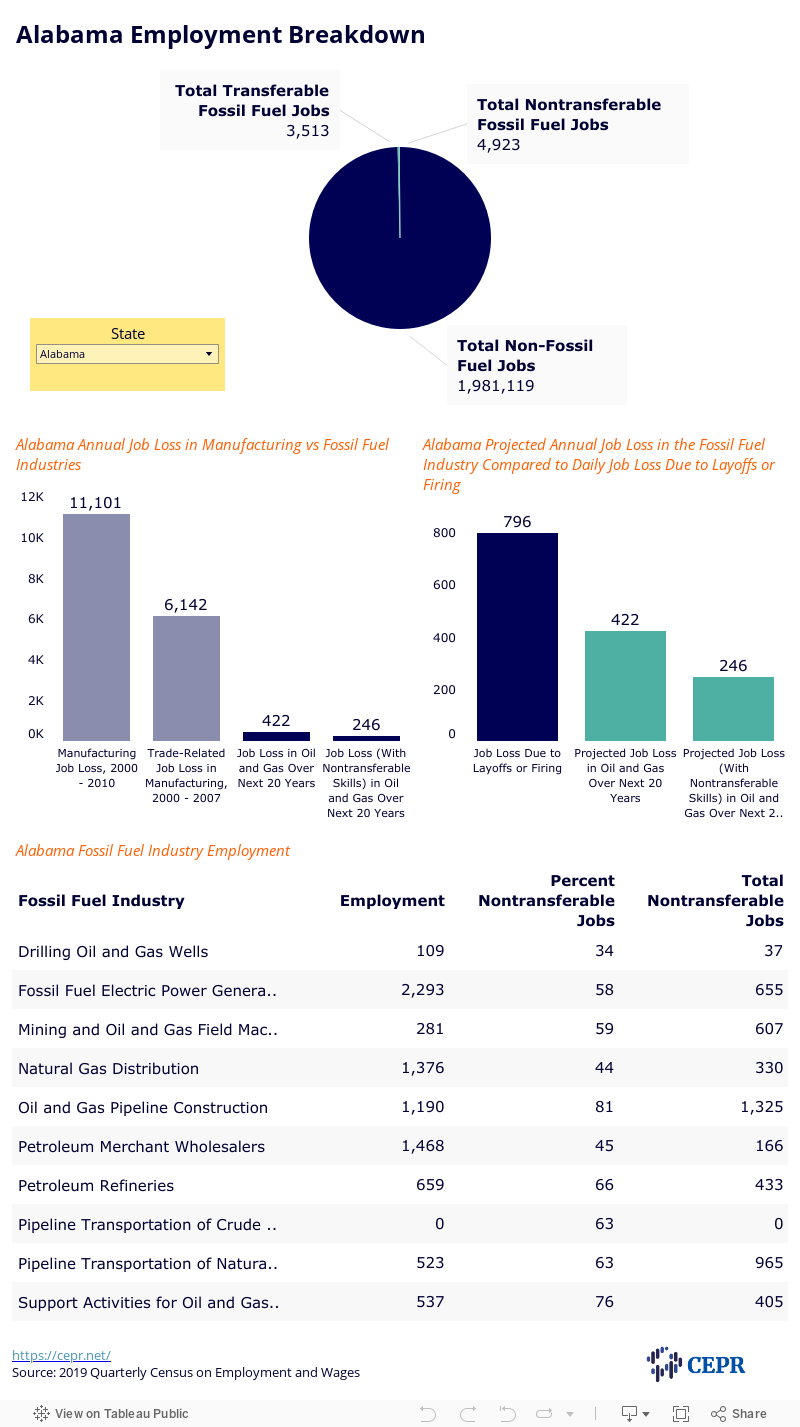
The next section shows the potential impact of a 20-year phaseout of fossil fuel use for each of the 50 states and the District of Columbia. It applies the same methodology for each state as for the national data, relying on the Quarterly Census of Employment and Earnings for state level employment in each industry.
The state level calculations apply the same percentage for the number of workers with nontransferable skills in each industry as the national calculations since the data on the occupational mix is not available at the state level. There clearly will be some difference in the occupational mix by state, but the national mix should provide a reasonable approximation. The state level calculations use the actual loss of manufacturing jobs in the state from January 2002 to both December 2007 and February 2010, as a basis for comparison with the projected job loss in the fossil fuel industry.
The daily job loss calculated due to layoffs and firing is calculated a percentage of average employment in the state in 2019 based on the national JOLTS data. These data are not publicly available at the state level.
The calculations for the percentage of workers who were in occupations with nontransferable skills are derived from the National Employment Matrix, which shows employment by occupation for each industry.
The occupations where skills were considered nontransferable are:
The National Employment Matrix only provides data for the utility system construction as a whole. Oil and gas utility system construction accounts for roughly one-third of this industry. The calculations assume that the breakdown by occupation for this portion of the industry is the same as for the industry as a whole.
The Current Employment Statistics series only gives employment data for the pipeline sector as a whole, while the National Employment Matrix breaks out occupational data separately for oil pipelines and natural gas pipelines. To combine these, the occupational breakdown was weighted by the employment in the two sectors as indicated in the National Employment Matrix (12,300 and 30,400, respectively).
| Employment | |||
|---|---|---|---|
| (percent) | |||
| Management occupations | 11.6 | 16,658 | |
| Business and financial operations occupations | 13.7 | 19,673 | |
| Computer and mathematical operations | 7.3 | 10,483 | |
| Architecture and engineering operations | 13.1 | 18,812 | |
| Life, physical, and social science operations | 6.3 | 9,047 | |
| Legal occupations | 1.9 | 2,728 | |
| Arts, design, entertainment, sports, and media occupations | 0.2 | 287 | |
| Protective service operations | 0.2 | 287 | |
| * | Building and grounds cleaning and maintenance occupations | 0.2 | 287 |
| Sales and related occupations | 2.1 | 3,016 | |
| Office and administrative support occupations | 10.1 | 14,504 | |
| * | Construction and extraction occupations | 14.5 | 20,822 |
| * | Installation, maintenance, and repair occupations | 3.9 | 5,600 |
| * | Production occupations | 6.4 | 9,190 |
| * | Transportation and material moving occupations | 8.5 | 12,206 |
Source and notes: Bureau of Labor Statistics, National Employment Matrix.
* indicates nontransferable
| Employment | |||
|---|---|---|---|
| (percent) | |||
| Management occupations | 6.4 | 10,963 | |
| Business and financial operations occupations | 2.7 | 4,625 | |
| Computer and mathematical operations | 0.4 | 685 | |
| Architecture and engineering operations | 1.3 | 2,227 | |
| Life, physical, and social science operations | 0.5 | 857 | |
| Legal occupations | 0.1 | 171 | |
| Arts, design, entertainment, sports, and media occupations | 0.0 | – | |
| Protective service operations | 0.2 | 343 | |
| * | Building and grounds cleaning and maintenance occupations | 0.2 | 343 |
| Sales and related occupations | 0.6 | 1,028 | |
| Office and administrative support occupations | 6.6 | 11,306 | |
| * | Construction and extraction occupations | 57.1 | 97,812 |
| * | Installation, maintenance, and repair occupations | 15.3 | 26,209 |
| * | Production occupations | 4.0 | 6,852 |
| * | Transportation and material moving occupations | 4.5 | 7,709 |
Source and notes: Bureau of Labor Statistics, National Employment Matrix.
* indicates nontransferable
| Employment | |||
|---|---|---|---|
| (percent) | |||
| Management occupations | 5.2 | 14,040 | |
| Business and financial operations occupations | 3.1 | 8,370 | |
| Computer and mathematical operations | 0.5 | 1,350 | |
| Architecture and engineering operations | 3.5 | 9,450 | |
| Life, physical, and social science operations | 2.6 | 7,020 | |
| Legal occupations | 0.2 | 540 | |
| Arts, design, entertainment, sports, and media occupations | 0.0 | – | |
| Protective service operations | 0.1 | 270 | |
| * | Building and grounds cleaning and maintenance occupations | 0.2 | 540 |
| Sales and related occupations | 2.4 | 6,480 | |
| Office and administrative support occupations | 6.9 | 18,630 | |
| * | Construction and extraction occupations | 49.4 | 133,380 |
| * | Installation, maintenance, and repair occupations | 7.9 | 21,330 |
| * | Production occupations | 5.4 | 14,580 |
| * | Transportation and material moving occupations | 12.6 | 34,020 |
Source and notes: Bureau of Labor Statistics, National Employment Matrix.
* indicates nontransferable
| Employment | |||
|---|---|---|---|
| (percent) | |||
| Management occupations | 6.4 | 4,403 | |
| Business and financial operations occupations | 5.4 | 3,715 | |
| Computer and mathematical operations | 1.2 | 826 | |
| Architecture and engineering operations | 9.1 | 6,261 | |
| Life, physical, and social science operations | 5.1 | 3,509 | |
| Legal occupations | 0.1 | 69 | |
| Arts, design, entertainment, sports, and media occupations | 0.2 | 138 | |
| Protective service operations | 0.2 | 138 | |
| * | Building and grounds cleaning and maintenance occupations | 0.2 | 138 |
| Sales and related occupations | 1.8 | 1,238 | |
| Office and administrative support occupations | 5.8 | 3,990 | |
| * | Construction and extraction occupations | 7.5 | 5,160 |
| * | Installation, maintenance, and repair occupations | 8.8 | 6,054 |
| * | Production occupations | 41.4 | 28,483 |
| * | Transportation and material moving occupations | 7.8 | 5,366 |
Source and notes: Bureau of Labor Statistics, National Employment Matrix.
* indicates nontransferable
| Employment | ||
|---|---|---|
| (percent) | ||
| Management occupations | 9.0 | |
| Business and financial operations occupations | 10.9 | |
| Computer and mathematical operations | 2.5 | |
| Architecture and engineering operations | 8.0 | |
| Life, physical, and social science operations | 2.2 | |
| Legal occupations | 0.1 | |
| Arts, design, entertainment, sports, and media occupations | 2.4 | |
| Protective service operations | 0.1 | |
| * | Building and grounds cleaning and maintenance occupations | 0.8 |
| Sales and related occupations | 1.1 | |
| Office and administrative support occupations | 8.1 | |
| * | Construction and extraction occupations | 5.6 |
| * | Installation, maintenance, and repair occupations | 12.8 |
| * | Production occupations | 23.7 |
| * | Transportation and material moving occupations | 14.0 |
Source and notes: Bureau of Labor Statistics, National Employment Matrix.
* indicates nontransferable
| Employment | ||
|---|---|---|
| (percent) | ||
| Management occupations | 8.0 | |
| Business and financial operations occupations | 7.6 | |
| Computer and mathematical operations | 2.0 | |
| Architecture and engineering operations | 8.5 | |
| Life, physical, and social science operations | 1.3 | |
| Legal occupations | 0.4 | |
| Arts, design, entertainment, sports, and media occupations | 0.3 | |
| Protective service operations | ||
| * | Building and grounds cleaning and maintenance occupations | |
| Sales and related occupations | 0.6 | |
| Office and administrative support occupations | 5.4 | |
| * | Construction and extraction occupations | 7.3 |
| * | Installation, maintenance, and repair occupations | 18.8 |
| * | Production occupations | 31.0 |
| * | Transportation and material moving occupations | 8.9 |
Source and notes: Bureau of Labor Statistics, National Employment Matrix.
* indicates nontransferable
| Employment | |||
|---|---|---|---|
| (percent) | |||
| Management occupations | 8.3 | 4,268 | |
| Business and financial operations occupations | 8.6 | 4,404 | |
| Computer and mathematical operations | 2.1 | 1,104 | |
| Architecture and engineering operations | 8.4 | 4,303 | |
| Life, physical, and social science operations | 1.6 | 803 | |
| Legal occupations | 0.3 | 161 | |
| Arts, design, entertainment, sports, and media occupations | 0.9 | 466 | |
| Protective service operations | 0.0 | 15 | |
| * | Building and grounds cleaning and maintenance occupations | 0.2 | 119 |
| Sales and related occupations | 0.7 | 383 | |
| Office and administrative support occupations | 6.2 | 3,182 | |
| * | Construction and extraction occupations | 6.8 | 3,507 |
| * | Installation, maintenance, and repair occupations | 17.1 | 8,792 |
| * | Production occupations | 28.9 | 14,882 |
| * | Transportation and material moving occupations | 10.4 | 5,340 |
Source and notes: Bureau of Labor Statistics, National Employment Matrix.
* indicates nontransferable
| Employment | |||
| (percent) | |||
| Management occupations | 7.8 | 6,482 | |
| Business and financial operations occupations | 8.3 | 6,897 | |
| Computer and mathematical operations | 3.9 | 3,241 | |
| Architecture and engineering operations | 8.0 | 6,648 | |
| Life, physical, and social science operations | 2.1 | 1,745 | |
| Legal occupations | 0.4 | 332 | |
| Arts, design, entertainment, sports, and media occupations | 0.3 | 249 | |
| Protective service operations | 0.5 | 416 | |
| * | Building and grounds cleaning and maintenance occupations | 0.2 | 166 |
| Sales and related occupations | 0.4 | 332 | |
| Office and administrative support occupations | 10.2 | 8,476 | |
| * | Construction and extraction occupations | 4.6 | 3,823 |
| * | Installation, maintenance, and repair occupations | 24.3 | 20,193 |
| * | Production occupations | 26.4 | 21,938 |
| * | Transportation and material moving occupations | 2.3 | 1,911 |
Source and notes: Bureau of Labor Statistics, National Employment Matrix.
* indicates nontransferable
| Employment | |||
|---|---|---|---|
| (percent) | |||
| Management occupations | 7.3 | 8,052 | |
| Business and financial operations occupations | 13.8 | 15,221 | |
| Computer and mathematical operations | 4.6 | 5,074 | |
| Architecture and engineering operations | 7.1 | 7,831 | |
| Life, physical, and social science operations | 0.8 | 882 | |
| Legal occupations | 0.4 | 441 | |
| Arts, design, entertainment, sports, and media occupations | 0.4 | 441 | |
| Protective service operations | 0.1 | 110 | |
| * | Building and grounds cleaning and maintenance occupations | – | |
| Sales and related occupations | 3.6 | 3,971 | |
| Office and administrative support occupations | 17.8 | 19,633 | |
| * | Construction and extraction occupations | 10.1 | 11,140 |
| * | Installation, maintenance, and repair occupations | 21.6 | 23,825 |
| * | Production occupations | 10.3 | 11,361 |
| * | Transportation and material moving occupations | 2.1 | 2,316 |
Source and notes: Bureau of Labor Statistics, National Employment Matrix.
* indicates nontransferable
| Employment | |||
|---|---|---|---|
| (percent) | |||
| Management occupations | 7.3 | 7,592 | |
| Business and financial operations occupations | 4.9 | 5,096 | |
| Computer and mathematical operations | 0.5 | 520 | |
| Architecture and engineering operations | 0.2 | 208 | |
| Life, physical, and social science operations | 0.7 | 728 | |
| Legal occupations | 0.1 | 104 | |
| Arts, design, entertainment, sports, and media occupations | 2.4 | 2,496 | |
| Healthcare practitioners and technical occupations | 1.1 | 1,144 | |
| Protective service operations | 0.1 | 104 | |
| * | Building and grounds cleaning and maintenance occupations | 0.8 | 832 |
| Sales and related occupations | 19.1 | 19,864 | |
| Office and administrative support occupations | 16.0 | 16,640 | |
| * | Construction and extraction occupations | 0.2 | 208 |
| * | Installation, maintenance, and repair occupations | 2.1 | 2,184 |
| * | Production occupations | 5.5 | 5,720 |
| * | Transportation and material moving occupations | 36.0 | 37,440 |
Source and notes: Bureau of Labor Statistics, National Employment Matrix.
* indicates nontransferable
| Employment | |||
|---|---|---|---|
| (percent) | |||
| Management occupations | 6.8 | 4,733 | |
| Business and financial operations occupations | 5.2 | 3,619 | |
| Computer and mathematical operations | 2.0 | 1,392 | |
| Architecture and engineering operations | 10.5 | 7,308 | |
| Life, physical, and social science operations | 0.3 | 209 | |
| Legal occupations | 0.1 | 70 | |
| Arts, design, entertainment, sports, and media occupations | 0.4 | 278 | |
| Protective service operations | 0.0 | – | |
| * | Building and grounds cleaning and maintenance occupations | 0.3 | 209 |
| Sales and related occupations | 4.1 | 2,854 | |
| Office and administrative support occupations | 8.6 | 5,986 | |
| * | Construction and extraction occupations | 1.5 | 1,044 |
| * | Installation, maintenance, and repair occupations | 5.0 | 3,480 |
| * | Production occupations | 50.1 | 34,870 |
| * | Transportation and material moving occupations | 4.8 | 3,341 |
Source and notes: Bureau of Labor Statistics, National Employment Matrix.
* indicates nontransferable
Databases, Tables & Calculators by Subject. US Bureau of Labor Statistics, https://www.bls.gov/data/#employment.
Job Openings and Labor Turnover Survey. US Bureau of Labor Statistics, https://www.bls.gov/jlt/.
National Employment Matrix. US Bureau of Labor Statistics, https://data.bls.gov/projections/nationalMatrixHome?ioType=o.
Quarterly Census of Employment and Wages. US Bureau of Labor Statistics, https://www.bls.gov/cew/.
