Patterns, drivers, and a predictive model of dam removal cost in the United States
 Jeffrey J. Duda1*
  Suman Jumani2,3 Daniel J. Wieferich4
  Desiree Tullos5 S. Kyle McKay2 Timothy J. Randle6 Alvin Jansen6 Susan Bailey2 Benjamin L. Jensen1 Rachelle C. Johnson1
  Ella Wagner1 Kyla Richards4 Seth J. Wenger3 Eric J. Walther3 Jennifer A. Bountry6
- 1U.S. Geological Survey, Western Fisheries Research Center, Seattle, WA, United States
- 2Engineer Research and Development Center – Environmental Laboratory, U.S. Army Corps of Engineers, Vicksburg, MS, United States
- 3River Basin Center, University of Georgia, Athens, GA, United States
- 4U.S. Geological Survey, Science Analytics and Synthesis, Denver, CO, United States
- 5Biological and Ecological Engineering Department, Oregon State University, Corvallis, OR, United States
- 6Technical Service Center, Bureau of Reclamation, Denver, CO, United States
Given the burgeoning dam removal movement and the large number of dams approaching obsolescence in the United States, cost estimating data and tools are needed for dam removal prioritization, planning, and execution. We used the list of removed dams compiled by American Rivers to search for publicly available reported costs for dam removal projects. Total cost information could include component costs related to project planning, dam deconstruction, monitoring, and several categories of mitigation activities. We compiled reported costs from 455 unique sources for 668 dams removed in the United States from 1965 to 2020. The dam removals occurred within 571 unique projects involving 1–18 dams. When adjusted for inflation into 2020 USD, cost of these projects totaled $1.522 billion, with per-dam costs ranging from $1 thousand (k) to $268.8 million (M). The median cost for dam removals was $157k, $823k, and $6.2M for dams that were< 5 m, between 5–10 m, and > 10 m in height, respectively. Geographic differences in total costs showed that northern states in general, and the Pacific Northwest in particular, spent the most on dam removal. The Midwest and the Northeast spent proportionally more on removal of dams less than 5 m in height, whereas the Northwest and Southwest spent the most on larger dam removals > 10 m tall. We used stochastic gradient boosting with quantile regression to model dam removal cost against potential predictor variables including dam characteristics (dam height and material), hydrography (average annual discharge and drainage area), project complexity (inferred from construction and sediment management, mitigation, and post-removal cost drivers), and geographic region. Dam height, annual average discharge at the dam site, and project complexity were the predominant drivers of removal cost. The final model had an R2 of 57% and when applied to a test dataset model predictions had a root mean squared error of $5.09M and a mean absolute error of $1.45M, indicating its potential utility to predict estimated costs of dam removal. We developed a R shiny application for estimating dam removal costs using customized model inputs for exploratory analyses and potential dam removal planning.
1 Introduction
Since the mid-20th century, the United States has been transitioning from a period of building dams to one focused on managing this aging infrastructure in the context of economic development, public safety, and environmental objectives (Juracek, 2015; McKay et al., 2020; Vahedifard et al., 2021). There are several factors contributing to this transition. With over 91,000 dams greater than 2 m in height in the national inventory (NID)(U.S. Army Corps of Engineers, 2023) and many times that number of smaller dams, many of the best dam sites have already been used. There is an increasing awareness of the impacts that dams have on freshwater and riparian ecosystems by decreasing aquatic biodiversity (Naiman et al., 2005; Collen et al., 2014; Reid et al., 2019), disrupting the lifecycles of migratory animals (Barbarossa et al., 2020; Waldman and Quinn, 2022), and changing natural temperature, sediment, and flow regimes (Bunn and Arthington, 2002; Poff and Zimmerman, 2010). At the same time, a portfolio of aging dams has created a need to reassess the demand for this infrastructure (Doyle et al., 2008). Some dams were built in a bygone era and no longer serve modern purposes. Others represent safety hazards, including low-head dams with downstream hydraulics that present drowning hazards to boaters and swimmers (Hotchkiss and Kern, 2023). Additional candidates for removal include older dams that need structural repair, are facing increasing operations and maintenance costs, or require expensive investments in mitigation for their negative environmental consequences. Severe reservoir sedimentation, a situation expected to increase in the future (Randle et al., 2021), may also lead to dam removal if the reservoir benefits are lost and only liabilities remain. With the growing opportunities to remove dams and reverse environmental degradation, dam removal has become a growing sector in the emerging restoration economy (Bernhardt et al., 2005; BenDor et al., 2015), with the requisite expertise to remove dams broadly expanding. This intersecting set of interests has led to the growth of dam removal in the United States and abroad as a method for both managing aging infrastructure and restoring ecosystems (Doyle et al., 2008; O’Connor et al., 2015; Foley et al., 2017; Habel et al., 2020).
Reliable estimates of dam removal project costs are important because unrealistic estimates can lead to elimination of dam removal as a feasible alternative, distrust among the public and affected parties, and delayed or derailed projects. Furthermore, dam removal cost estimates can be useful as decision criteria in strategic dam removal planning, particularly when a portfolio of dams are being evaluated. Although several decision-support tools for barrier removal planning exist (Branco et al., 2014; Hoenke et al., 2014; McKay et al., 2017; Guetz et al., 2022), the predicted costs of dam removals are rarely factored into prioritization exercises (Doyle et al., 2003). The incorporation of cost can enhance strategic barrier management planning which in turn can deliver and align economic and socio-ecological benefits (Zheng and Hobbs, 2013; Roy et al., 2018).
Estimating the costs of decommissioning and removing dams is a challenge, which makes it difficult to understand where dam removal may be a viable alternative to maintaining aging or problematic dams. A key difficulty is the wide range of factors that can affect price, along with limited and variable completeness of publicly available data to understand the impact of each factor on total cost. These factors can include the size of the dam and its impoundment, geographic setting (e.g., rural versus urban), the volume of stored sediment and its degree of contamination, the presence of sensitive species or infrastructure, requirements for post-removal site restoration (e.g., stabilization, revegetation), inherent regional differences (in permitting requirements, history of dam removal), needs to replace the function of the dam, and socio-economic dimensions (Born et al., 1998; Duda and Bellmore, 2022).
Cost estimation for civil infrastructure is commonly based on design-bid-build contracts, where the client hires the engineer and contractor under separate contracts and bids are based on unit prices, or how much time and material are required to complete specific tasks (e.g., Shrestha et al., 2012). The methods for unit price cost estimation are well established and include annually published manuals on rates (Mubarak, 2016) for typical cost components (e.g., mobilization/demobilization of heavy equipment, concrete, or electrician vs. common laborer). On the other hand, dam removals can be subject to substantial uncertainties, ranging from discovery of unknown structures or contaminated materials to unexpected high flows that erode coffer dams or result in exceeding water quality limits. As a result, more complex dam removals may be contracted as design-build projects in which the construction contractor maintains ownership of the process from start to finish, and typically bills for the whole project (i.e., fixed sum or guaranteed maximum price), rather than by unit prices. Design-build contracting is more common with complex, large projects that are subject to greater uncertainty, and these contracts tend to avoid change orders that occur with the discovery of some unexpected issue that can substantially impact project budget and timeline. (Park and Kwak, 2017). For design-build with a guaranteed max price, the contractor factors in uncertainty at the beginning based on their experience and knowledge of the project, and is the main reason these projects need a highly qualified design-build team. Further, design-build is often utilized to increase efficiency and get the contractor up to speed with the project faster because they are involved from day one. The continuity in leadership across the project, from start to finish, contrasts with design-bid-build, which can involve multiple contractors and limited oversight by the design engineer. Design-build with fixed sum contracting can result in better outcomes for complex projects but is also associated with some resistance among dam owners, consulting firms, and contractors to share their detailed cost data.
In addition to decommissioning surprises and paucity of publicly available data on project cost, dam removal can involve mitigation requirements that influence cost estimation. Many projects require restoration of the former reservoir footprint and/or other additional costs (e.g., movement or replacement of water intakes and treatment plants, fish hatcheries, drinking water wells) that often are not required with classic civil infrastructure projects (Winter and Crain, 2008; Bountry et al., 2013; Tullos et al., 2016; Duda and Bellmore, 2022). While the cost of site restoration actions and project add-ons can be estimated with unit-cost estimation methods, it can be hard to predict the scope and scale of these activities until the engineering reaches later design milestones. Thus, although removing dams often involves more than structural removal, it can be difficult to generalize the scope and scale of additional site-specific project components, particularly in early project planning stages.
With this paper we: (1) describe the compilation of a dam removal cost database (Duda et al., 2023) that includes cost drivers pertaining to sediment management, mitigation, and post-removal actions for completed projects in the United States; (2) contextualize the biogeographic trends and drivers of dam removal costs by creating common linkages with existing databases (i.e., the American Rivers Dam Removal Database, the Dam Removal Information Portal, and the National Hydrography Dataset Plus Version 2.1); (3) develop a predictive machine learning model to estimate the planning level cost of dam removal projects based on dam characteristics and prominent cost drivers, which is further packaged as an interactive and exploratory Shiny application for cost prediction (https://wrises.shinyapps.io/DamRemovalCostPredictiveModel/), and (4) conclude with a discussion of a detailed case study database (Tullos and Bountry, 2023) containing component-wise breakdowns of cost estimates to highlight the nuances and limitations entailed in cost estimation.
2 Methods
2.1 Compiling the dam removal cost database
We used the dams listed in the American Rivers dam removal database (versions 1–8; American Rivers, 2023) to search for dam removal cost estimates for inclusion in a dam removal cost database (Duda et al., 2023). For each dam, we used the search string, “dam name + removal + cost” or “river name + dam removal + cost” in the Google search engine to identify sources of project-specific cost information. Any source information that contained a cost estimate was reviewed and retained. Types of source material included technical reports, journal articles, websites, news articles, government documents, and blog posts. If no results were found after the initial search, we used contact information to request project cost from practitioners or project managers.
Once a source was identified as reporting the cost of a dam removal project, we extracted several pieces of information. First, we documented bibliographic information within a Zotero database including the type of source, the URL location, title, author, and year of publication. A screen image of the reported cost from the source material was saved as documentary evidence in case the URL became invalid or lost due to link-rot (Duda and Camp, 2008). Although most sources contained a reported cost for a single dam removal, some included a combined cost representing several dam removals (e.g., Aadland, 2010). When a cost estimate pertained to multi-dam removal projects, it was grouped under a unique identifier in the database to distinguish these cases and avoid double counting. When multi-dam removal projects contained a single reported cost for “n” number of dams, we used the proportional height of each dam “i” to partition the costs according to the size of each dam using the following equation:
2.1.1 Identifying potential cost drivers
Apart from the reported cost, we reviewed available source material and data sources to collate information on the characteristics and cost drivers of each dam removal project. We searched for any mention of why the dam was being removed, which typically fell into the categories of safety, river or ecosystem restoration, economics (e.g., it was more cost effective to remove the dam than conduct repairs, continue maintenance, or provide upgrades), or “other”. Next, we identified the presence of any cost drivers noted in the documentation of the dam removal. A total of 28 different cost drivers were identified and categorized into activities related to construction and sediment management, mitigation, and post-removal outcomes. Construction and sediment cost drivers (n = 6) related to whether: coffer dams or other site dewatering activities were needed; reservoir sediments were contaminated or not; river erosion or mechanical removal was used for sediment mobilization; sediment stabilization was required; and the use of a pilot channel through delta deposits was used. Mitigation cost drivers (n = 11) were related to activities needed to minimize the effects of dam removal, including: construction or enhancement of river habitat features; replacing or protecting water supply infrastructure; protecting levees or riverbanks; mitigating flood risk via property purchases; protecting or constructing bridges; protecting or constructing a fish hatchery; or protecting roads or wells. The post-removal cost driver category (n = 11) included: reshaping reservoir or downstream topography; revegetation; control of invasive species; fish passage; monitoring; installation of stability berms or retaining walls; burial or removal of structures for safety; relocation or protection of utilities; creation of access roads; and installation of interpretive displays.
2.1.2 Compiling data describing dam and watershed characteristics
Next, we connected the dams with a reported cost to the Dam Removal Information Portal (DRIP) (https://data.usgs.gov/drip-dashboard; Wieferich et al., 2021) using the American Rivers identifier “AR_ID” for each dam. The DRIP tool has existing connections to the USGS Dam Removal Science Database (Duda et al., 2018) and the National Hydrography Dataset Plus version 2.1 (NHDPlus V2.1; Brakebill et al., 2020), allowing for access to additional dam and watershed characteristics including geospatial (latitude, longitude) and demographic information (height, length, construction material). Linkage to the NHDPlus V2.1 provided information about Strahler stream order (Strahler, 1957), drainage area upstream of the dam (km2), and average annual stream flow (m3/s). Some dams lacked available height and/or length information from any source. For dams that were missing length information (n = 634), we estimated the length of the dam using publicly available aerial imagery, distance rulers available in Google Earth Pro (version 7.3.4), and multiple measurements (2 or 3 depending on accuracy) by the same observer. However, only 298 dams had clear imagery of the entire channel both before and after the dam removal, thus allowing us to estimate the length of the dam. The other dams had channels that were obstructed, usually by canopy, making measurement impossible. For dams missing height information, project photos were used to determine whether the dam could be placed into the smallest height category (< 5 m) based on recognized scaling features (e.g., a human, a street sign) in the image (n = 34). If no such scaling was available, the dam was placed into the unknown height category (n = 19).
2.1.3 Indexing cost for inflation
We located a reported cost for dams that were removed during the period from 1965 to 2020. To adjust historical dam removal costs to their equivalent value in 2020 U.S. dollars (USD), we used the RS Means building construction cost index (Mubarak, 2016). RS Means is a widely used index that tracks changes in construction costs over time and was deemed more appropriate to estimate temporal dam decommissioning cost trends than other inflation indices (e.g., Consumer Price Index). Using 1992 as the base year (i.e., 100), the index ranged from 21.7 in 1965 to 234.6 in 2020. Price in 2020 USD for a dam removed in year i was calculated with the following equation:
2.2 Building the predictive cost model
2.2.1 Data preprocessing
We calculated a project complexity score as the sum number of cost drivers associated with construction and sediment management, mitigation, and post-removal actions. We then re-scaled the total score to a value between 0 and 1, where larger values corresponded to higher project complexity. Dam material, often listed as a combination of materials, was coded into one of three categories based on material durability: (i) concrete, masonry, and/or steel; (ii) wood and/or sheet piling; (iii) combination of both. The categorical variable of region (five categories) was one-hot encoded to dummy variables.
The dataset was also examined for data completeness. While a reported cost was available for every dam, dam height and length were missing for 56 and 335 records, respectively. For entries with missing height data that corresponded to a height category of “less than 5m” (n = 34), missing heights were imputed based on the median height of dams within the same height category (i.e., 2.1 m). The variables of dam length and age were excluded from model building due to a high proportion of missing data. To minimize model error associated with inherent variation in costs across states, dam removal costs were adjusted to a common-state standard using 2020 state cost adjustment factors developed by the United States Army Corps of Engineers (U.S. Army Corps of Engineers, 2022a). Since most dam removals have occurred in the state of Pennsylvania, all dam removal costs were computed to Pennsylvania standards based on individual state-based adjustment factors (see Supplementary Appendix A). This adjustment does not influence model results, but instead accounts for a non-informative source of cost variation in the model. To avoid model overfitting, the data was partitioned into training (80%, n = 536) and testing (20%, n = 132) data sets for model building and evaluation, respectively, using the “createDataPartition” function from the carat package (Kuhn et al., 2022) in R 3.03 (R Core Team, 2022). This function splits the data using random sampling while preserving the overall distribution of the data. The resultant split was also visually examined to make sure that test and train data points were distributed across dam removal cost and dam height ranges present in the database.
2.2.2 Data analysis
We modelled natural log-transformed cost data against six predictor variables shown in exploratory analyses to influence cost – dam height (m), average annual discharge (m3/s), drainage area (km2), project complexity, dam material, and region (one hot-encoded as five variables). We analyzed the relationships between dam removal costs and various predictor variables using stochastic gradient boosting (SGB; Friedman, 2002) with quantile regression, together called gradient boosted quantile regressions (GBQR). SGBs are a machine learning technique in which an ensemble of shallow and weak trees is successively built such that the performance of each tree is boosted by improving on the errors (residuals) of the preceding tree (Friedman, 2002). Unlike conventional regression trees that fit a single parsimonious model, SGBs incorporate the advantages of regression trees (i.e., handling mixed data types and missing data) while overcoming some of their limitations like poor predictive performance, lack of optimal tree structure, and high sensitivity to small changes in the data set (Elith et al., 2008). At each iteration, a tree is built from a random sub-sample of the dataset which incrementally improves model prediction accuracy while preventing over-fitting of the data. An advantage of the method is that predictor variables do not need to be transformed prior to analysis, since SGBs can fit non-linear relationships. Additionally, interactions between predictors do not need to be specified a priori (Elith et al., 2008).
To minimize overfitting, models were built based on a repeated 20-fold cross validation of the training data. We constructed GBQR models using the caret package using the following settings: interaction depth (i.e., tree complexity, which determines the maximum possible interactions) was set to 4 nodes; shrinkage (which controls the learning rate of the algorithm) was set to 0.002; iterations (or number of trees) was set to 5000; and the minimum number of observations in a node to commence splitting was 10. Finally, the bagging fraction, which controls the fraction of the training data randomly selected to build each tree was set at 0.7. To account for the uncertainties associated with cost predictions, we obtained median point predictions along with 50% and 95% prediction intervals by setting alpha values of 0.5, 0.25, 0.75, 0.025, and 0.975, respectively.
We created variable importance plots to visualize the relative importance of different predictor variables. Computed as the sum of squared improvements in error by each variable averaged over all trees (Hastie et al., 2001), the relative importance value of the most important predictor is assigned a value of 100 and the value of other variables are scaled proportionately. To examine the relationship between cost and each predictor variable, partial dependence plots (PDP) were constructed. We examined model performance using the relationship between the actual and predicted costs for the test dataset based on three metrics: the coefficient of determination or r2; mean absolute error (MAE); and root mean squared error (RMSE).
The GBQR models were also integrated into a Shiny application to create an exploratory dam removal cost prediction tool, accessible at https://wrises.shinyapps.io/DamRemovalCostPredictiveModel/. The R code for model development and shiny application creation can be accessed via a GitHub repository (https://github.com/USACE-WRISES/DamRemovalCostModel).
2.3 Detailed cost for case studies
We compiled a second database containing detailed cost breakdowns of 15 individual dam removal projects (Tullos and Bountry, 2023). Projects were identified based on personal contacts with consultants working on dam removals, who then recommended additional contacts (i.e., snowball sampling). Detailed costs were acquired from bid abstracts and/or schedule of values provided by project technical leads and engineers. Costs were classified into six categories: construction, mitigation, design, litigation, stakeholder concern, and monitoring. Construction costs included pay items such as mobilization/demobilization, removal of the dam and appurtenances, sediment management, and restoration of the site. Mitigation costs included project components that were needed to replace the function of the dam and/or address impacts, such as hatcheries, pumping plants, replacement water supply wells, and levee improvements. Design costs (i.e., non-contract) were those pertaining to design, engineering, and permitting. Litigation costs involved any legal costs associated with litigation to keep or remove the dam. It is our expectation that this cost is underreported since project consultants usually were not involved with litigation. Stakeholder concerns comprised any additional studies, facilitation, site visits and other activities related to stakeholders and their project concerns. Monitoring included costs associated with required monitoring for water quality and other permits or project requirements, which does not include any costs associated with research-oriented monitoring. Detailed costs from each case study were compiled into the cost categories by each consultant with some guidance from the project team during follow up interviews, although the classification of several individual costs into these categories was subject to some individual discretion. Per the request of some information providers, names of some dams were removed to protect proprietary information.
In addition to detailed costs, 83 variables, including details on river and dam features (e.g., dam geometry and composition, stored sediment volume and composition, dam removal strategy, streamlining of permitting, mitigation measures) were documented based on interviews with project managers (Tullos and Bountry, 2023). These variables provide descriptive detail on features of the project that contribute to each cost category, such as the strategy for sediment management, degree of sediment contamination, need for replacement infrastructure, complexity of permitting, and other factors that could increase project complexity or cost.
3 Results
3.1 Dam removal trends from the cost database
Using the names and geospatial attributes of 1773 dams in the American Rivers dam removal database (American Rivers, 2023), we were able to locate reported dam removal cost for 668, or roughly 38% of the dams removed from rivers in the United States. The reported costs were for dams removed between 1965 and 2020 in 38 different states. We found 455 unique sources of information that contained a reported cost or information about the presence of cost drivers for the project (Table 1). The top categories of source information included governmental and non-governmental web sites (147), online news articles (117), unpublished reports and governmental documents (79; e.g., contract bids, budget reports), web blogs (41) and email communications with project contacts (26).
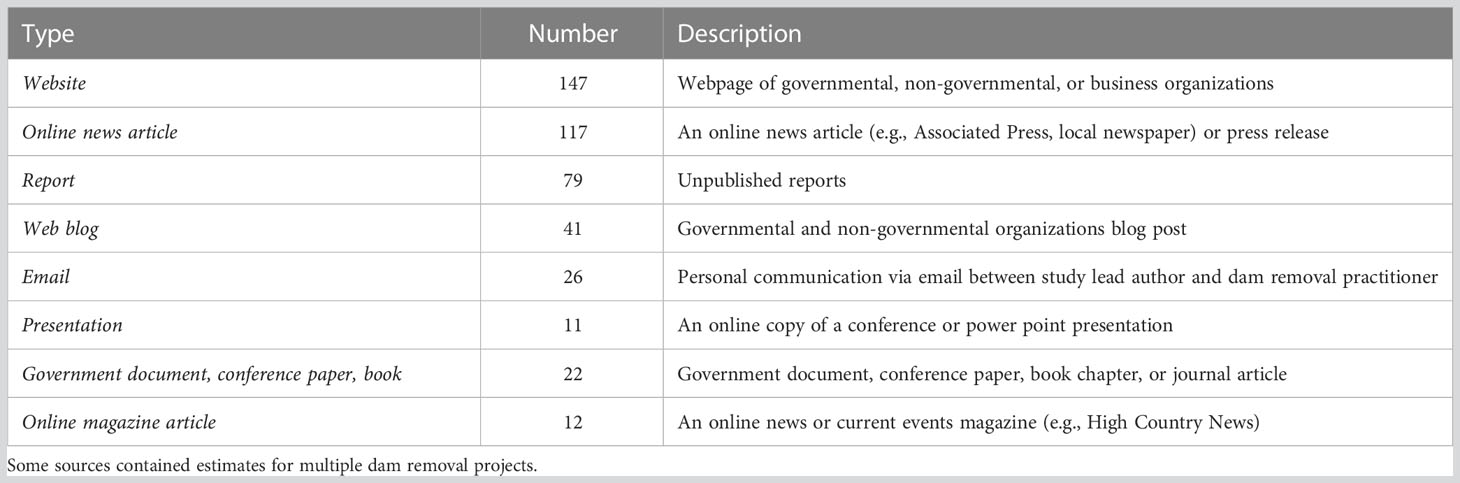
Table 1 Categories and descriptions of 455 bibliographic sources used to obtain cost estimates or cost drivers of dams removed in the United States between 1965 and 2020.
The total cost of the 668 dam removals indexed to 2020 dollars was $1.522B. Dam removal project cost estimates, including those where multiple dams were removed, ranged from $5k to $351.60M, which when adjusted for inflation to 2020 USD ranged from $6.0k to $402.56M (hereafter and in all tables and figures we report the indexed 2020 cost). When estimating the per dam cost of multi-dam projects with the proportional height calculation, cost estimates ranged from $929 to $268.80M (Figure 1).
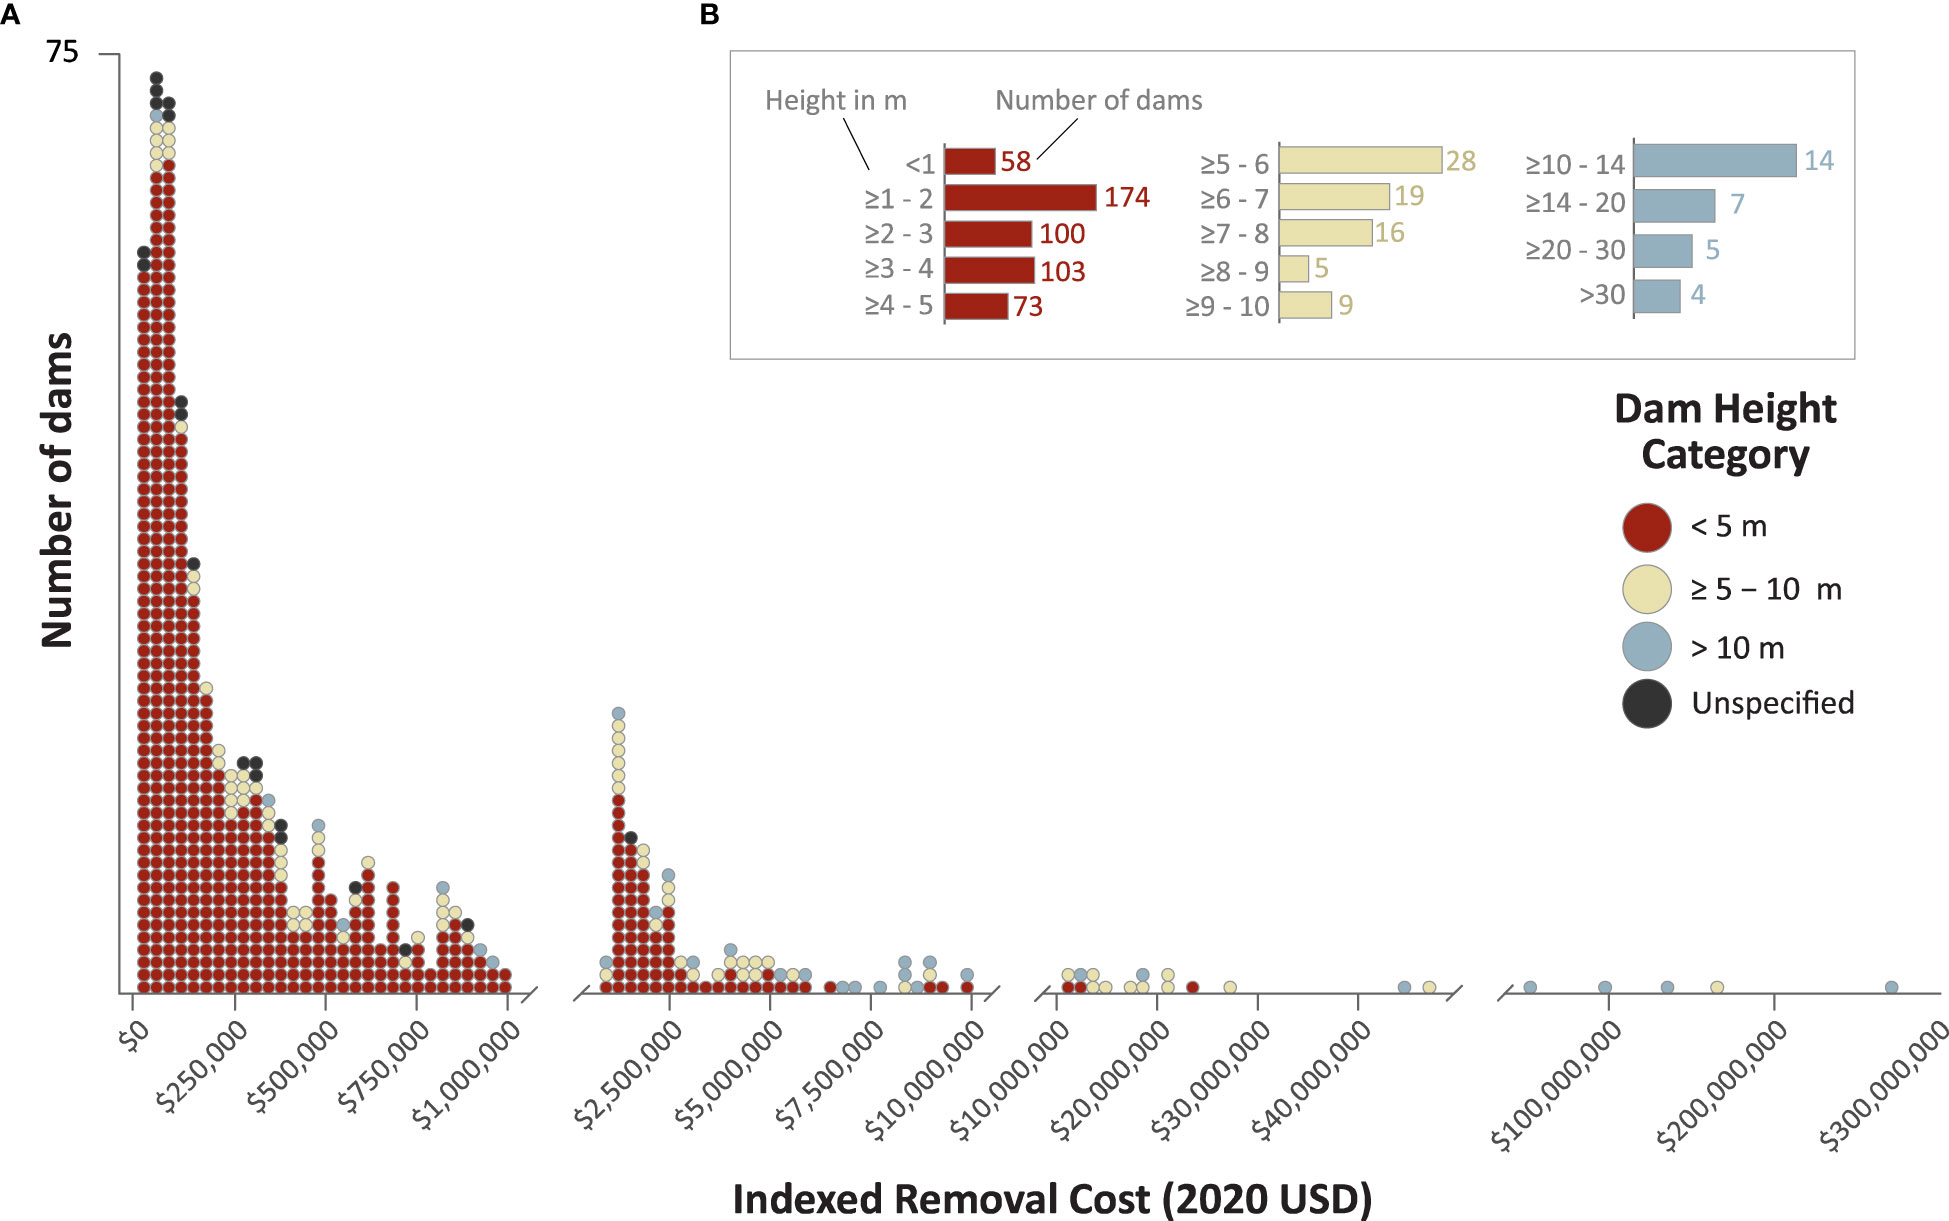
Figure 1 (A) Histogram of indexed cost estimates for 668 dam removals by height category. To represent the skewed data, the x-axis was broken into four non-equal divisions (<$1,000,000, $1,000,000 to $10,000,000, $10,000,000 to $50,000,000 and >$50,000,000) with the bin size for each division equal to 1/30th of the range of values. (B) Distribution of height per dam size category. For 34 dams in the less than 5 m category, height was visually estimated as being< 5 m from ancillary sources (e.g., photographs) but the exact height wasn’t known. Another 19 dams with cost estimates were classified as unknown height.
Seventy-seven percent of reported costs (n = 518) were for projects where a single dam was removed, whereas 150 dams were removed as part of 53 multi-dam removal projects involving between 2 and 18 dams. There were far more small dams (< 5 m; n = 542) than medium height dams (5 m–10 m; n = 77) or large dams (> 10 m; n = 30) (Figure 1). The median dam removal costs were $157.30k, $823.48k, and $6.22M for small, medium, and large size dam removals, respectively. Only 19 dams with cost estimates did not have a height estimate. Given the median cost of dams with unknown height was $153.42k, it is likely that most of the dams lacking height information were dams less than 5 m tall.
The number of dams for which we located cost information varied regionally (Figure 2A). The number of dam removals with reported cost by region was highly correlated with the total number of dam removals (based on American Rivers data) per region (Pearson’s r = 0.98, n = 5, p = 0.002), suggesting that our database was representative of dam removals in the United States. The Northeast and the Midwest had the highest number of reported dam removal costs (221 and 278, respectively), with small dams < 5 m being numerically dominant and representing a larger proportion of cumulative dam removal cost in these regions (Figure 2B). These two regions also had similar median costs for small, medium, and large dam removals (Table 2). In contrast, fewer dams were removed in the Northwest and Southwest regions (50 and 78, respectively) but the removed dams were larger (> 10 m), which accounted for a larger share of the cumulative regional cost for dam removal. The median costs of dam removals in these regions were similar for small and medium sized dams, but in the Northwest median cost for large dams was 3.4 times greater than in the Southwest ($26.42M vs. $7.82M), largely due to three expensive dam removals on the Elwha and Clark Fork rivers in Washington and Montana. If these dams are omitted, the median cost for large dam removals declines to $7.30M in the Northwest region, which is in line with large dam removal costs in the western United States (but still considerably higher than large dam removal costs in the eastern United States). Finally, the Southeast region had the fewest dams with reported removal cost, the least total dam removal cost, and no large dam removal projects (Table 2). The median cost for small dams in the Southeast was similar to the median cost in the Northeast, and for medium dams to the Northwest and Southwest.
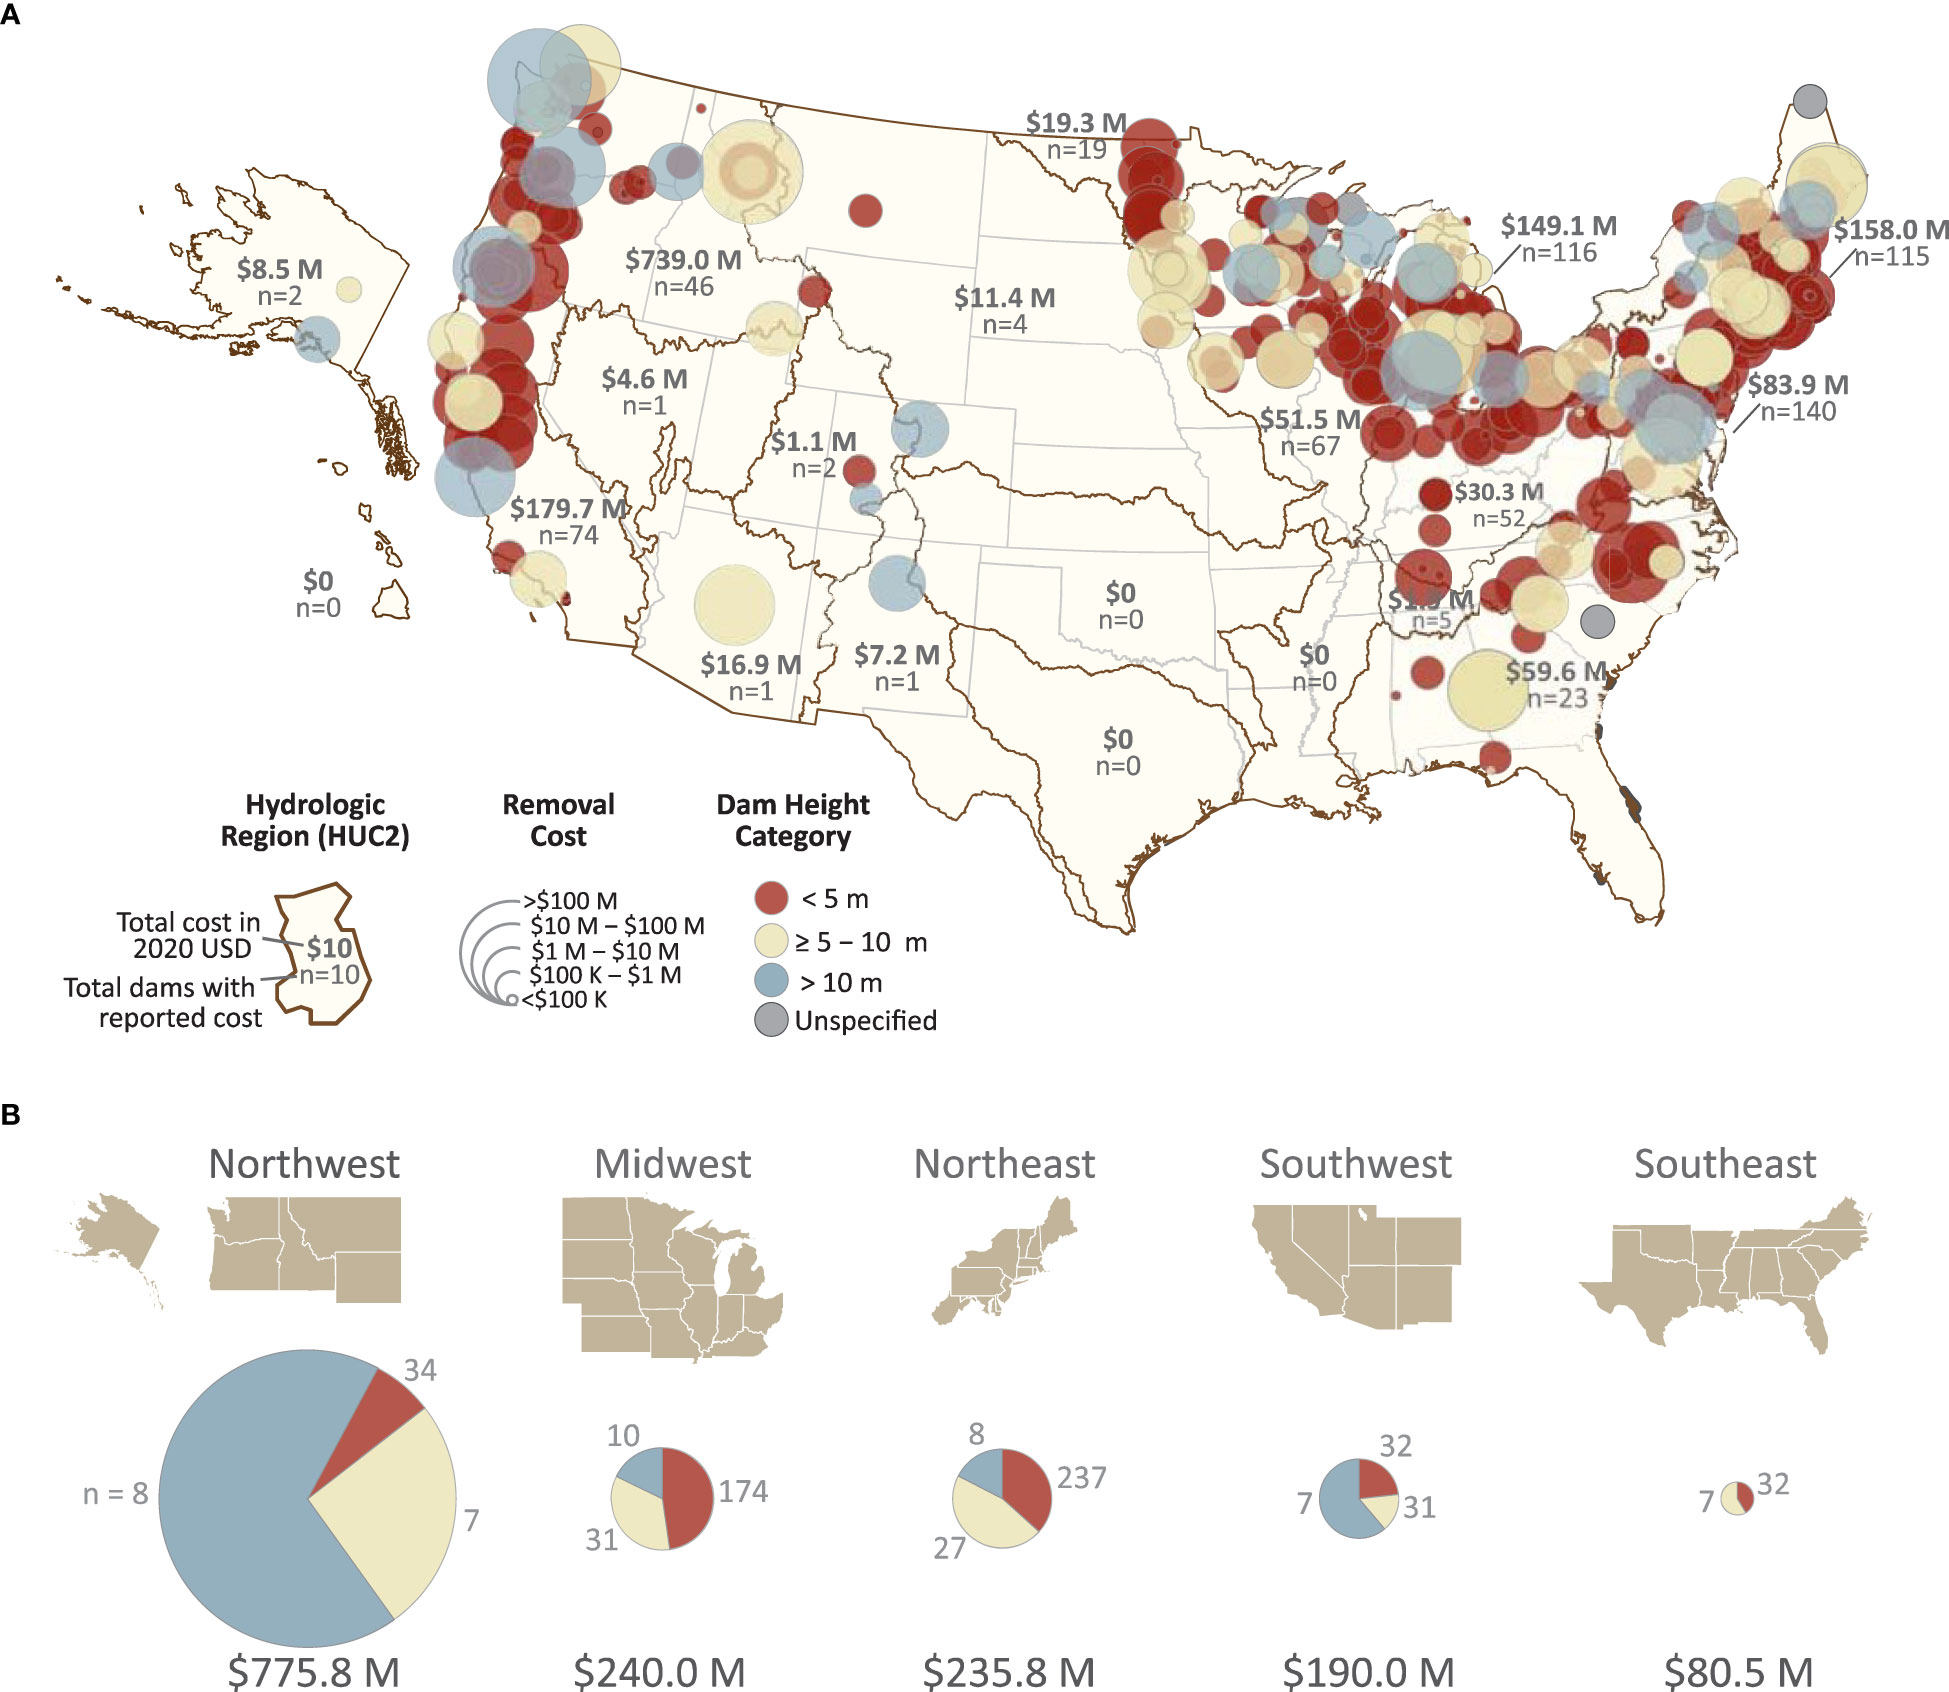
Figure 2 (A) Map visualization aggregating cost estimates of dam removals in the United States from 1965 to 2020. Dams depicted by height category (fill color) and cost bubbles (diameter) ranging across 5 orders of magnitude. Total number removed and total cost (calculated based on 2020 dollars using RS Means construction cost index) were aggregated to Hydrologic Unit 2 watersheds. (B) Regional cost estimates of dam removal by dam height category. Size of pie charts proportional to total cost for each region.
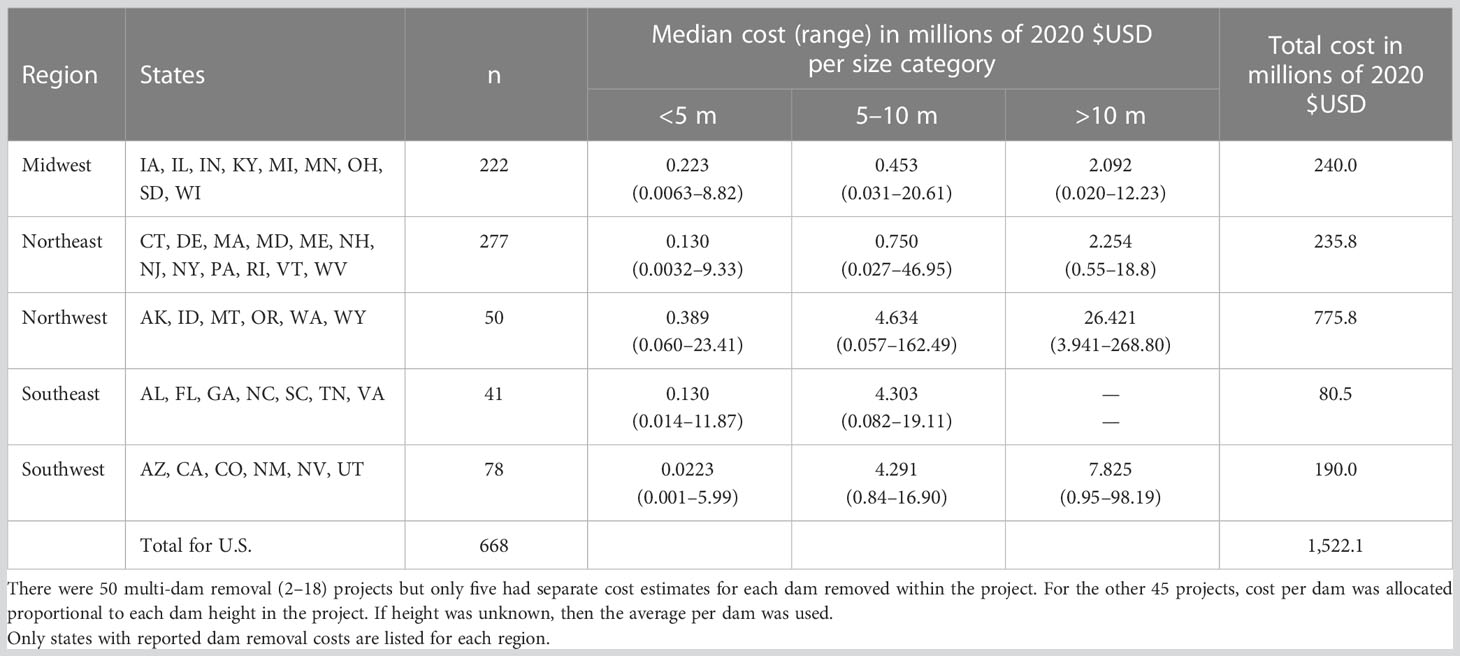
Table 2 Dam removal cost by region and size category.
For the dams where we located cost data, the stream and watershed characteristics differed by dam size category and in some cases by region. In each region, most removals were of small dams, averaging between 1.8 m and 2.7 m in height (Table 3). A trend of small dams being located on rivers with smaller stream order, upstream drainage area, and discharges was present in most regions compared with medium (5–10 m) and large sized dams (>10 m), although this trend did not hold in the Midwest region. For the large dam category, the western United States had, on average, taller dams removed (25.1 m and 24.9 m in the Northwest and Southwest, respectively) than the central and eastern United States (15.7 m and 14.2 m in the Midwest and Northeast, respectively).
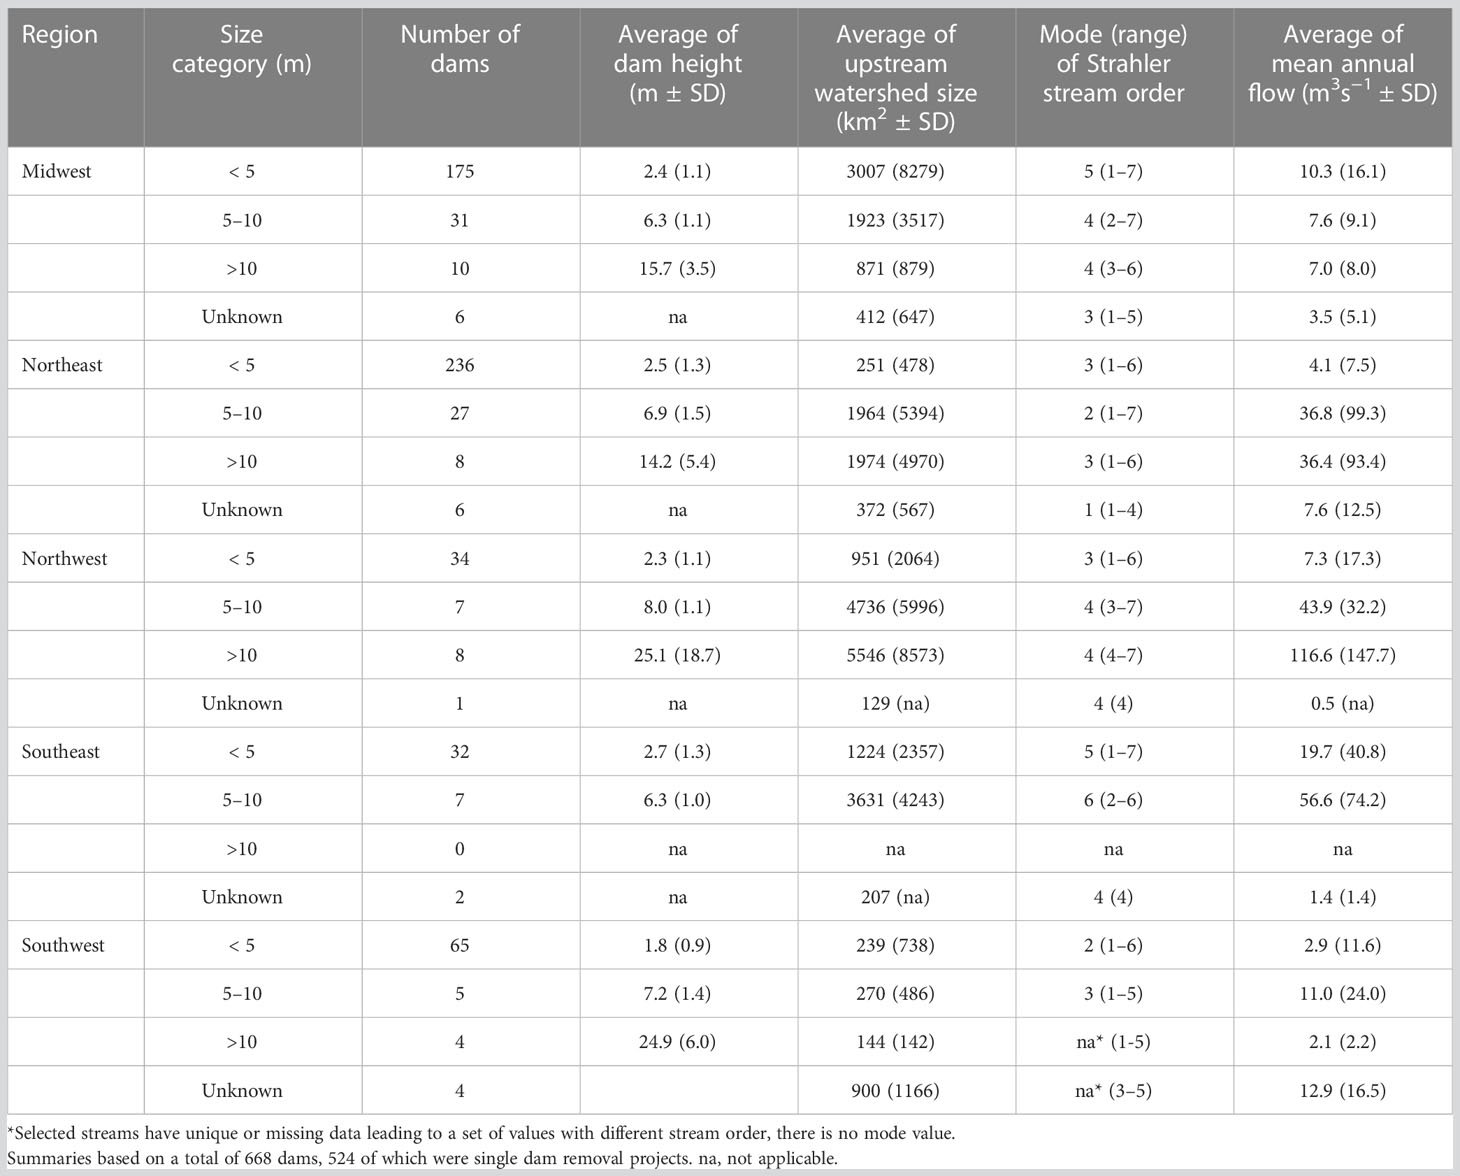
Table 3 Summaries by U.S. region and dam size categories of dam removal cost (median and range), upstream watershed size (average and SD), stream order (mode and range), annual flow in cubic meters per second (average and SD).
3.2 Reasons for dam removal and drivers of cost
We were able to identify at least a single reason for dam removal in all but 49 dams with a reported cost. Most dams had a single reason identified for dam removal, while 190 had two reasons (e.g., restoration and safety, safety and economics). Restoration of the aquatic ecosystem, often mentioning fish passage, was the most common reason cited for dam removal overall and within each size category (Figure 3). Removal of unsafe dams, including those in disrepair and in danger of failure or those that posed risk to swimmers and boaters, were the next most common reason for dam removal. Economics was the least commonly cited reason for dam removal
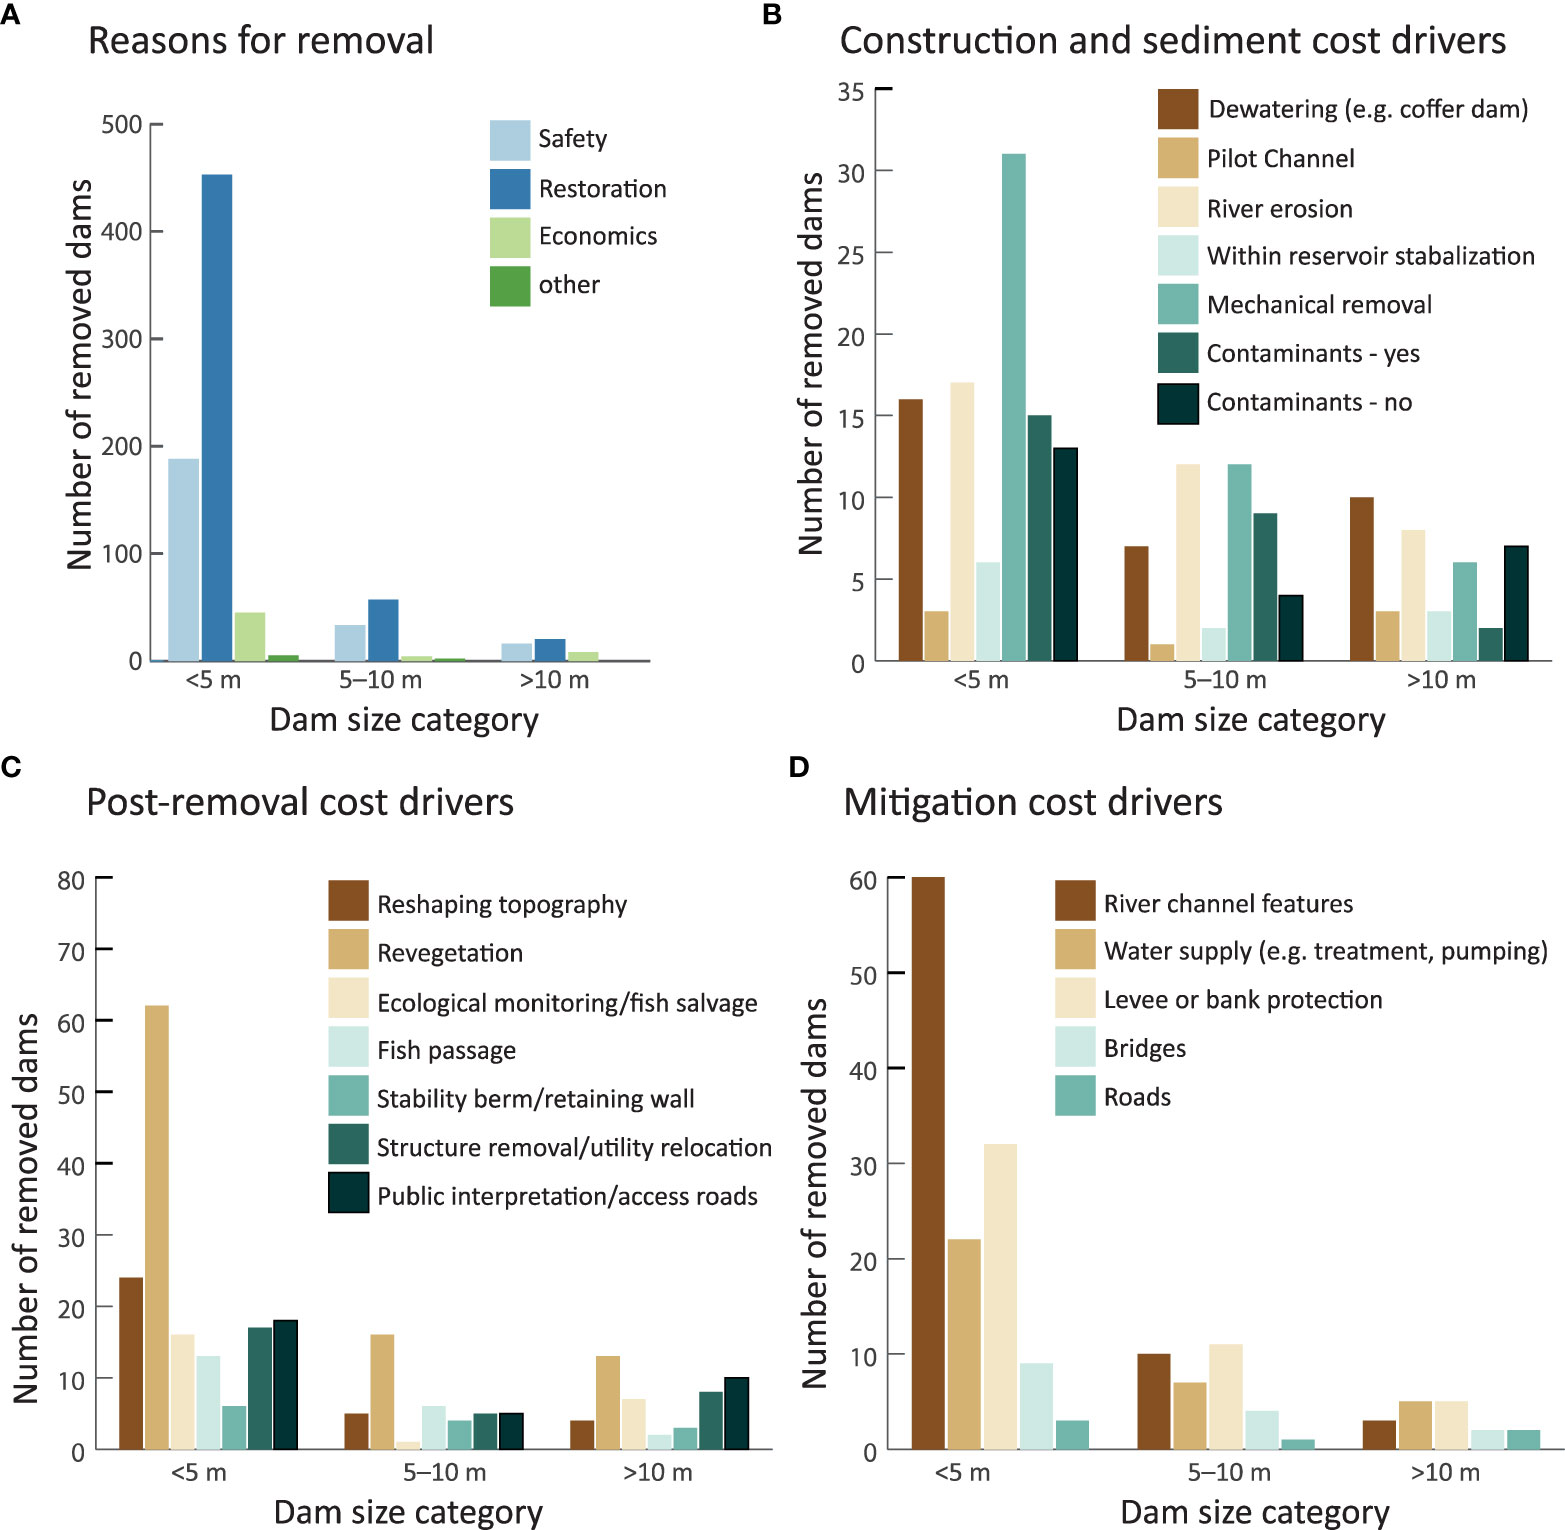
Figure 3 (A) Reasons for dam removal and (B) cost drivers related to sediment, (C) post dam removal activities and (D) dam removal mitigation needs. A dam removal project could have more than one driver identified.
We were able to locate reference to at least one of the 28 different cost drivers for 239 (35.8%) dams in our dam removal cost database. Lack of identified cost drivers does not mean that drivers were not present, merely that they were not reported in the documentation we reviewed. Cost drivers related to sediment were present in 129 dam removal projects, with mechanical removal (n = 49) or river erosion (n = 37) of sediment the most common, followed by the use of coffer dams to dewater construction areas (n = 33), removing contaminated sediments (n = 26), reservoir sediment stabilization (n = 12), and use of a pilot channel (n = 7). Cost drivers related to mitigation elements for fish passage (e.g., grade control structures), water supply (e.g., water pumping or treatment), or habitat and infrastructure protection (e.g., bank stabilization), were associated with 118 dam removal projects. The most common type of mitigation driver (n = 73) was related to river channel features, like installation of rocks and boulders to create habitat, limit erosion/scour, and allow fish passage. Other cost drivers for mitigation included those intended to protect banks or levees (n = 49), replace or relocate water supply infrastructure (n = 27), or protect/replace bridges (n = 15). All other mitigation types were present in less than 6 dam removal projects each. Finally, potential drivers of cost associated with post-project elements associated with the dam removal site (i.e., post-removal drivers) and upstream/downstream features were present in 149 different dam removal projects. The most common was revegetation of reservoir and riparian areas (n = 93), followed by reshaping topography (n = 34), monitoring (n = 24), protection or removal of structures for safety (n = 25), and creation of interpretive facilities (n = 21). A total of 80 dam removal projects had a single identified cost driver, while 97 projects had two or three identified drivers. Only 62 projects had more than four drivers identified.
3.3 Predictive cost model
Dam height was the strongest predictor of removal costs, followed by average annual discharge, project complexity, and drainage area. Dam removals in the Southwest region, dam material, and other regional variables had a smaller effect (Figure 4A). Despite the differences in the strength of their effects, all variables were retained by the modeling process, showing at least some importance in predicting cost. The model explained 57.0% of the variance in dam removal costs for the training dataset.
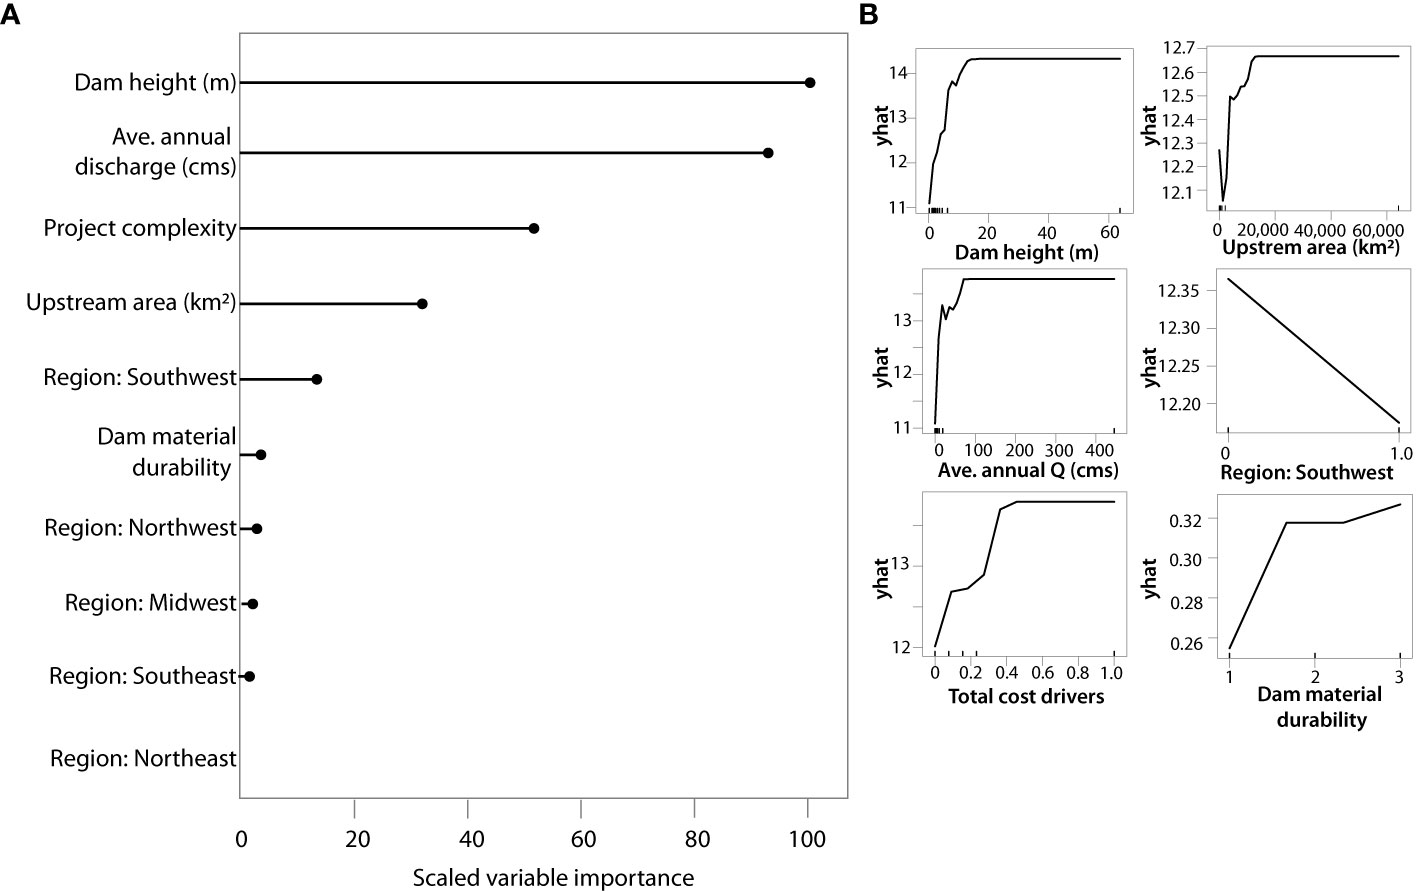
Figure 4 Results from a dam removal cost model derived from stochastic gradient boosted quantile regression showing (A) the relative importance of predictor variables scaled to the most important predictor and (B) partial dependence plots of the top 6 variables, showing the marginal effect (i.e., yhat) of the independent variable to the dependent variable. Note that the y-axis scales are different for each variable.
The partial dependences of cost on the different predictor variables are depicted in Figure 4B. These plots represent the trend or nature of dependence between the predictor and response variables rather than actual values. In general, the strength of these effects was strongest for dam height and discharge (based on the scale of the y-axis in the partial dependence plots) and lowest for the Southwest region and dam material. Dam removal costs increased with dam height from < 1 m to 20 m, beyond which there was no cost increase after accounting for the effects of other predictor variables. It is likely that this reflects a paucity of reported cost data for larger dams in the data rather than a real effect. Similarly, discharge and project complexity resulted in increased removal costs up to approximately 100 m3/s and 0.5 respectively. Beyond these threshold values, cost showed little dependence on these variables after accounting for other predictor variables. Drainage area had a nonmonotonic relationship with cost; as drainage area values increased from low levels to 20,000 km2, cost first decreased and then increased. Beyond the 20,000 km2 threshold, cost did not show any dependency of drainage area. Regional removal costs did not show any strong relationships except for the Southwest, where removal costs tended to be lower. Finally, cost of removal increased with the durability of dam material (Figure 4B).
The relationship between actual and predicted median cost values (n = 97) derived from model performance on the test dataset is shown in Figure 5. Due to incomplete or missing data for the predictor variables, we were able to predict model-based costs for only 97 of the 132 test data points. The coefficient of determination (R2) was 33.8%, and the overall MAE and RMSE associated with predicted costs were $1.45M and $5.09M, respectively. Errors between predicted and actual costs were larger for larger sized and more expensive dam removal projects (Figure 6). For instance, predicted costs were much lower than actual costs for Savage Rapids, Fossil Creek, Embrey, Plainwell Dam #1, and Carbonton dams. Conversely, the trend was reversed for the Hidden Treasure and Boardman dams, where the actual costs were lower than those predicted. The relationship between actual and predicted costs was more accurate for dams less than 5 m in height, particularly when considering the 50% prediction interval. Yet even for the most extreme outliers, actual cost values were encompassed within the 95% prediction interval (Figure 5).
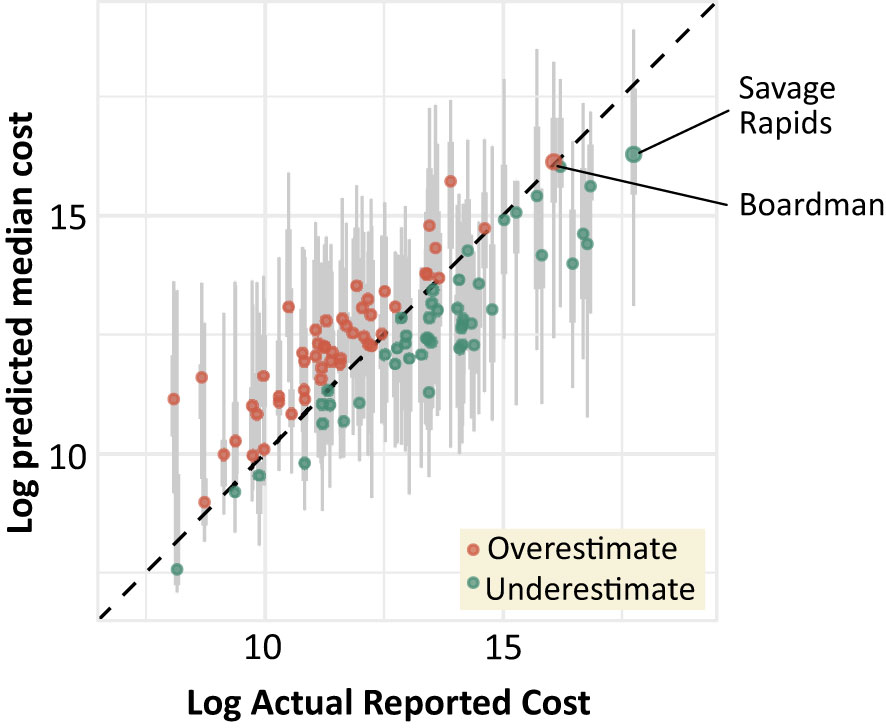
Figure 5 Actual versus predicted median cost of dam removal (shown in log-log scale) derived from stochastic gradient boosted quantile regression model. The model was derived from training data that contained cost and characteristics data (n = 536) and predictions were made on a test dataset of 97 dams. Gray bars and lines represent the 50% and 95% prediction intervals, respectively. The two labeled dams were those where interviews provided detailed cost estimates.
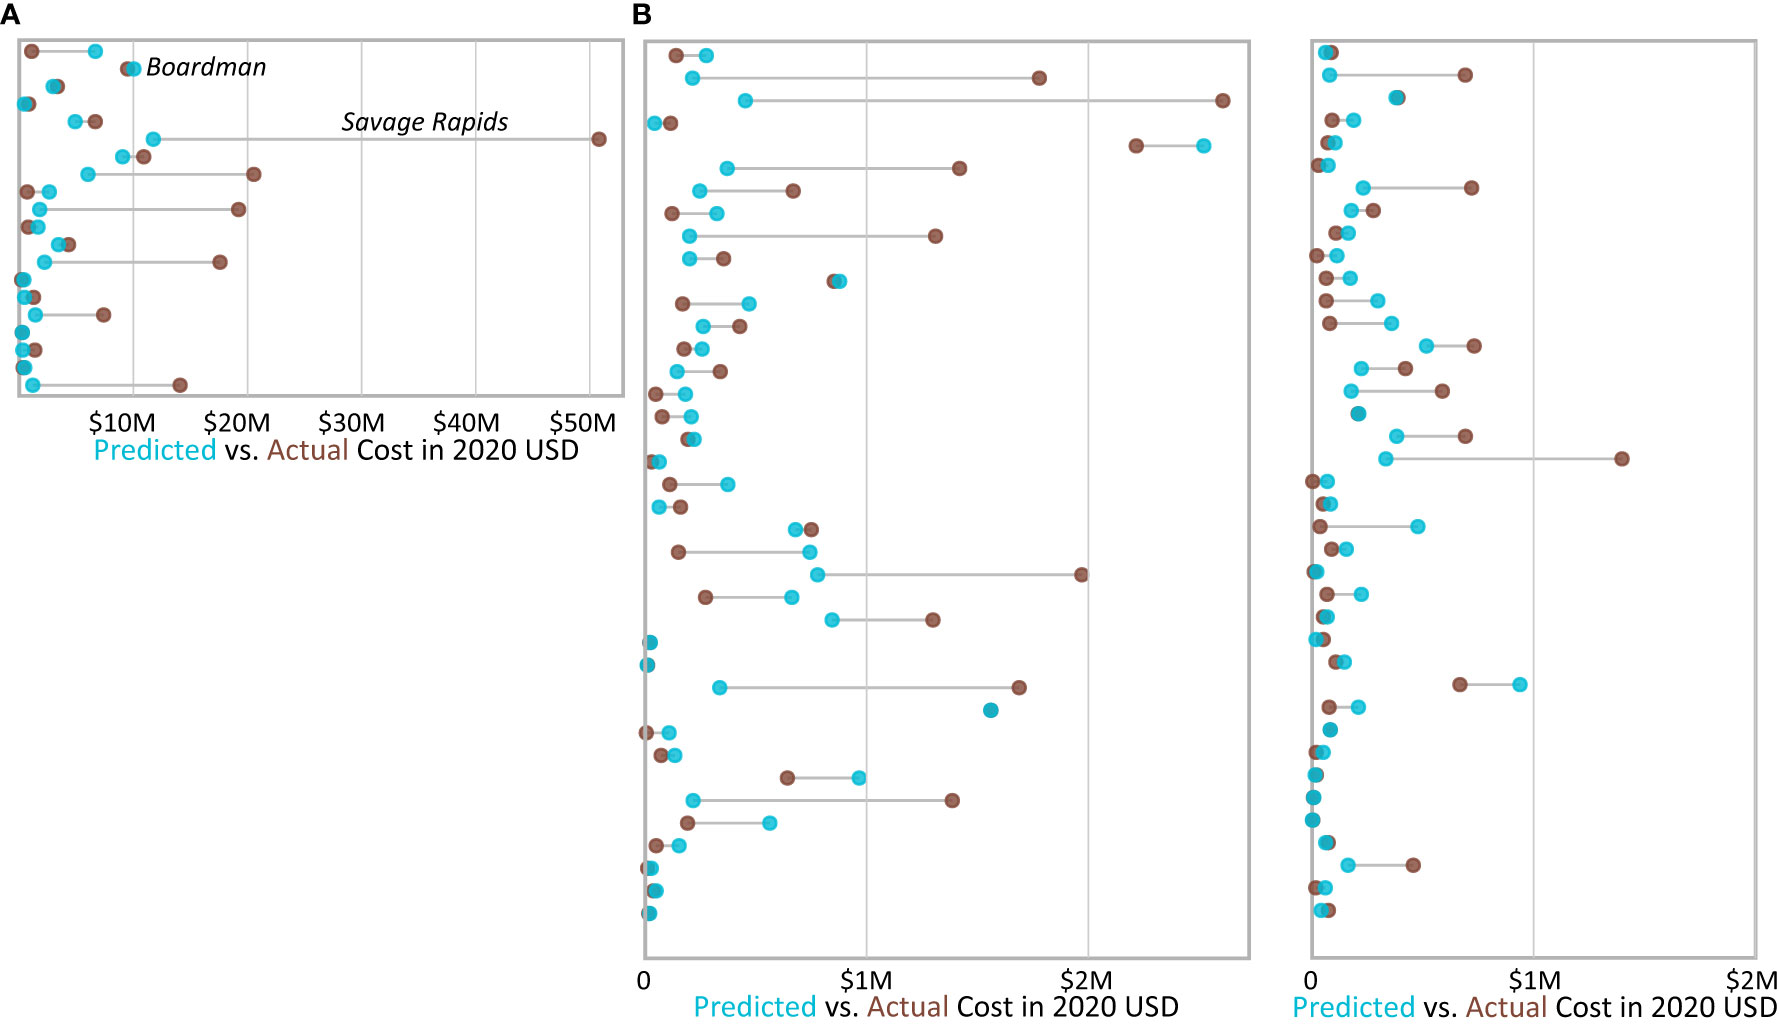
Figure 6 Dumbbell plot of actual (red) and predicted median (blue) costs of removal of individual dams in the test dataset that cost (A) greater than $10M 2020 USD or (B) less than $5M 2020 USD, with select case-study dams labeled for clarity. The length of the grey line between both points indicates the extent of difference between actual and predicted costs.
3.4 Case-studies from the detailed cost database
We also assembled in-depth case studies which provided detailed cost breakdowns from 15 dam removal projects, nine of which overlapped with the larger database. The removed dams varied in terms of location (occurring in 8 states across every region except the Southwest), height (1 m–64 m), drainage area (15 km2–6,369 km2), age (40 yr–288 yr) and overall cost ($75k–$263.73M). These dams showed that construction, mitigation, and design costs were the three largest contributors to total project costs (Figure 7). Across the 15 case studies, construction costs related to removing the dam and associated structures averaged 54% of the total costs (range = 6%–82%), and > 50% of the total cost in 9 of the 15 case-studies. The next highest dam removal project costs were for mitigation measures needed to replace lost functions or minimize effects from dam removal activities, which averaged 22% (range = 0%–80%). Only 3 of the 15 case-studies had mitigation costs exceed 50% of the total project costs (Elwha and Glines Canyon dams and Savage Rapids Dam). Design and permitting cost were the next largest expense, averaging 20% of the total project cost (range 7%–42%). The other three cost categories (litigation, stakeholder related, and monitoring) all had an average cost ≤ 3%.
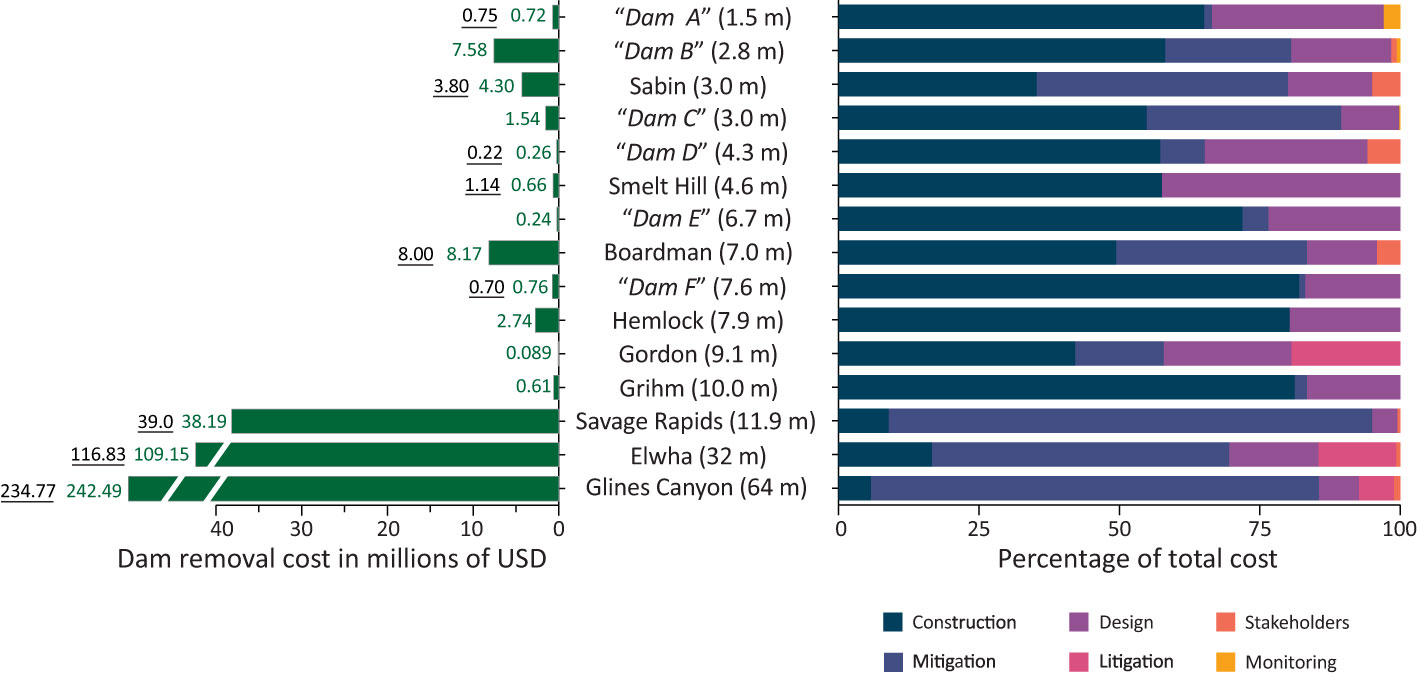
Figure 7 Total cost estimates (left) and cost category breakdown (right) for 15 dams with detailed cost estimates (Tullos and Bountry, 2023). Some dams anonymized to protect proprietary cost data provided by dam removal practitioners. Underlined numbers were reported costs independently derived from our dam removal cost database (Duda et al., 2023).
4 Discussion
What has been lacking, but greatly needed, in the literature of dam removal is empirical data on the cost of dam removal projects and associated analyses about how the cost varies among dams, their characteristics, and the watersheds and regions in which they reside. Such data would illustrate important details on how the planning and engineering of dam removals vary across projects. To address this gap, we compiled cost data for 668 dam removals from a variety of sources, showing geographic trends in allocation of dam removal dollars across the United States over the past 5 decades. The total indexed cost of dam removals was $1.522B U.S. dollars. Assuming that these dam removal costs were representative of the 1,916 dams removed in the United States through 2022 (American Rivers, 2023), an algebraically derived estimate of the total cost for removing dams on U.S. rivers is roughly $4.4B dollars. Like the trends in dam construction and removal, the trends in reported costs were unequally distributed across the United States. In the Northeast and Midwest, proportionally more dam removal dollars were spent on small dams < 5 m in height, which are prevalent in these regions (Tonitto and Riha, 2016). The western United States, in contrast, had more money allocated towards larger and more expensive dam removals which were far fewer in number. In fact, two high-cost dam removal projects in the Northwest (on the Elwha and Clark’s Fork rivers) were responsible for 73% of all dam removal costs in the region. Our predictive cost model showed that dam height, indicative of dam size, was the strongest predictor of removal costs. Costs also increased with river discharge and upstream watershed area, which could be indicative of larger and/or shallower reservoirs potentially trapping sediment from larger areas, resulting in larger areas to manage or restore at the time of dam removal. Project complexity was the third most important predictor and accounts for costs associated with additional activities necessary to manage construction and sediment management, mitigation, and post-removal activities related to the outcomes of dam removal. Regional differences and dam material were also significant but less important factors. Use of the dam removal cost database and the boosted regression model should be a helpful tool to conduct preliminary, planning level assessments of potential dam removal projects. An interactive shiny application based on the cost model has been developed (https://wrises.shinyapps.io/DamRemovalCostPredictiveModel/) as a tool to allow users to explore dam removal costs based on dam characteristics, location, and project complexity. When used with a dam removal prioritization methodology for watersheds in Northern California, our cost data were used to estimate the costs of candidate dam removal for projects in different feasibility categories (Jumani et al., 2023).
Examining the political, social, and historical dimensions of dam removal has revealed both socio-economic and geographic differences in the role that science, aesthetics, politics, regulations, and cultural identity have played in dam removal decision making and outcomes (Johnson and Graber, 2002; Poff and Hart, 2002; Fox et al., 2016; Magilligan et al., 2017; Roy et al., 2018; Roy et al., 2020; Germaine et al., 2021). Our results show that these geographical differences may have influenced where dam removal dollars have been spent across the landscape (Figure 2). Geographical differences can be explained, in part, by the presence or absence of factors related to the density of aging dams or those that do not serve any modern purpose, present a public safety risk, impede natural resources conservation or restoration goals, or economics (Magilligan et al., 2017). Some states, such as Pennsylvania and Wisconsin, have combined policy and regulatory mechanisms, stakeholder coalitions, and a combination of government and private funding to become leaders in removing dams that are aging, unsafe, or no longer serving their intended purpose (Born et al., 1998; Brewitt and Colwyn, 2020). Other states in the Northeast and Midwest, such as Massachusetts, New Hampshire, and Minnesota also have dedicated funding mechanisms and state agencies with staff focused upon dams and their safety, including offices or staff facilitating dam removal. Several projects in the database leveraged locally available funding with federal (e.g., NOAA restoration center) or private (e.g., Open Rivers Fund) programs to raise the necessary funds for dam removals. Other states where fewer dam removals have occurred may not have been afforded the “policy windows” to allow dam removal to be considered as an option for dealing with candidate dams (Doyle et al., 2003), have fewer aging dams, or a combination of both. Another factor that could be driving the geographic differences in dam removal is shifting regulatory and policy spheres at the state level, which can alter institutional structures such as permitting requirements from those that are confusing and excessive to those specifically designed to promote removal of old or unsafe dams (Lindloff, 2003; Lowry, 2005). Similar transitions have occurred at the federal level, for example the nationwide permit 53 from the Army Corps of Engineers for low-head dam removals (U.S. Army Corps of Engineers, 2022b).
Earlier studies have shown that safety was the most cited reason for dam removal, but the transition to environmental rationales starting in the 1990s (Pohl, 2002) has continued through the 2010s. Our results showed that safety and economics were less commonly cited as dam removal rationales compared with river restoration. Twenty years ago, during a spate of dam removal research publications (e.g., Graf, 2002; Poff and Hart, 2002; Pohl, 2002; Stanley and Doyle, 2003), the lack of empirical information about project cost led some to conclude that decision makers consistently overestimated the cost of dam removal and underestimated the cost of retaining dams (Graf, 2002). It also limited the ability of researchers to build predictive cost models for dam removal (Orr et al., 2004). Despite this, empirical information of regional dam removals that had both cost and repair estimates showed that it was often less expensive to remove a dam than to repair or rebuild it (Born et al., 1998; Johnson and Graber, 2002). In their assessment of river restoration projects in the United States, Bernhardt et al. (2005) reported that in their database of over 37,000 river restoration projects, only 58% had information on project costs. We were able to find a reported cost for 38% of dam removal projects listed in the American Rivers dam removal database through 2020, showing that the “piecemeal” information about river restoration projects, including dam removals, may not have appreciably improved. Natural resources agencies, conservation organizations, and the dam removal community would benefit from the expansion and maintenance of existing dam removal cost databases, including in areas where such resources are lacking but the practice of dam removal is accelerating.
We surmise that, in most cases, the cost data represent an underestimate of the true and total cost of dam removal. There are several possibilities that could lead to inaccuracies (i.e., both under- and over-estimates) in our total cost data set. The factors contributing to underestimating total dam removal costs include non-reporting of in-kind costs (e.g., agency labor; Bernhardt et al., 2005), expenditures dealing with pre-project planning (e.g., litigation, stakeholder concerns), and post-project monitoring. Another source contributing to uncertainty is the potential for cost data to occur in information silos. Historically, dam removal costs were assembled from several sources, resembling “a patchwork quilt” of funding (Otto, 2000). We do not know whether sources used in our database accurately reported the entire pool of dam removal funding provided by all sources, or just those costs specific to a given funding source. It is also possible that the reported costs we found were based on initial bids or cost estimates and did not include change orders or other non-reported expenses that impacted the total cost. Comparing the seven overlapping cases of the Tullos and Bountry (2023) detailed case-studies with the Duda et al. (2023) dam removal cost database, the costs were highly correlated (r = 0.99, df = 5, p<0.001) with the largest absolute difference being 11.6% of total project cost.
The 15 individual case-studies compiled in Tullos and Bountry (2023) help identify how the breakdown of key cost components can vary, highlighting why cost estimation can be challenging. We compared two dams with detailed cost data that were of similar height but vastly different total costs and cost profiles (Figure 7). “Dam F” (name redacted to protect proprietary information) was a 7.6 m tall hydropower dam owned by a public utility district. The dam stored very little (~382 m3) coarse, uncontaminated sediment which allowed permitting to be streamlined, resulting in a relatively straightforward and inexpensive ($0.75M) project dominated (82%) by construction related costs. In contrast, Boardman Dam was a 7 m tall (hydraulic height) dam owned by a local government. Although the dam’s primary purpose was to deliver flow for irrigation, the project also operated a small hydropower plant. Project complexities, including construction of new roads, relocation of utilities, and construction of public interpretation facilities contributed to higher costs for the Boardman Dam removal (totaling $8.17M). Two key project requirements in the mitigation cost driver category elevated costs for Boardman Dam removal compared to the similarly sized Dam F removal. The first was associated with concerns about and activities related to managing the 460,621 m3 of stored sediment. While about 40% of the sediment was eroded to the downstream reach, 30% was stabilized within the reservoir, and the remaining 30% was mechanically removed. In addition, a pilot channel was excavated through the reservoir sediment deposits and the reservoir drawdown rate was restricted to avoid slope failures. The second cost driver was associated with substantial mitigation activities at a cost of $2.7M (41% of the total cost), including levee/bank protection ($486.7k) and creation/mitigation of river habitat features ($610.5k). Finally, the Boardman project reported over $300k in required monitoring of reservoir erosion, water quality, and aquatic organisms including fish. Thus, despite two projects involving similar sized dams, lacking contaminated sediments and both having hydroelectric facilities and equipment present that had to be removed, the costs were 10.7x higher for the Boardman Dam project due to local concerns about the release of stored sediment that increased sediment management, flood control, and habitat mitigation costs. The complexities of the Boardman Dam removal were encapsulated within the project complexity score in the cost database (0.46), which explains the similarity between the actual and model predicted costs for this project (Figures 5, 6).
The Savage Rapids Dam on the Rogue River near Grants Pass, Oregon, is another noteworthy case-study where the large discrepancies between the actual ($50.80M) and predicted ($11.80M) costs of dam removal (Figures 5, 6) can be better understood by examining the component-wise breakdown from the detailed cost database. Savage Rapids was a 12 m tall diversion dam owned by a local irrigation district that was removed to improve both adult (upstream) and juvenile (downstream) anadromous fish passage. The reservoir was operated at a higher elevation using gates to seasonally divert water, such that reservoir sedimentation was only present in the permanent (lower) winter pool. The reservoir contained 542.8 m3 of uncontaminated sand and gravel, and river erosion was used to erode and transport the deposit into the downstream channel. Although construction costs for decommissioning were not inexpensive ($3.40M) due to the requirement to utilize coffer dams (so that all work was performed, “in the dry” and fish passage was maintained throughout construction), it comprised a very small portion (9%) of the total costs. The construction did include creation of a pilot channel, revegetation of a newly created floodplain, and removal of a historical timber crib dam, but these items were minor costs and completed in just a few days. Instead, mitigation for the lost function of the dam (irrigation diversion) was the major cost driver. A new pumping plant and water conveyance pipe crossing was constructed at a cost of $32.87M, which represented 86% of the total cost and the bulk of design and construction effort. Further, litigation occurred to remove the dam, although these costs were not reported or represented in the database. Thus, Savage Rapids Dam reflects the type of project where project costs are not easily predicted solely by the size of the dam, the volume of sediment stored, or binary presence/absence indicators of project complexity. The high mitigation costs are likely a reason that our dam removal cost model underestimated the cost of the dams. The lack of information on the extent of influence of each cost driver may result in discrepancies between actual and predicted costs, particularly in such cases where one or more actions are associated with a large fraction of the total cost.
5 Conclusions
There is a pressing need to improve the volume and quality of empirical dam removal cost data to better inform dam removal planning. Given the large number of dams in the world and their finite lifespan, there is a strong likelihood that the practice of dam removal will continue (Stanley and Doyle, 2003). One recent estimate predicted that by 2050 between 4,000 and 32,000 more dams will be removed in the United States (Grabowski et al., 2018). Coupling cost information with the demographics of the dam (e.g., age, height), biogeographic information about the river (e.g., stream order, discharge), and estimates of cost drivers (e.g., mitigation requirements like reservoir revegetation and sediment management) is critical for contextualizing dam removal costs, determining geographic variability, and providing information for decision makers. As societies contemplate the future role of dams in the face of aging infrastructure and climate change (Beatty et al., 2017; Ho et al., 2017; Concha Larrauri et al., 2023), accurate data on dam removal cost are needed for decision makers and the public to assess whether a given dam should be removed, repaired, or rebuilt. Such data could be coupled with other emerging science and tools that describe how to prioritize, conduct, study, and manage dam removal projects (Hoenke et al., 2014; Wohl et al., 2015; Tullos et al., 2016; Bellmore et al., 2017; Bellmore et al., 2019; Curry et al., 2020; Jumani et al., 2023). Several of the factors in our cost model’s partial dependence plots showed that more data are needed to improve the precision and applicability of the models. We encourage practitioners, funders, and natural resources agencies that participate in dam removal to develop consensus records of total project costs and make those available to data scientists. A national database of dam removal costs that included component cost breakdowns, the presence of cost drivers aside from construction costs, and accurate demographic data on the dams (e.g., location, age, height, sediment volume) would dramatically improve the ability to learn from past projects and predict the costs of future projects.
Data availability statement
The datasets presented in this study can be found in online repositories. The names of the repository/repositories and accession number(s) can be found below: https://doi.org/10.5066/P9G8V371 and https://doi.org/10.7267/h415pj58r.
Author contributions
JD – conceptualization, methodology, data curation, data analysis, original draft, review & editing, visualization, project administration, funding acquisition. SJ – data analysis, original draft, review & editing, visualization. DW – conceptualization, methodology, data curation, review & editing. DT – conceptualization, methodology, data curation, data analysis, original draft, review & editing, funding acquisition. SKM – conceptualization, methodology, data curation, data analysis, review & editing, funding acquisition. TR, AJ, and SB – conceptualization, methodology, review & editing, funding acquisition. BJ, RJ, EW, and KR – data curation, data analysis, review & editing. SW and EJW – methodology, data analysis, review & editing. JB – conceptualization, methodology, data curation, data analysis, review & editing, visualization, project administration, funding acquisition. All authors contributed to the article and approved the submitted version.
Funding
Funding for this project was provided by the Bureau of Reclamation, the U.S. Geological Survey’s Ecosystems and Core Science Systems mission areas, the U.S. Army Corps of Engineers’ Ecosystem Management and Restoration Research Program, and the U.S. Army Corps of Engineers’ Engineering with Nature Program. Participation by SJ was supported in part by an appointment to the Department of Defense (DOD) Research Participation Program administered by the Oak Ridge Institute for Science and Education (ORISE) through an interagency agreement between the U.S. Department of Energy (DOE) and the DOD. ORISE is managed by ORAU under DOE contract number DE-SC0014664.
Acknowledgments
We gratefully acknowledge the practitioners and managers who provided dam removal cost information. Our thanks to Jessie Thomas-Blate, Laura Wildman, and Peter Haig for assistance and thoughtful comments about the direction of the project. Nicole Samu’s cartography in the U.S. Department of Energy’s 2020 National Hydropower Map provided the inspiration for our map visualization of dam removal cost. Our gratitude to Pat Shafroth, Matthew McCartney, and Silvia Secchi, who provided valuable comments that improved the manuscript. This article has been peer reviewed and approved for publication consistent with USGS Fundamental Science Practices (https://pubs.usgs.gov/circ/1367/). Any use of trade, firm, or product names is for descriptive purposes only and does not imply endorsement by the U.S. Government.
Conflict of interest
The authors declare that the research was conducted in the absence of any commercial or financial relationships that could be construed as a potential conflict of interest.
Publisher’s note
All claims expressed in this article are solely those of the authors and do not necessarily represent those of their affiliated organizations, or those of the publisher, the editors and the reviewers. Any product that may be evaluated in this article, or claim that may be made by its manufacturer, is not guaranteed or endorsed by the publisher.
Supplementary material
The Supplementary Material for this article can be found online at: https://www.frontiersin.org/articles/10.3389/fevo.2023.1215471/full#supplementary-material
References
Aadland L. (2010) Reconnecting rivers: natural channel design in dam removals and fish passage. Available at: https://www.dnr.state.mn.us/eco/streamhab/reconnecting_rivers.html.
American Rivers. (2023). American Rivers dam removal database. Figshare. doi: 10.6084/m9.figshare.5234068.v10
Barbarossa V., Schmitt R. J. P., Huijbregts M. A. J., Zarfl C., King H., Schipper A. M. (2020). Impacts of current and future large dams on the geographic range connectivity of freshwater fish worldwide. Proc. Natl. Acad. Sci. 117, 3648–3655. doi: 10.1073/pnas.1912776117
Beatty S., Allen M., Lymbery A., Jordaan M. S., Morgan D., Impson D., et al. (2017). Rethinking refuges: implications of climate change for dam busting. Biol. Conserv. 209, 188–195. doi: 10.1016/j.biocon.2017.02.007
Bellmore J. R., Duda J. J., Craig L. S., Greene S. L., Torgersen C. E., Collins M. J., et al. (2017). Status and trends of dam removal research in the United States. Wiley Interdiscip. Rev. Water 4, e1164. doi: 10.1002/wat2.1164
Bellmore J. R., Pess G. R., Duda J. J., O’Connor J. E., East A. E., Foley M. M., et al. (2019). Conceptualizing ecological responses to dam removal: if you remove it, what’s to come? BioScience 69, 26–39. doi: 10.1093/biosci/biy152
BenDor T., Lester T. W., Livengood A., Davis A., Yonavjak L. (2015). Estimating the size and impact of the ecological restoration economy. PloS One 10, e0128339. doi: 10.1371/journal.pone.0128339
Bernhardt E. S., Palmer M. A., Allan J. D., Alexander G., Barnas K., Brooks S., et al. (2005). Synthesizing U.S. river restoration efforts. Science 308, 636–637. doi: 10.1126/science.1109769
Born S. M., Genskow K. D., Filbert T. L., Hernandez-Mora N., Keefer M. L., White K. A. (1998). Socioeconomic and institutional dimensions of dam removals: the Wisconsin experience. Environ. Manage. 22, 359–370. doi: 10.1007/s002679900111
Bountry J. A., Yong G., Randle T. J. (2013). Sediment impacts from the savage rapids dam removal, Rogue River, Oregon. GSA Rev. Eng. Geol. 21, 93–104. doi: 10.1130/2013.4121(08
Brakebill J. W., Schwarz G. E., Wieczorek M. E. (2020). An enhanced hydrologic stream network based on NHDPlus medium resolution dataset. Scientific Investigations Report 2019–5127. (Reston, VA: U.S. Geological Survey).
Branco P., Segurado P., Santos J. M., Ferreira M. T. (2014). Prioritizing barrier removal to improve functional connectivity of rivers. J. Appl. Ecol. 51, 1197–1206. doi: 10.1111/1365-2664.12317
Brewitt P. K., Colwyn C. L. (2020). Little dams, big problems: the legal and policy issues of nonjurisdictional dams. Wiley Interdiscip. Rev. Water 7, e1393. doi: 10.1002/wat2.1393
Bunn S. E., Arthington A. H. (2002). Basic principles and ecological consequences of altered flow regimes for aquatic biodiversity. Environ. Manage. 30, 492–507. doi: 10.1007/s00267-002-2737-0
Collen B., Whitton F., Dyer E. E., Baillie J. E. M., Cumberlidge N., Darwall W. R. T., et al. (2014). Global patterns of freshwater species diversity, threat and endemism. Glob. Ecol. Biogeogr. 23, 40–51. doi: 10.1111/geb.12096
Concha Larrauri P., Lall U., Hariri-Ardebili M. A. (2023). Needs for portfolio risk assessment of aging dams in the United States. J. Water Resour. Plan. Manage. 149, 04022083. doi: 10.1061/JWRMD5.WRENG-5673
Curry R. A., Yamazaki G., Linnansaari T., Monk W., Samways K. M., Dolson R., et al. (2020). Large Dam renewals and removals–part 1: building a science framework to support a decision-making process. River Res. Appl. 36, 1460–1471. doi: 10.1002/rra.3680
Doyle M. W., Harbor J. M., Stanley E. H. (2003). Toward policies and decision-making for dam removal. Environ. Manage. 31, 453–465. doi: 10.1007/s00267-002-2819-z
Doyle M. W., Stanley E. H., Havlick D. G., Kaiser M. J., Steinbach G., Graf W. L., et al. (2008). Aging infrastructure and ecosystem restoration. Science 319, 286–287. doi: 10.1126/science.1149852
Duda J. J., Bellmore J. R. (2022). “Dam removal and river restoration,” in Encyclopedia of inland waters. Eds. Mehner T., Tockner K. (Oxford, UK: Elsevier, Ltd.), 576–585. doi: 10.1016/B978-0-12-819166-8.00101-8
Duda J. J., Camp R. J. (2008). Ecology in the information age: patterns of use and attrition rates of internet-based citations in ESA journals 1997–2005. Front. Ecol. Environ. 6, 145–151. doi: 10.1890/070022
Duda J. J., Johnson R. C., Jensen B. L., Wagner E. J., Richards K., Wieferich D. J. (2023). Compilation of cost estimates for dam removal projects in the United States. U.S. Geological Survey data release. doi: 10.5066/P9G8V371
Duda J., Johnson R. C., Wieferich D. J., Wagner E. J., Bellmore J. R. (2018). USGS dam removal science database v4.0. U.S. Geological Survey data release. doi: 10.5066/P9IGEC9G
Elith J., Leathwick J. R., Hastie T. (2008). A working guide to boosted regression trees. J. Anim. Ecol. 77, 802–813. doi: 10.1111/j.1365-2656.2008.01390.x
Foley M. M., Bellmore J. R., O’Connor J. E., Duda J. J., East A. E., Grant G. E., et al. (2017). Dam removal: listening in. Water Resour. Res. 53, 5229–5246. doi: 10.1002/2017WR020457
Fox C. A., Magilligan F. J., Sneddon C. S. (2016). “You kill the dam, you are killing a part of me”: dam removal and the environmental politics of river restoration. Geoforum 70, 93–104. doi: 10.1016/j.geoforum.2016.02.013
Friedman J. H. (2002). Stochastic gradient boosting. Comput. Stat. Data Anal. 38, 367–378. doi: 10.1016/S0167-9473(01)00065-2
Germaine M., Drapier L., Lespez L., Styler-Barry B. (2021). “How to better involve stakeholders in river restoration projects: the case of small dam removals,” in River restoration. Eds. Morandi B., Cottet M., Piégay H. (Hoboken, NH: John Wiley and Sons), 147–168. doi: 10.1002/9781119410010.ch7
Grabowski Z. J., Chang H., Granek E. F. (2018). Fracturing dams, fractured data: empirical trends and characteristics of existing and removed dams in the United States. River Res. Appl. 34, 526–537. doi: 10.1002/rra.3283
Graf W. L. (2002). Dam removal: science and decision making. Ed. John Heinz H. III (Washington, D.C: Center for Science, Economics and the Environment).
Guetz K., Joyal T., Dickson B., Perry D. (2022). Prioritizing dams for removal to advance restoration and conservation efforts in the western United States. Restor. Ecol. 30, e13583. doi: 10.1111/rec.13583
Habel M., Mechkin K., Podgorska K., Saunes M., Babiński Z., Chalov S., et al. (2020). Dam and reservoir removal projects: a mix of social-ecological trends and cost-cutting attitudes. Sci. Rep. 10, 19210. doi: 10.1038/s41598-020-76158-3
Hastie T., Friedman J. H., Tibshirani R. (2001). “Boosting and additive trees,” in The elements of statistical learning (New York, NY: Springer International Publishing). doi: 10.1007/978-0-387-21606-5_10
Ho M., Lall U., Allaire M., Devineni N., Kwon H. H., Pal I., et al. (2017). The future role of dams in the United States of America. Water Resour. Res. 53, 982–998. doi: 10.1002/2016WR019905
Hoenke K. M., Kumar M., Batt L. (2014). A GIS based approach for prioritizing dams for potential removal. Ecol. Eng. 64, 27–36. doi: 10.1016/j.ecoleng.2013.12.009
Hotchkiss R. H., Kern E. (2023) Locations of fatalities at submerged hydraulic jumps (Brigham Young University). Available at: https://krcproject.groups.et.byu.net/browse.php (Accessed April 28, 2023).
Johnson S. E., Graber B. E. (2002). Enlisting the social sciences in decisions about dam removal. BioScience 52, 731. doi: 10.1641/0006-3568(2002)052[0731:ETSSID]2.0.CO;2
Jumani S., Andrews L., Grantham T. E., McKay S. K., Duda J., Howard J. (2023). A decision-support framework for dam removal planning and its application in northern California. Environ. Chall. 12, 100731. doi: 10.1016/j.envc.2023.100731
Juracek K. E. (2015). The aging of America’s reservoirs: in-reservoir and downstream physical changes and habitat implications. JAWRA J. Am. Water Resour. Assoc. 51, 168–184. doi: 10.1111/jawr.12238
Kuhn M., Wing J., Weston S., Williams A., Keefer C., Engelhardt A., et al. (2022) Package “caret”. Available at: https://github.com/topepo/caret/.
Lindloff S. D. (2003). Institutionalizing the option of dam removal: the New Hampshire initiative. Water Sci. Technol. 48, 9–16. doi: 10.2166/wst.2003.0419
Lowry W. R. (2005). Policy reversal and changing politics: state governments and dam removals. State Polit. Policy Q. 5, 394–419. doi: 10.1177/153244000500500405
Magilligan F. J., Sneddon C. S., Fox C. A. (2017). The social, historical, and institutional contingencies of dam removal. Environ. Manage. 59, 982–994. doi: 10.1007/s00267-017-0835-2
McKay S. K., Cooper A. R., Diebel M. W., Elkins D., Oldford G., Roghair C., et al. (2017). Informing watershed connectivity barrier prioritization decisions: a synthesis. River Res. Appl. 33, 847–862. doi: 10.1002/rra.3021
McKay S. K., Martin E. H., McIntyre P. B., Milt A. W., Moody A. T., Neeson T. M. (2020). A comparison of approaches for prioritizing removal and repair of barriers to stream connectivity. River Res. Appl. 36, 1754–1761. doi: 10.1002/rra.3684
Mubarak S. A. (2016). How to estimate with RSMeans data: basic skills for building construction. Fifth edition (Hoboken, New Jersey: John Wiley & Sons Inc).
Naiman R. J., Décamps H., McClain M. E. (2005). Riparia: ecology, conservation, and management of streamside communities (Oxford: Elsevier Academic).
O’Connor J. E., Duda J. J., Grant G. E. (2015). 1000 dams down and counting. Science 348, 496–497. doi: 10.1126/science.aaa9204
Orr C. H., Roth B. M., Forshay K. J., Gonzales J. D., Papenfus M. M., Wassell R. D. G. (2004). Examination of physical and regulatory variables leading to small dam removal in Wisconsin. Environ. Manage. 33, 99–109. doi: 10.1007/s00267-003-2941-6
Otto B. (2000). Paying for dam removal: a guide to select funding sources (Washington, D.C: American Rivers).
Park J., Kwak Y. H. (2017). Design-Bid-Build (DBB) vs. design-build (DB) in the U.S. public transportation projects: the choice and consequences. Int. J. Proj. Manage. 35, 280–295. doi: 10.1016/j.ijproman.2016.10.013
Poff N. L., Hart D. D. (2002). How dams vary and why it matters for the emerging science of dam removal. BioScience 52, 659. doi: 10.1641/0006-3568(2002)052[0659:HDVAWI]2.0.CO;2
Poff N. L., Zimmerman J. K. H. (2010). Ecological responses to altered flow regimes: a literature review to inform the science and management of environmental flows: review of altered flow regimes. Freshw. Biol. 55, 194–205. doi: 10.1111/j.1365-2427.2009.02272.x
Pohl M. M. (2002). Bringing down our dams: trends in American dam removal rationales. J. Am. Water Resour. Assoc. 38, 1511–1519. doi: 10.1111/j.1752-1688.2002.tb04361.x
Randle T. J., Morris G. L., Tullos D. D., Weirich F. H., Kondolf G. M., Moriasi D. N., et al. (2021). Sustaining United States reservoir storage capacity: need for a new paradigm. J. Hydrol. 602, 126686. doi: 10.1016/j.jhydrol.2021.126686
R Core Team (2022) R: a language and environment for statistical computing. Available at: https://www.R-project.org/.
Reid A. J., Carlson A. K., Creed I. F., Eliason E. J., Gell P. A., Johnson P. T. J., et al. (2019). Emerging threats and persistent conservation challenges for freshwater biodiversity. Biol. Rev. 94, 849–873. doi: 10.1111/brv.12480
Roy S. G., Daigneault A., Zydlewski J., Truhlar A., Smith S., Jain S., et al. (2020). Coordinated river infrastructure decisions improve net social-ecological benefits. Environ. Res. Lett. 15, 104054. doi: 10.1088/1748-9326/abad58
Roy S. G., Uchida E., de Souza S. P., Blachly B., Fox E., Gardner K., et al. (2018). A multiscale approach to balance trade-offs among dam infrastructure, river restoration, and cost. Proc. Natl. Acad. Sci. 115, 12069–12074. doi: 10.1073/pnas.1807437115
Shrestha P. P., O’Connor J. T., Gibson G. E. (2012). Performance comparison of large design-build and design-bid-build highway projects. J. Constr. Eng. Manage. 138, 1–13. doi: 10.1061/(ASCE)CO.1943-7862.0000390
Stanley E. H., Doyle M. W. (2003). Trading off: the ecological effects of dam removal. Front. Ecol. Environ. 1, 15–22. doi: 10.1890/1540-9295(2003)001[0015:TOTEEO]2.0.CO;2
Strahler A. N. (1957). Quantitative analysis of watershed geomorphology. Trans. Am. Geophys. Union 38, 913. doi: 10.1029/TR038i006p00913
Tonitto C., Riha S. J. (2016). Planning and implementing small dam removals: lessons learned from dam removals across the eastern United States. Sustain. Water Resour. Manage. 2, 489–507. doi: 10.1007/s40899-016-0062-7
Tullos D. D., Bountry J. A. (2023). Detailed dam removal costs and cost drivers [Data set] (Corvallis, OR: Oregon State University). doi: 10.7267/h415pj58r
Tullos D. D., Collins M. J., Bellmore J. R., Bountry J. A., Connolly P. J., Shafroth P. B., et al. (2016). Synthesis of common management concerns associated with dam removal. JAWRA J. Am. Water Resour. Assoc. 52, 1179–1206. doi: 10.1111/1752-1688.12450
U.S. Army Corps of Engineers (2022a) Civil works construction cost index system (Vicksburg, MS: U.S. Army Corps of Engineers). Available at: https://www.publications.usace.army.mil/USACE-Publications/Engineer-Manuals/ (Accessed April 28, 2023).
U.S. Army Corps of Engineers (2022b) NWP 53 - removal of low-head dams. Available at: https://saw-reg.usace.army.mil/NWP2021/NWP-53.pdf (Accessed April 28, 2023).
U.S. Army Corps of Engineers (2023) National inventory of dams. Available at: https://nid.sec.usace.army.mil/ (Accessed April 28, 2023).
Vahedifard F., Madani K., AghaKouchak A., Thota S. K. (2021). Are we ready for more dam removals in the United States? Environ. Res. Infrastruct. Sustain. 1, 013001. doi: 10.1088/2634-4505/abe639
Waldman J. R., Quinn T. P. (2022). North American diadromous fishes: drivers of decline and potential for recovery in the anthropocene. Sci. Adv. 8, eabl5486. doi: 10.1126/sciadv.abl5486
Wieferich D. J., Duda J., Wright J. J., Uribe R. D., Beard J. W. (2021). Dam removal information portal dashboard Python dash software. U.S. Geological Survey software release. doi: 10.5066/P9UNIWKF
Winter B. D., Crain P. (2008). Making the case for ecosystem restoration by dam removal in the Elwha River, Washington. Northwest Sci. 82 (sp1), 13–28. doi: 10.3955/0029-344X-82.S.I.13
Wohl E., Lane S. N., Wilcox A. C. (2015). The science and practice of river restoration. Water Resour. Res. 51, 5974–5997. doi: 10.1002/2014WR016874
Keywords: dam removal, cost drivers, economics, river restoration, cost engineering
Citation: Duda JJ, Jumani S, Wieferich DJ, Tullos D, McKay SK, Randle TJ, Jansen A, Bailey S, Jensen BL, Johnson RC, Wagner E, Richards K, Wenger SJ, Walther EJ and Bountry JA (2023) Patterns, drivers, and a predictive model of dam removal cost in the United States. Front. Ecol. Evol. 11:1215471. doi: 10.3389/fevo.2023.1215471
Received: 02 May 2023; Accepted: 03 July 2023;
Published: 24 July 2023.
Edited by:
Sarah Null, Utah State University, United StatesReviewed by:
Matthew McCartney, International Water Management Institute, Sri LankaSilvia Secchi, The University of Iowa, United States
At least a portion of this work is authored by Jeffrey J. Duda, Suman Jumani, Daniel J. Wieferich, S. Kyle McKay, Timothy J. Randle, Alvin Jansen, Susan Bailey, Benjamin L. Jensen, Rachelle C. Johnson, Ella Wagner, Kyla Richards, and Jennifer A. Bountry on behalf of the U.S. Government and as regards Mr. Duda, Dr. Jumani, Mr. Wieferich, Dr. McKay, Dr. Randle, Mr. Jansen, Ms. Bailey, Mr. Jensen, Dr. Johnson, Ms. Wagner, Ms. Richards, and Ms. Bountry and the U.S. Government, is not subject to copyright protection in the United States. Foreign and other copyrights may apply. This is an open-access article distributed under the terms of the Creative Commons Attribution License (CC BY). The use, distribution or reproduction in other forums is permitted, provided the original author(s) and the copyright owner(s) are credited and that the original publication in this journal is cited, in accordance with accepted academic practice. No use, distribution or reproduction is permitted which does not comply with these terms.
*Correspondence: Jeffrey J. Duda, jduda@usgs.gov