Benchmark for the ESA: Having a Backbone Is Good for Recovery
 Aaron M. Haines1*
  Matthias Leu2
  Delaney M. Costante2 Tyler C. Treakle2 Carli Parenti1
  Jennifer R. B. Miller3,4
  Jacob W. Malcom3,4
- 1Applied Conservation Lab, Biology Department, Millersville University, Millersville, PA, United States
- 2Biology Department, William & Mary, Williamsburg, VA, United States
- 3Center for Conservation Innovation, Defenders of Wildlife, Washington, DC, United States
- 4Department of Environmental Science and Policy, George Mason University, Fairfax, VA, United States
To forestall the current rate of global extinction, we need to identify strategies that successfully recover species. In the last decade, the recovery record for the United States Endangered Species Act (ESA) has improved. Our aim was to review federal delisting documents for recovered species and quantify patterns in taxonomy, history of threats, policy, funding and actions that are associated with species recovery. In comparison to species still listed, the average recovered species was a vertebrate, had been listed longer under the ESA, was exposed to a lower number of threats at the time of listing, and received relatively higher levels of funding. Based on our review, we suggest the following strategies to improve species recovery: provide more time for ESA protection, allocate more funding for recovery, maintain environmental regulations that facilitate recovery, establish more private landowner agreements, and increase the area of protected lands.
Introduction
The current rate of global extinction is 10 to 1,000 times higher than the planet's baseline average (De Vos et al., 2015; Díaz et al., 2019). This is a byproduct of intense human activity causing habitat conversion, overexploitation of species, growing impacts of climate change, pollution, and spread of invasive species (Wilcove et al., 1998; Pimm et al., 2014; Ceballos et al., 2015; Díaz et al., 2019; Leu et al., 2019). There is broad agreement that transformative change, including increased investment in conservation (Malcom et al., 2019), is needed to protect, maintain, and restore biodiversity and curb the extinction crisis (Díaz et al., 2019). To help direct such change, it is important to understand which factors predispose conservation efforts toward successful species recovery from the brink of extinction (Luther et al., 2016). For example, the International Union of the Conservation of Nature (IUCN) is currently in the process of creating metrics to define species recovery and identify a “green list” of species that were once vulnerable and are now recovered (Akçakaya et al., 2018). The purpose of this list is to learn from species conservation success stories and develop an optimistic vision of species conservation. Lessons learned could provide a road map on how to achieve species recovery to incentivize positive recovery actions and programs ([IUCN] International Union for the Conservation of Nature., 2020).
Many countries have laws and regulations to protect and recover native species and populations, such as Canada's Species at Risk Act of 2002, United Kingdom's Wildlife and Countryside Act of 1981, Australia's Endangered Species Protection Act of 1992, and New Zealand's Conservation Act of 1987. In the United States (US), the strongest law for preventing species extinction is the Endangered Species Act (ESA) (Taylor et al., 2005; Malcom and Li, 2015; Evans et al., 2016; Gerber et al., 2018). The ESA has been associated with recovering iconic species such as the peregrine falcon (Falco peregrinus) and bald eagle (Haliaeetus leucocephalus), as well as lesser-known species including the Magazine Mountain shagreen snail (Inflectarius magazinensis) and the Johnston's frankenia flowering plant (Frankenia johnstonii).
As of January 2020, 46 US native species have been removed from the ESA list due to their recovery ([USFWS] US Fish Wildlife Service, 2020a). A species listed under the ESA is recovered when it is no longer “in danger of extinction throughout all or a significant portion of its range” [ESA sec. 3(6), an endangered species] nor likely to become so “within the foreseeable future” [ESA sec. 3(20), a threatened species]. The United States Fish and Wildlife Service (USFWS) and the National Oceanic and Atmospheric Administration's National Marine Fisheries Service (collectively, the Services) use species recovery plans to guide recovery on a species-by-species basis (Neel et al., 2012). A species recovery plan identifies measurable recovery criteria that, when achieved, would justify a species to be categorized as recovered. However, these recovery criteria are not legally binding [Ginsburg, 2012, ESA sec. 4(f)(1)], and many recommendations have been provided to improve recovery criteria outlined in recovery plans (Neel et al., 2012; Evans et al., 2016; Li et al., 2020). Delisting documents provide the Services' official decision and rationale for delisting a species from the ESA (Neel et al., 2012).
Foin et al. (1998) strongly advocated for continuing analysis of species recovery under the ESA to identify the patterns and histories of recovery success, but there have been, to our knowledge, no analyses since then. Thus, much like the proposed IUCN “green list,” our goal was to review and quantify the record of species recovery within the ESA and identify laws, practices and recovery actions that are associated with species recovery. Based on previous literature, we predicted that recovered species would consist of more charismatic taxa with higher rates of funding, longer listing periods under the ESA and fewer threats at time of listing compared to non-recovered species (Taylor et al., 2005; Gibbs and Currie, 2012; Evans et al., 2016; Leu et al., 2019). The only government data available on the progress of listed species toward recovery were biennial reports that the Services (i.e., USFWS and National Oceanic and Atmospheric Administration) submitted to Congress. These reports provided a 2-year status update on each species; however, these reports were terminated in 2012. By looking at the record of recovery as of January 2020, our analysis serves as a benchmark to ESA recovery and can provide insight on what has enabled successful recovery of native species and how recovered species differ from currently listed species.
Materials and Methods
A species can be delisted from the ESA because it has become extinct, undergone a taxonomic revision, been revaluated due to new information suggesting that protection is no longer warranted, or has recovered ([USFWS] US Fish Wildlife Service, 2020a). In our analysis, we focused on the record for species recovery for US native species (i.e., species that occur in the US and its territories; note Palau became an independent nation in 1994) because the detail of recovery efforts for these species are well documented. In addition, foreign listed species do not have recovery plans, and legal protections of the ESA are unenforceable outside US jurisdiction (Foley et al., 2017). We reviewed species delisting documents, obtained from the Environmental Conservation Online System website (ECOS, ecos.fws.gov; [USFWS] US Fish Wildlife Service, 2020a) and the US Federal Register website (www.federalregister.gov/) to identify recovery actions that aided in species recovery including international, federal, state, and local polices that provided protection assurances to species post-delisting. We also reviewed delisting documents to determine if justification for species recovery followed specific recovery criteria as laid out in species recovery plans.
To identify factors that differed between recovered and currently listed species, we compared time listed under the ESA (i.e., for recovered species this was the number of years between listing and delisting), taxonomic composition, and threats at time of listing (i.e., habitat modification, pollution, overutilization, environmental stochasticity, demographic stochasticity and/or species-species interactions; Leu et al., 2019) between the two groups. We also compared the number of threats at time of listing (Leu et al., 2019) and the proportion of budget received for ESA species recovery (Gerber, 2016). Proportion of budget received was based on the estimated cost needed for species recovery, as specified in a species recovery plan, compared to a species actual reported government expenditure provided for recovery between 1984 and 2014 (Gerber, 2016). Because Leu et al. (2019) showed that the number of threats at time of listing increased between 1975 and 2017, we controlled for year effects by regressing year to the number of threats for listed and recovered species combined, and then comparing residual values between currently listed and recovered species. We used the same approach for proportion of budget received. For both analyses, we used generalized linear mixed-effect models (lme4 package, Bates et al., 2015; glmmTMB package, Magnusson et al., 2020) with taxa included as a random effect (see Leu et al., 2019). We evaluated appropriate model structure (e.g., Poisson, negative binomial, or Gaussian) by evaluating qq-plots or histograms. We log-transformed response variables if necessary. We evaluated three model forms for year: linear, quadratic (y = β0 + β1 [Δ year] + β2 [Δ year 2]), and log-based pseudo-threshold (y = β0 + β1 loge [Δ year +1], Scherer et al., 2012). We used package DHARMa (Hartig, 2020) to assess whether a given mixed model structure was appropriate for our data. Based on the top model with lowest AICc value (Akaike Information Criterion adjusted for small sample sizes; Burnham and Anderson, 2002), we estimated number of threats and proportion of funding received by subtracting observed values from fitted line values (i.e., residuals). We determined no year effect if the null model (i.e., intercept model) had the lowest AICc value.
Due to highly unequal sample sizes between recovered and listed species, and because sample sizes also differed between data sets for each factor listed above, we randomly sub-sampled each listed-species data set, including the residual data set, in two ways. One random data set consisted of 1,000 random draws from currently listed species equal to the number of recovered species in a given listed species data set (all-listed species). The other random data set consisted of 1,000 random draws of currently listed species equal to the number of recovered species as represented by their taxa in a given listed species data set (stratified-listed species). This allowed us to investigate whether factors associated with recovered species apply to all listed species or only to those species in taxa represented in recovered species. We used a similar approach to evaluate the number of federal and international policies, as well as state and local policies protecting species once recovered. We subsampled the policy data of recovered vertebrates based on number of recovered plant species because recovery is biased toward vertebrates. Because the recovered species data sets represent the population sample rather than a random sample, we only employed descriptive statistics when comparing factors between groups. We completed all analyses in R version 4.0.2 (R Core Team, 2020). Unless otherwise stated, we report means (± SE). The datasets and R code for this study can be found on our Open Science Framework (OSF) website (OSF | Benchmark for the ESA: Having a Backbone is Good for Recovery. Data and R code.
Results
We collected data on 1,757 native species listed under the ESA through 2019. We excluded 20 species that were deemed not “a listable entity” by the USFWS due to errors in original data that were used to list the species, and we excluded 7 species because they were listed due to “similarity of appearance” to an already listed species, which would have inflated the sample size due to duplication. In total, our analyses included 1,730 species, of which 46 were recovered (see Supplementary Table 1 for list of recovered species). For sample sizes in each analysis, see Supplementary Table 2.
Over time, the number of recovered and listed species has increased, with the difference between listed and recovered species declining (Figure 1). The first four species delisted from the ESA in 1985 were all birds, which were listed as endangered in 1970. These included a species with a broad distribution, the brown pelican (Pelecanus occidentalis), and three island species from Palau: the Palau owl (Pyrroglaux podargina), Palau ground-dove (Gallicolumba canifrons), and Palau fantail flycatcher (Rhipidura lepida). On average 1.3 ± 0.3 (SE) species were delisted annually between 1985 and 2019. Most (65.2%) species were delisted since 2011.
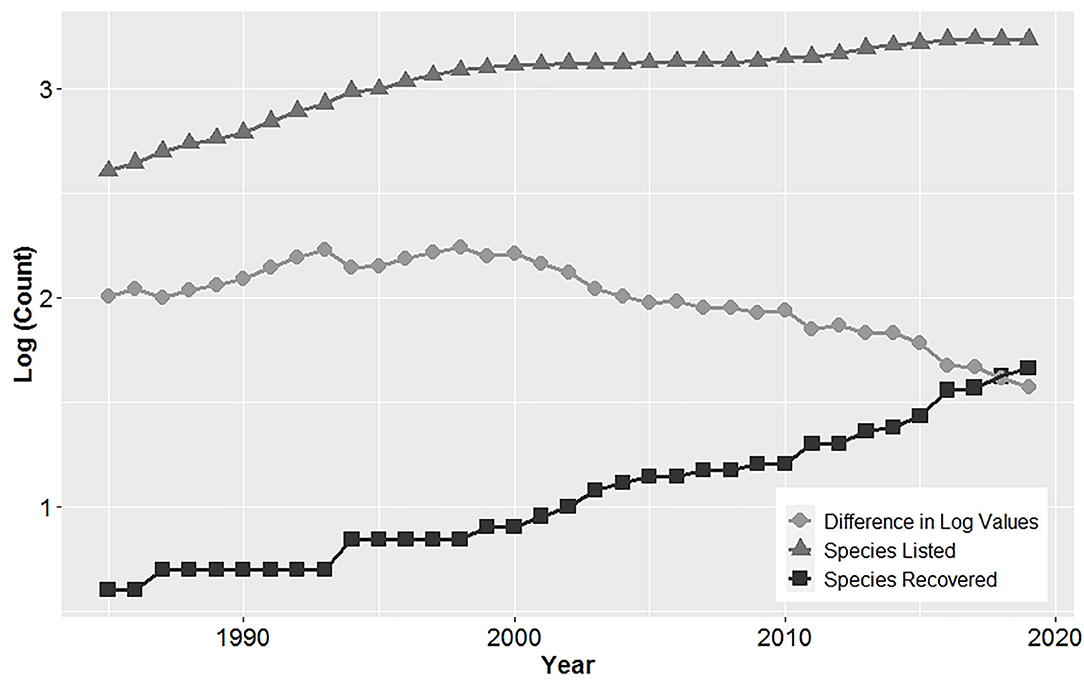
Figure 1. Cumulative log of the number of species listed and recovered under the United States Endangered Species Act showing a declining difference in these values over time, indicating an improvement in recovery.
Time listed and taxonomic composition differed between listed and recovered species. Recovered species were listed ~13 years longer (37.5 ± 1.8) compared to all-listed species (24.4 ± 0.06), and seven years longer compared to stratified-listed species (30.6 ± 0.06). Taxonomy composition for recovered species was biased high for mammals, birds and reptiles, and biased low for fish, flowering plants and snails compared to the taxonomic composition for all-listed species (Figure 2).
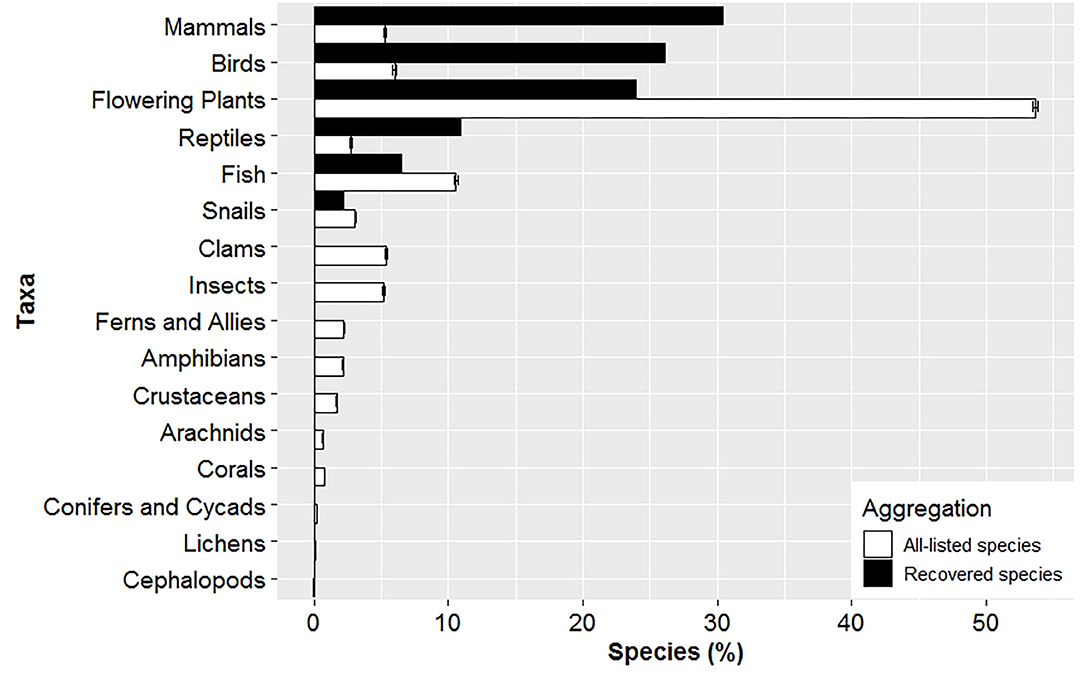
Figure 2. Taxonomic composition differs between recovered and listed species. Mean (± SE) composition of listed species in a given taxa was derived from 1,000 random data sets consisting of 46 species to match the total number of recovered species for comparison. No species are currently recovered for all taxa between clams and cephalopods.
On average, a recovered species required 2 ± 0.2 (SD) recovery actions, with the number of actions ranging from zero to six. The most frequent recovery action cited in delisting documents to recover species was direct population management (n = 18), followed by private landowner agreements (n = 17) and take regulations (n = 15; Table 1, Supplementary Table 3). Other recovery actions included biological control of other species (n = 13), habitat restoration efforts (n = 10), pollution regulation (n = 9), development management (n = 6), and off-road vehicle management (n = 5; Table 1, Supplementary Table 3). Five species did not require specific recovery actions (Palau ground-dove, Palau owl, Palau fantail flycatcher, Eastern North Pacific gray whale [Eschrichtius robustus] and Deseret milkvetch [Astragalus desereticus]). These species were recovered because of their increased demographics in combination with them already occurring on protected government land, or the species was protected by an already established policy (e.g., Marine Mammal Protection Act).
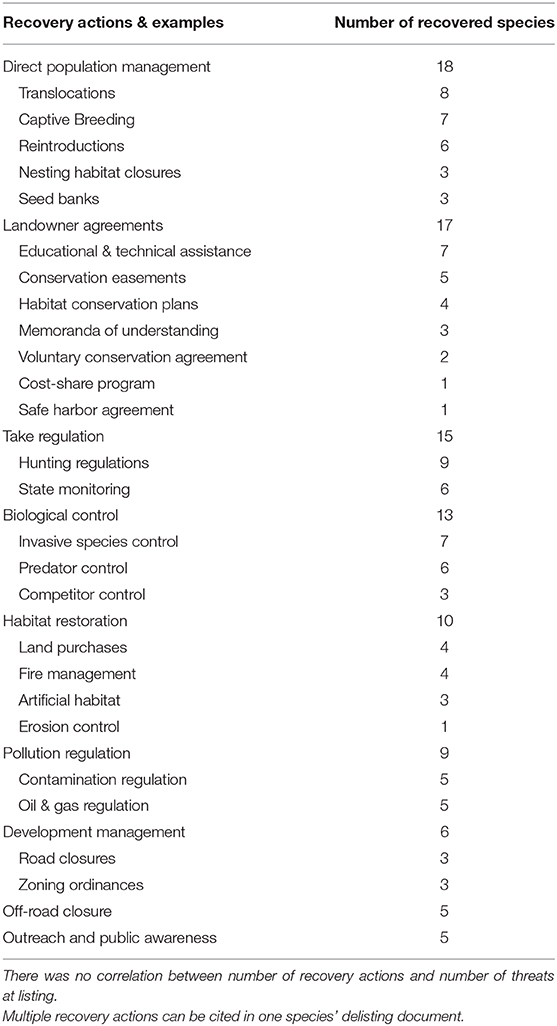
Table 1. Recovery actions cited in recovered species delisting documents.
The number of federal and international policies as well as state and local policies assuring protection post-delisting was higher for vertebrates than plants. On average, plant species had 0.9 ± 0.4 federal or international policies and 1.5 ± 0.3 state and local policies assuring protection post delisting compared to 3.9 ± 0.04 federal or international policies and 1.9 ± 0.02 state and local policies for vertebrates. A large number of federal and international policies (n = 60) mentioned in delisting documents provided assurances for species protection post delisting, with 40 of the 46 recovered species requiring these policies for recovery (Supplementary Table 1). Top international and federal US environmental regulatory policies cited in delisting documents for recovered species included the Clean Water Act (24%), Convention on International Trade of Endangered Species (CITES; 17%), Migratory Bird Treaty Act (17%), revoking the registration of DDT in 1972 (13%), and Federal Land Policy and Management Act (11% of species). In total, we found 77 state and local policies that provided recovery assurances (Supplementary Table 1), with a mean of 1.8 (SE = 0.4) of these policies per species. Of the recovered species, 37 had completed recovery plans, of which 73% (27) achieved all recovery criteria based on recovery plans, 27% (10) partially achieved recovery criteria (i.e., due to recovery criteria no longer being relevant or a single criteria was not met but the services decided that the species had recovered adequately), while nine recovered species did not have a completed recovery plan.
The percent of species listed for a given threat differed between currently listed and recovered species (Figure 3; for sample sizes see Supplementary Table 2). Recovered species were less likely to be impacted by five of the six threats – habitat modification, pollution, species-species interactions, environmental stochasticity, and demographic stochasticity – at time of listing. That is, a greater percentage of currently listed species were listed with one of these threats, regardless of whether averages were aggregated across all listed species or species stratified by recovered taxa. Overutilization was the only threat more likely to impact a recovered species at listing compared to averages aggregated between all-listed and stratified-listed species; however, this difference was minimal for the stratified-listed species (Figure 3). Last, our analyses showed that averages derived from stratified-listed species cannot be extrapolated to all listed species. Averages for all listed species were higher for pollution, species-species interactions, and demographic stochasticity, but lower for overutilization compared to stratified-listed species. Averages were similar only for habitat modification and environmental stochasticity between all-listed and stratified-listed species (Figure 3).
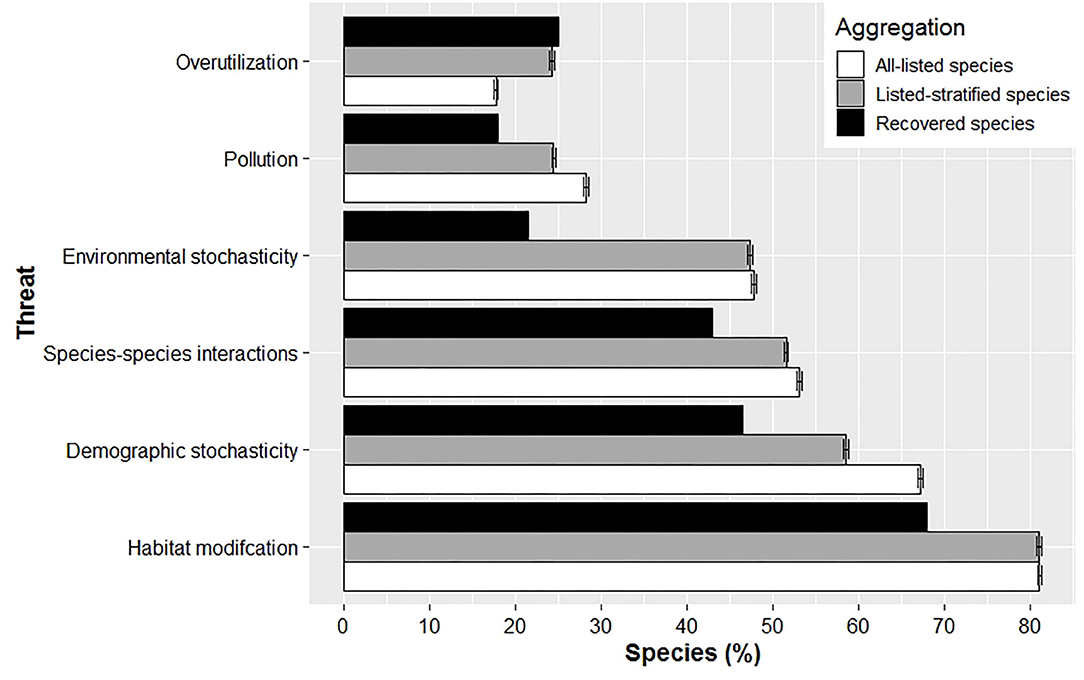
Figure 3. Mean (± SE) percent of species listed with a given threat at time of listing for recovered, all-listed and stratified-listed species. Overutilization was the only threat that affected proportionally more recovered species compared to listed species at time of listing.
Our analysis suggests that recovered species were listed with fewer threats at time of listing (Figure 4A; for sample sizes see Supplementary Table 2). Average number of threats adjusted for year (residual number of threats) was over 30-fold lower compared to the average of all-listed species and stratified-listed species. However, note the large variation associated with the residual number of threats for recovered species. For this analysis we excluded lichens (n = 2 species) and cephalopods (n = 1) due to small sample sizes, leaving 1,561 species, including the 28 recovered species for which threat data were available (Supplementary Table 2). Number of threats was best related to the squared term of year (Supplementary Table 4), but it also may relate to the log term of year, the second-best model (Supplementary Table 4). The average number of threats adjusted for year in the log form for all-listed and stratified-listed species estimated from the second-best model was very close to the ones estimated from the best model, thereby supporting findings from the best model.
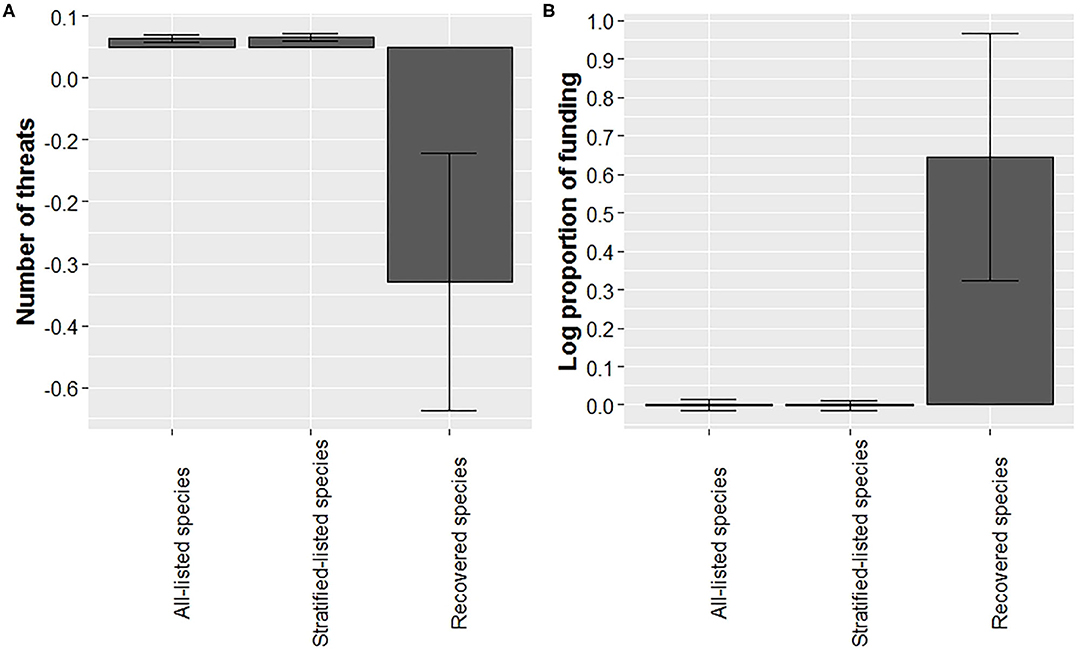
Figure 4. Recovered species experienced fewer threats at time of listing and a higher proportion of funding (adjusted by year) than listed species. Bars represented mean (with ± SE error bars) residuals for number of threats at listing (A) and average log proportion funding allocated (B) for all-listed, listed-stratified, and recovered species.
We found that the mean proportion of budget received for recovery actions (Gerber, 2016) was higher for recovered species than for listed species (Figure 4B, for sample sizes see Supplementary Table 2). Average residuals for recovered species were 60-fold higher compared to listed species, and the log of proportion of budget model related best to the squared term of year when budget was allocated (Supplementary Table 5). We found large variations in funding received for both listed and recovered species. For example, funding received for the Florida Scrub-Jay (Aphelocoma coerulescens) was 52 times higher than what the recovery plan proposed, whereas 51 listed species have not received any funding as of 2016. The high variation in recovered species funding was due to an outlier for the Louisiana black bear (Ursus americanus luteolus), which was allocated 10 times the amount of recovery funding than what was suggested in the recovery plan.
Discussion
Understanding what has worked in the past for the recovery of imperiled species offers important lessons on how to improve the effectiveness and efficiency of recovering still imperiled species. Compared to listed species, we found that the average recovered species was more likely to be a vertebrate, was exposed to a relatively lower number of threats at the time of listing, and received relatively more funding. Other characteristics of recovered species included having been listed for nearly three decades, having been recently recovered (i.e., during the last six-seven years), requiring approximately two recovery actions, and having numerous policies to help assure recovery post delisting.
As of January 2020, most taxa that have recovered were vertebrates (Figure 2). In contrast, 72% of species listed consisted of invertebrates and plants, but represented only 26% of recovered species. Vertebrate species are charismatic (Andelman and Fagan, 2000) and consequently there are established laws that specifically protect them (e.g., Migratory Bird Treaty Act and Marine Mammal Protection Act). Also, from 1967 until 1976, only vertebrates were listed under the ESA. It was not until 1976 and 1977 when the first invertebrates and plant species, respectively, were listed. Therefore, many vertebrates had nearly a decade head start in the recovery process. The longer a species has been listed under the ESA, the greater its improvement in population status and expansion of geographic range (Taylor et al., 2005; Evans et al., 2016; Valdivia et al., 2019). The ability of the ESA to recover species in large numbers is constrained by the ESA only having been implemented in the last several decades, while human activity in the US has negatively been impacting native species since the industrial age (Martin and Szuter, 1999). When species are eventually listed under the ESA, they suffer from complex and large-scale threats likely due to the prolonged listing process. In addition, many species do not obtain critical habitat designations and most only receive a fraction of the funding required for their recovery (Wilcove et al., 1993, 1998; Doremus and Pagel, 2001; Miller et al., 2002; Restani and Marzluff, 2002; Scott et al., 2005; Gerber, 2016). Hence, many species require long periods of time to reach recovery goals and become delisted (Wilcove et al., 1993; Gerber and Hatch, 2002; Neel et al., 2012; Evans et al., 2016; Valdivia et al., 2019).
The proportion of recovery funding allocated to the Services was higher for recovered species compared to listed species (Figure 4B), which is consistent with the findings of Male and Bean (2005). This may be the result of the majority of recovered taxa being vertebrates. Restani and Marzluff (2002) found that mammals and birds listed under the ESA were allocated more money for recovery and the amount of funding that goes toward a species' recovery was unrelated to its assigned priority for recovery. Since 1976, federal funding for the endangered species program of the USFWS (in constant, inflation-adjusted dollars) has increased greatly, but the total number of listed species has grown faster such that per-species funding has declined (Evans et al., 2016). Yet, our results indicate that a certain level of funding – certainly higher than the average funding per species – is necessary to achieve recovery. With growing threats such as species-species interactions and climate change (Evans et al., 2016; Leu et al., 2019), even more funding may be required to improve recovery efforts in the future.
We found a higher diversity of threats impacted currently listed species at their time of listing, apart from overutilization (Figure 3). The reduction in overutilization may be associated with how the US has developed a governance that establishes sustainable harvest regimes for terrestrial and freshwater animals, regulates inter-state trade of biodiversity (e.g., Game and Wild Birds Preservation and Disposition Act of 1900; Lacey Act of 1900), and provides enforcement and public education for hunting regulations and protection of natural resources (Decker et al., 2015). Abbitt and Scott (2001) also found that recovered and recovering species suffered from easy-to-manage threats that can be dealt with more directly like overexploitation/collecting, while declining species were affected by dams/drainage/diversions, non-indigenous predators and development; threats more difficult to manage against.
Several environmental regulations outside of the ESA, such as the Migratory Bird Treaty Act, National Environmental Policy Act, and Clean Water Act, provide species protection as well as assurances for species recovery. However, recent changes to several of these laws potentially means that they may no longer be able to protect migratory birds from incidental take ([USFWS] US Fish Wildlife Service, 2020b), may shortcut critical environmental reviews (Council on Environmental Quality, 2020), or may no longer provide protections to ephemeral streams and wetlands not directly connected or adjacent to large bodies of water (Department of the Army, 2020). Such changes to environmental policy reduce the suite of tools available to recover and assure the long-term conservation of federally listed species. Further, the reliance on these now weakened regulatory tools in delisting decisions for many species may call into question whether assurances for recovery have truly been achieved and whether ESA protections may again be required.
We found that the most cited recovery actions in delisting documents that aided species recovery included direct population management and working with private landowners (Table 1). Successful population management recovery actions have included the translocation and reintroduction of individuals into species' historical ranges to restore extirpated populations, and the captive breeding or establishment of seed banks to restore or supplement wild populations (Table 1, Supplementary Table 3). For example, the substantial increase in the numbers of Aleutian Canada Geese (Branta canadensis leucopareia) that lead to their recovery was dependent on reestablishing this species to their former nesting islands. This was initially done through release of captive-bred birds on predator free islands with very little success. Greater success occurred from translocation of wild birds to these same islands, which resulted in reestablishment of multiple breeding colonies.
Incentive programs provided by the ESA (e.g., in section 10) and its implementing regulations, such as safe harbor agreements, habitat conservation plans, and conservation banks, have helped advance the recovery of several species (Table 1, Supplementary Table 3). This result is important because more than two-thirds of all listed species occur in part on private lands, and a third only on private lands (Evans et al., 2016). At the same time, much of current property rights regimes support private landowners to develop and access lands for commercial and private interests as opposed to maintaining or improving ecological processes, including habitat for imperiled species (Rissman and Sayre, 2012; Henson et al., 2018; Moon et al., 2020). The ESA extends habitat protections to private lands in limited circumstances: when federal actions are involved (in section 7 prohibiting agencies from carrying out, funding, or permitting activities that destroy or adversely modify designated critical habitat) or if habitat destruction were to demonstrably result in take (i.e., harm, harass, kill, etc.) of individuals of a listed species (section 9). The section 7 consultation process and the section 10 agreements noted above offer landowners permits to minimize the effects of these regulations, but additional recovery-focused incentives are likely needed. For example, the overall effectiveness of current incentive programs remains uncertain, with many considered time-consuming and too complex for private landowners (Evans et al., 2016). Other landowner agreements such as Memoranda of Understanding and voluntary Recovery Management Agreements (Scott et al., 2005) have been successful in species recovery, especially for species that require active management to maintain their population numbers (i.e., conservation reliant, Scott et al., 2010). For example, the rebound and recovery of the Kirtland's Warbler (Setophaga kirtlandii, [[USFWS] US Fish Wildlife Service, 2020a) was made possible through development of a Memoranda of Understanding with governmental and private partners that put this species on the path to recovery (Frey, 2018). Expanding incentive programs such as Memoranda of Understanding and Recovery Management Agreements for private landowners to help advance the recovery of ESA-listed species will require programs that are innovative, integrate social sciences, tailored to the needs and values of the participating landowner, and increase the return-on-investment for the participant (Sorice and Donlan, 2015; Epanchin-Niell and Boyd, 2020).
With difficulties in working with private landowners and the ESA, it is no surprise that nearly two-thirds of recovered species (30 of 46) occurred predominately on protected areas (e.g., state parks, federal property, non-governmental organization property). Research suggests that protected areas benefit biodiversity by having reduced habitat loss that maintains species populations and providing more opportunities for implementation of recovery actions (Bruner et al., 2001; Hatch et al., 2002; Gray et al., 2016; Eichenwald et al., 2020). Several studies have found that listed species suffer less habitat loss and are more likely to be improving on public lands (Abbitt and Scott, 2001; Hatch et al., 2002; Evans et al., 2016; Eichenwald et al., 2020). Based on our review of delisting documents for recovered species, protected areas provide more opportunities for focused recovery efforts and implementation of recovery actions as outlined in Table 1 (Hatch et al., 2002). For example, the biological control of invasive species on public lands has been important in the recovery of the Black-capped Vireo [Vireo atricapilla], Aleutian Canada Goose [Branta hutchinsii leucopareia], Tinian Monarch [Monarcha takatsukasae], Eggert's sunflower [Helianthus eggertii], Island night lizard [Xantusia riversiana] and others ([USFWS] US Fish Wildlife Service, 2018).
Conclusion
When reviewing the pattern of species recovery under the ESA, recovered species were more likely to be vertebrates, protected under the ESA for a longer period of time, affected by a lower number and diversity of threats, received protections from other policies outside the ESA, occurred more on protected lands, and received a higher proportion of recovery funding. Based on these observed patterns, recovery for species still listed, especially plants and invertebrates, could improve if they receive more recovery funding and are protected sooner under the ESA before suffering from a greater number and diversity of threats.
One purpose in developing an IUCN “green list” is to develop an optimistic vision of species conservation and provide learned lessons from species conservation success stories to provide a road map on how to achieve species recovery. Based on our observed patterns of species recovery under the ESA, we suggest five strategies to improve species recovery:
(1) Time: Allow species ample time to recover and list them sooner, recognizing that biological and ecological processes are time-limited, and acknowledge that it is incorrect to conclude the ESA is a failure based on duration of listings without accounting for the time requirements.
(2) Funding: Increase federal, state, and private sector financial support for effective recovery actions (e.g., direct population management, control of problem species and habitat restoration; Malcom et al., 2019) and prioritize funding within a resource allocation framework as part of a decision support tool (Gerber et al., 2018).
(3) Regulations: Reestablish, maintain and develop environmental governmental policies that support species recovery efforts (e.g., regulations on take, pollution, energy development and off-road vehicle activity) and provide assurances that recovered species maintain their recovered status post-recovery (e.g., Clean Water Act, Migratory Bird Treaty Act).
(4) Agreements: Increase federal and state governmental support to establish innovative and tailored private landowner incentive programs, including agency agreements such as Memoranda of Understanding and Recovery Management Agreements to protect habitat and implement recovery actions.
(5) Land protection: In collaboration with local communities, enhance the amount of protected space for listed species that provide habitat space and the flexibility to implement effective recovery actions.
The implementation of these recommendations in an adaptive management approach would help identify which strategies work best in specific situations (Canessa et al., 2016; Evans et al., 2016; Gosnell et al., 2017; Evansen et al., 2020). By monitoring these implemented recommendations over time, we expect to identify which actions are improving our ability to recover species and restore their ecosystem function and which are not. We note that the data are not available to determine which actions are not effective at recovery at this time, but that such information is needed for effective adaptive management and efficient resource allocation (Evansen et al., 2020). We also recommend future benchmarks of recovery be conducted to determine conservation strategies and policies that continue to work, or what new approaches to recovery are having success.
Data Availability Statement
The datasets generated for this study can be found in https://osf.io/cxehu/.
Author Contributions
AH contributed writing, data analysis, and overall construction of this manuscript. ML contributed writing, data analysis, and figure development. DC contributed writing and data collection. TT and CP contributed data collection. JMi and JMa contributed writing and policy review. All authors contributed to the article and approved the submitted version.
Conflict of Interest
The authors declare that the research was conducted in the absence of any commercial or financial relationships that could be construed as a potential conflict of interest.
Acknowledgments
We thank Olivia Rosensteel, Michella Salvitti, Grace Smoot, Emily Ritter, Callum Goulding, and Molly Ryan for their contribution to data collection. We thank Lauren McCain and members of the Center for Conservation Innovation for feedback that improved this manuscript. We thank William & Mary and Millersville University for financial support of undergraduate research.
Supplementary Material
The Supplementary Material for this article can be found online at: https://www.frontiersin.org/articles/10.3389/fcosc.2021.630490/full#supplementary-material
References
Abbitt, R. J. F., and Scott, J. M. (2001). Examining differences between recovered and declining endangered species. Conserv. Biol. 15, 1274–1284. doi: 10.1046/j.1523-1739.2001.00430.x
Akçakaya, H. R., Bennett, E. L., Brooks, T. M., Grace, M. K., Heath, A., Hedges, S., et al. (2018). Quantifying species recovery and conservation success to develop an IUCN green list of species. Conserv. Biol. 32, 1128–1138. doi: 10.1111/cobi.13112
Andelman, S. J., and Fagan, W. F. (2000). Umbrellas and flagships: efficient conservation surrogates or expensive mistakes? Proc. Natl. Acad. Sci. U.S.A. 97, 5954–5959. doi: 10.1073/pnas.100126797
Bates, D., Machler, M., Bolker, B., and Walker, S. (2015). Fitting linear mixed-effects models using lme4. J. Statist. Softw. 67, 1–48. doi: 10.18637/jss.v067.i01
Bruner, A. G., Gullison, R. E., Rice, R. E., and Da Fonseca, G. A. B. (2001). Effectiveness of parks in protecting tropical biodiversity. Science 291,125–128. doi: 10.1126/science.291.5501.125
Burnham, K. P., and Anderson, D. R. (2002). Model Selection and Multimodel Inference: A Practical Information-Theoretic Approach. 2nd ed. New York, NY: Springer.
Canessa, S., Guillera-Arroita, G., Lahoz-Monfort, J. J., Southwell, D. M., Armstrong, D. P., Chadès, I., et al. (2016). Adaptive management for improving species conservation across the captive-wild spectrum. Biol. Conserv. 199, 123–131. doi: 10.1016/j.biocon.2016.04.026
Ceballos, G., Ehrlich, P. R., Barnosky, A. D., García, A., Pringle, R. M., and Palmer, T. M. (2015). Accelerated modern human–induced species losses: entering the sixth mass extinction. Sci. Adv. 1:e1400253. doi: 10.1126/sciadv.1400253
Council on Environmental Quality (2020). 40 CFR Parts 1500, 1501, 1502, 1503, 1504, 1505, 1506, 1507, 1508, 1515, 1516, 1517, and 1518: Update to the Regulations Implementing the Procedural Provisions of the National Environmental Policy Act. Available online at: https://www.govinfo.gov/content/pkg/FR-2020-07-16/pdf/2020-15179.pdf (accessed November 5, 2020).
De Vos, J. M., Joppa, L. N., Gittleman, J. L., Stephens, P. R., and Pimm, S. L. (2015). Estimating the normal background rate of species extinction. Conserv. Biol. 29, 452–462. doi: 10.1111/cobi.12380
Decker, D. J., Stedman, R. C., Larson, L. R., and Siemer, W. F. (2015). Hunting for wildlife management in America. Wildlife Profess. 9, 26–29.
Department of the Army Corps of Engineers Department of Defense; Environmental Protection Agency. (2020). The Navigable Waters Protection Rule: Definition of “Waters of the United States.” Available online at: https://www.govinfo.gov/content/pkg/FR-2020-04-21/pdf/2020-02500.pdf (accessed November 5, 2020).
Díaz, S., Settele, J., Brondízio, E., Ngo, H., Guèze, M., Agard, J., et al. (2019). Summary for Policymakers of the global Assessment Report on Biodiversity and Ecosystem Services of the Intergovernmental Science-Policy Platform on Biodiversity and Ecosystem Services. Bonn: IPBES.
Doremus, H., and Pagel, J. E. (2001). Why listing may be forever: perspectives on delisting under the US endangered species act. Conserv. Biol. 15, 1258–1268. doi: 10.1046/j.1523-1739.2001.00178.x
Eichenwald, A. J., Evans, M. J., and Malcom, J. W. (2020). US imperiled species are most vulnerable to habitat loss on private lands. Front. Ecol. Environ. 18, 439–445. doi: 10.1002/fee.2177
Epanchin-Niell, R., and Boyd, J. (2020). Private-sector conservation under the US Endangered Species Act: A return-on-investment perspective. Front. Ecol. Environ. 18, 409–416. doi: 10.1002/fee.2193
Evans, D. M., Che-Castaldo, J. P., Crouse, D., Davis, F. W., Epanchin-Niell, R., Flather, C. H., et al. (2016). Species recovery in the United States: increasing the effectiveness of the endangered species act. Issues Ecol. 20, 1–28. Available online at: https://www.esa.org/esa/wp-content/uploads/2016/01/Issue20.pdf
Evansen, M., Malcom, J., and Carter, A. (2020). A Monitoring Policy Framework for the United States Endangered Species Act. Available online at: Open Science Framework Preprints, https://osf.io/gmr4u (accessed May 15, 2020).
Foin, T. C., Pawley, A. L., Ayres, D. R., Carlsen, T. M., Hodum, P. J., and Switzer, P. V. (1998). Improving recovery planning for threatened and endangered species. BioScience 48, 177–184. doi: 10.2307/1313263
Foley, C. M., Lynch, M. A., Thorne, L. H., and Lynch, H. J. (2017). Listing foreign species under the endangered species act: a primer for conservation biologists. BioScience 67, 627–637. doi: 10.1093/biosci/bix027
Gerber, L. R. (2016). Conservation triage or injurious neglect in endangered species recovery. Proc. Natl. Acad. Sci. U.S.A. 113, 3563–3566. doi: 10.1073/pnas.1525085113
Gerber, L. R., and Hatch, L. T. (2002). Are we recovering? An evaluation of recovery criteria under the US endangered species act. Ecol. Appl. 12, 668–673. doi: 10.1890/1051-0761(2002)012(0668:AWRAEO)2.0.CO
Gerber, L. R., Runge, M. C., Maloney, R. F., Iacona, G. D., Drew, C. A., Avery-Gomm, S., et al. (2018). Endangered species recovery: a resource allocation problem. Science 362, 284–286. doi: 10.1126/science.aat8434
Gibbs, K. E., and Currie, D. J. (2012). Protecting endangered species: DO the main legislative tools work? PLoS ONE 7:e35730. doi: 10.1371/journal.pone.0035730
Ginsburg, D. (2012). Friends of Blackwater vs. Salazar. Court of Appeals, District of Columbia Circuit. Available online at: https://perma.cc/N6XN-LELZ (accessed January 04, 2021).
Gosnell, H., Chaffin, B., Ruhl, J. B., Arnold, C. A., Craig, R., Benson, M., et al. (2017). Transforming (perceived) rigidity in environmental law through adaptive governance: a case of endangered species act implementation. Ecol. Soc. 22:42. doi: 10.5751/ES-09887-220442
Gray, C. L., Hill, S. L. L., Newbold, T., Hudson, L. N., Börger, L., Contu, S., et al. (2016). Local biodiversity is higher inside than outside terrestrial protected areas worldwide. Nat. Commun 7:e12306. doi: 10.1038/ncomms12306
Hartig, F. (2020). DHARMa: Residual Diagnostics for hiErarchical (Multi-Level/Mixed) Regression models. Available online at: https://cran.r-project.org/web/packages/DHARMa/index.html (accessed October 15 2020).
Hatch, L., Uriarte, M., Fink, D., Aldrich-Wolfe, L., Allen, R. G., Webb, C., et al. (2002). Jurisdiction over endangered species' habitat: the impacts of people and property on recovery planning. Ecol. Appl. 12:690–700. doi: 10.1890/1051-0761(2002)012(0690:JOESHT)2.0.CO
Henson, P., White, R., and Thompson, S. P. (2018). Improving implementation of the endangered species act: finding common ground through common sense. BioScience 68, 861–872. doi: 10.1093/biosci/biy131
[IUCN] International Union for the Conservation of Nature. (2020). The IUCN Green Status of Species. IUCN. Available online at: www.iucn.org/species/about/species-survival-commission/ssc-leadership-and-steering-committee/iucn-red-list-committee/iucn-green-list-species (accessed November 5, 2020).
Leu, M., Haines, A. M., Check, C. E., Costante, D. M., Evans, J. C., Hollingsworth, M. A., et al. (2019). Temporal analysis of threats causing species endangerment in the United States. Conserv. Sci. Pract. 1:e78. doi: 10.1111/csp2.78
Li, Y., Malcom, J., Che-Castoldo, J. P., and Neel, M. C. (2020). Recovery Plans Need Better Science to Support Decisions That Allow Species to Decline in Abundance But Be Recovered. Available online at: bioRxiv doi: 10.1101/2020.02.27.966101 (accessed February 15, 2020).
Luther, D., Skelton, J., Fernandez, C., and Walters, J. (2016). Conservation action implementation, funding, and population trends of birds listed on the endangered species act. Biol. Conserv. 197, 229–234. doi: 10.1016/j.biocon.2016.03.019
Magnusson, H., Skaug, A., Berg, N. C., Kristensen, K., Maechler, M., Bentham, K., et al (2020). Package ‘glmmTMB’. Available online at: https://cran.r-project.org/web/packages/glmmTMB/glmmTMB.pdf. (accessed September 29, 2020).
Malcom, J., Schwartz, M. W., Evansen, M., Ripple, W. J., Polasky, S., Gerber, L. R., et al. (2019). Solve the biodiversity crisis with funding. Science 365, 1256–1256. doi: 10.1126/science.aay9839
Malcom, J. W., and Li, Y. W. (2015). Data contradict common perceptions about a controversial provision of the US endangered species act. Proc. Natl. Acad. Sci. U.S.A.112, 15844–15849. doi: 10.1073/pnas.1516938112
Male, T. D., and Bean, M. J. (2005). Measuring progress in US endangered species conservation. Ecol. Lett. 8, 986–992. doi: 10.1111/J.1461-0248.2005.00806.X
Martin, P. S., and Szuter, C. R. (1999). War zones and game sinks in Lewis and Clark's west. Conserv. Biol. 13, 36–45. doi: 10.1046/j.1523-1739.1999.97417.x
Miller, J. K., Scott, J. M., Miller, C. R., and Waits, L. P. (2002). The endangered species act: dollars and sense. BioScience 52, 163–168. doi: 10.1641/0006-3568(2002)052(0163:TESADA)2.0.CO
Moon, K., Marsh, D., and Cvitanovic, C. (2020). Coupling property rights with responsibilities to improve conservation outcomes across land and seascapes. Conserv. Lett. e12767. doi: 10.1111/conl.12767
Neel, M. C., Leidner, A. K., Haines, A., Goble, D. D., and Scott, J. M. (2012). By the numbers: how is recovery defined by the US endangered species act? BioScience 62, 646–657. doi: 10.1525/bio.2012.62.7.7
Pimm, S. L., Jenkins, C. N., Abell, R., Brooks, T. M., Gittleman, J. L., Joppa, L. N., et al. (2014). The biodiversity of species and their rates of extinction, distribution, and protection. Science 344, 987–987. doi: 10.1126/science.1246752
R Core Team (2020). R: A Language and Environment for Statistical Computing. R Foundation for Statistical Computing. www.R-project.org.
Restani, M., and Marzluff, J. M. (2002). Funding extinction? Biological needs and political realities in the allocation of resources to endangered species recovery. BioScience 52, 169–177. doi: 10.1641/0006-3568(2002)052(0169:FEBNAP)2.0.CO
Rissman, A. R., and Sayre, N. F. (2012). Conservation outcomes and social relations: a comparative study of private ranchland conservation easements. Soc. Nat. Resour. 25, 523–538. doi: 10.1080/08941920.2011.580419
Scherer, R. D., Muths, E., and Noon, B. R. (2012). The importance of local and landscape-scale processes to the occupancy of wetlands by pond-breeding amphibians. Popul. Ecol. 54, 487–498. doi: 10.1007/s10144-012-0324-7
Scott, J. M., Goble, D. D., Haines, A. M., Wiens, J. A., and Neel, M. C. (2010). Conservation-reliant species and the future of conservation. Conserv. Lett. 3, 91–97. doi: 10.1111/j.1755-263X.2010.00096.x
Scott, J. M., Goble, D. D., Wiens, J. A., Wilcove, D. S., Bean, M., and Male, T. (2005). Recovery of imperiled species under the endangered species act: the need for a new approach. Front. Ecol. Environ. 3, 383–389. doi: 10.1890/1540-9295(2005)003(0383:ROISUT)2.0.CO
Sorice, M. G., and Donlan, C. J. (2015). A human-centered framework for innovation in conservation incentive programs. Ambio 44, 788–792. doi: 10.1007/s13280-015-0650-z
Taylor, M. F. J., Suckling, K. F., and Rachlinski, J. J. (2005). The effectiveness of the endangered species act: a quantitative analysis. BioScience 55, 360–367. doi: 10.1641/0006-3568(2005)055(0360:TEOTES)2.0.CO
[USFWS] US Fish Wildlife Service (2018). 50 CFR Part 17: Endangered and Threatened Wildlife and Plants; Removing the Kirtland's Warbler From the Federal List of Endangered and Threatened Wildlife. Available online at: https://www.govinfo.gov/content/pkg/FR-2019-10-09/pdf/2019-22096.pdf (accessed November 5, 2020).
[USFWS] US Fish Wildlife Service (2020a). Environmental Conservation Online System. USFWS. Available online at: https://ecos.fws.gov/ecp/ (accessed November 5, 2020).
[USFWS] US Fish Wildlife Service (2020b). 50 CFR Part 10: Regulations Governing Take of Migratory Birds. Available online at: https://www.govinfo.gov/content/pkg/FR-2020-02-03/pdf/2020-01771.pdf (accessed November 5, 2020).
Valdivia, A., Wolf, S., and Suckling, K. (2019). Marine mammals and sea turtles listed under the US endangered species act are recovering. PLoS ONE 14:e0210164. doi: 10.1371/journal.pone.0210164
Wilcove, D. S., McMillan, M., and Winston, K. C. (1993). What exactly is an endangered species? An analysis of the US endangered species list: 1985-1991. Conserv. Biol. 7, 87–93. doi: 10.1046/j.1523-1739.1993.07010087.x
Keywords: ESA, delisting, recovered, endangered, policy
Citation: Haines AM, Leu M, Costante DM, Treakle TC, Parenti C, Miller JRB and Malcom JW (2021) Benchmark for the ESA: Having a Backbone Is Good for Recovery. Front. Conserv. Sci. 2:630490. doi: 10.3389/fcosc.2021.630490
Received: 17 November 2020; Accepted: 14 January 2021;
Published: 28 January 2021.
Edited by:
Camilla Sandström, Umeå University, SwedenReviewed by:
Matthew Grainger, Norwegian Institute for Nature Research (NINA), NorwayAlison L. Greggor, San Diego Zoo Institute for Conservation Research, United States
Copyright © 2021 Haines, Leu, Costante, Treakle, Parenti, Miller and Malcom. This is an open-access article distributed under the terms of the Creative Commons Attribution License (CC BY). The use, distribution or reproduction in other forums is permitted, provided the original author(s) and the copyright owner(s) are credited and that the original publication in this journal is cited, in accordance with accepted academic practice. No use, distribution or reproduction is permitted which does not comply with these terms.
*Correspondence: Aaron M. Haines, aaron.haines@millersville.edu