

Abstract
Climate change is expected to increase fire activity in many regions of the globe, but the relative role of human vs. lightning-caused ignitions on future fire regimes is unclear. We developed statistical models that account for the spatiotemporal ignition patterns by cause in the eastern slopes of the Cascades in Oregon, USA. Projected changes in energy release component from a suite of climate models were used with our model to quantify changes in frequency and extent of human and lightning-caused fires and record-breaking events based on sizes of individual fires between contemporary (2006 −2015) and mid-century conditions (2031–2060). No significant change was projected for the number of human-caused fire ignitions, but we projected a 14% reduction in lightning-caused ignitions under future conditions. Mean fire sizes were 31% and 22% larger under future conditions (2031–2060) for human and lightning-caused ignitions, respectively. All but one climate model projected increased frequency of record-breaking events relative to the contemporary period, with the largest future fires being about twice the size of those of the contemporary period. This work contributes to understanding the role of lightning- and human-caused fires on future fire regimes and can help inform successful adaptation strategies in this landscape.
Export citation and abstract BibTeX RIS
1. Introduction
In the U.S., two-thirds of the area burned by wildfires is due to lightning-caused fires, but human-caused fires contribute to extended fire seasons and expanded fire niches to areas where fire would not naturally occur (Balch et al 2017). In addition, human-caused fires are the main source of large fires in the eastern and western U.S. (Nagy et al 2018). Understanding how fire regimes - including lightning-caused and human-caused fires - will unfold under climate change is critical to informing future adaptation strategies (Locatelli et al 2011). Extreme wildfire events (EWE) both in terms of size and socio-economic impacts across the globe have been shown to predominantly coincide with very high levels of fire danger, heightened by human pressures (Bendix and Hartnett 2018, Kirchmeier-Young et al 2019). While climate is the primary driver of macroscale area burned, the human footprint is a close second; however, the direction and magnitude of this effect is nonlinear (Syphard et al 2007) and varies by socio-ecological context (Mansuy et al 2019). Previous work has quantified the anthropogenic influence on fire regimes at continental (Balch et al 2017, Abatzoglou et al 2018, Nagy et al 2018) and regional scales (Syphard et al 2007, Fusco et al 2016) and highlighted strong spatial variability in the relationship between land-use and anthropogenic fire ignitions. Less known is how human- and lightning-caused wildfires will change individually as a function of future climate at local scales where adaptation and fire management programs typically operate.
There is a growing body of literature, exploring how climate change will affect wildfire frequency, severity, and extent. Recent extreme fire seasons in California, Portugal, and Australia have led to thousands of structure losses and hundreds of deaths, highlighting the need to understand how climate change may exacerbate these extremes. As of 2020, eight of the ten largest wildfires in California's management record have all occurred in the last seven years, and the occurrence of EWEs has raised concerns that a warmer future will bring more frequent and extensive record-breaking fires (Bowman et al 2017). In a study of the western US, Stavros et al (2014a) projected that by mid-century relative to contemporary climate, the likelihood of a week with very large fires (>20 234 ha) would increase by 270% in flammability-limited forest areas of the Pacific Northwest and by 130% in the fuel-limited systems of the western Great Basin. In 2020, several very large fires burned through moist forests on the western side of the Cascade Range in Oregon, without any analogue in contemporary history. These events sparked a public, oversimplified, dichotomous debate between management vs. warming climate as the main driver for these events, emphasizing the need to disentangle climate effects on extreme fire events (Abatzoglou 2021.
A future where extreme wildfires of today are the norm, rather than outlier events, will likely have significant impacts in coupled human-natural systems. Understanding what adaptation and mitigation strategies are available will vary with local context, including vegetation types, fire regimes, and values at risk. Human and natural fire regimes can have significant spatiotemporal variability, and the associated suite of policy and management tools is inextricably linked to cause. For example, managing wildfire for resource objectives (Huffman et al 2020) is limited to natural ignitions occurring in locations and under weather conditions that managers deem safe (NWCG 2009). Where human-caused ignitions are associated with the majority of problem fires (Mietkiewicz et al 2020), educational programs to raise awareness and/or enforcement of closures and restrictions on public lands can help reduce unwanted ignitions. Understanding whether future climate will affect human- and lightning caused fire patterns differently can help craft effective communication, adaptation, and mitigation programs (Bendix and Hartnett 2018).
In this study, we model projected fire activity through mid-century with explicit attention to cause, to determine how future climate will impact burning windows and fire size. We hypothesized that due to different spatiotemporal patterns of human- and lightning-caused ignitions, changes in energy release component (ERC), a fire danger index used by fire managers to assess large fire potential, will impact human and natural fire regimes differently. We developed spatiotemporal statistical models of fire occurrence and fire size for lightning and human ignitions based on empirical data and apply our models forced by 18 global climate models (GCMs) to estimate the frequency of EWEs, number of fires, and fire size. We evaluated these scenarios across a 3.3 million ha landscape in central Oregon, USA.
2. Methods
2.1. Study area
The study area covered 3.3 million ha along the eastern slope of the Cascade Mountains in central Oregon, USA (figure 1), and was the focus of several studies integrated in the 'Forests–People–Fire' project (Spies et al 2018) centred around the social-ecological system of a fire-prone forest landscape. The study area extends along a west-to-east moisture gradient that supports diverse vegetation types ranging from alpine forest to semi-arid juniper woodlands desert in an intermix of public, private and tribal land. The west side of the study area is dominated by moist forest managed as designated wilderness areas where mechanical treatments are limited and wildfires are rare but typically high-severity. Moving east, vegetation types transition from dry mixed forest to semi-arid juniper woodlands along the eastern boundary of the study area (Spies et al 2017). Overall, forested lands ranging from subalpine white fir to dry ponderosa pine cover 70% of the study area, and semi-arid juniper woodlands account for 20% of the study area. Federal forest lands managed by the U.S. Forest Service dominate the study area (48%) and include the Deschutes and the Fremont-Winema National Forests. The northern end of the study area includes the Confederated Tribes of the Warm Springs. Private industrial (12%), state forest (1%) and small forest ownerships (8%) occur on the drier portions of the study area and the wildland urban interface (12%) is concentrated around cities and major transportation corridors (Kline et al 2017). The study area has experienced an increase in population in response to the amenities associated with the region, e.g. environmental quality, recreation opportunities and access to public lands (Olsen et al 2017).

Figure 1. Study area located in central Oregon (inset), land cover type, major roads, and communities. Figure modified from Ager et al (2018). Reprinted from Ager et al, Copyright 2018, with permission from Elsevier.
Download figure:
Standard image High-resolution image2.2. Data Collection
2.2.1. Fire occurrence data
We obtained historical ignition data for 1992–2015 (figure 2) for the entire study area from the spatial wildfire database of the U.S. (Short 2017). There were 15 006 recorded ignitions (figure 2(A)) in the study area, but only 400 generated fires larger than 10 ha (figure 2(B)). Fires >10 ha represented 2.6% of all ignitions and 99% of the total burned area. Each fire record was associated with the x, y coordinate for ignition location, cause, ignition date and final fire size.
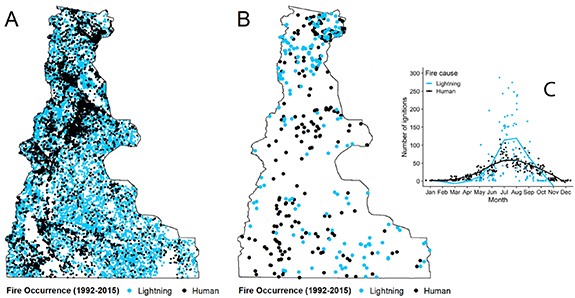
Figure 2. Location of historical ignitions (1992–2015): (A) originating a fire of any size and (B) originating a fire >10 ha. The inset panel (C) shows the total number of ignitions (originating a fire of any size) per month and cause.
Download figure:
Standard image High-resolution imageThe maximum area burned in a year was 63 000 ha (1996), and there were eight years with >20 000 ha burned. The largest single fire was 47 846 ha (Simnasho fire, 1996) followed by 37 626 (Barry Point fire, 2012) and 32 267 (B&B Complex fire, 2003). Lightning-caused ignitions correspond to 43% of the fires >10 ha, and 55% of the area burned, whereas human-caused ignitions leading to fires >10 ha were frequent (57%) but associated with a smaller share of total area burned (45%).
Temporal and spatial ignition patterns were distinct for human- and lightning-caused ignitions. Human ignitions were concentrated near populated areas and roads, whereas lightning-caused ignitions were distributed evenly across the study area (figure 2(A)). In terms of seasonality, lightning ignitions peak in mid-summer, whereas human ignitions tend to occur more broadly and extend towards spring and fall (figure 2(C)).
2.2.2. Land cover data
Land cover type data were based on potential vegetation type groups representing species assemblages, site productivity, and disturbance regimes (Burscu et al 2014, Halofsky et al 2014) (figure 1). The land cover type was assigned to each historical ignition in the database (supplementary material table S1 (available online at stacks.iop.org/ERL/16/064081/mmedia); figures 1 and 2).
2.2.3. Historical ERC data
We used spatially explicit daily gridded ERC data from the gridMET dataset (Abatzoglou 2013) to develop wildfire-weather relationships for 1992–2015. This approach differs from previous work (Ager et al 2018) that used a single ERC stream averaged from 25 remote automated weather stations. ERC is a hybrid weather-climate buildup fire danger index that uses daily temperature, relative humidity, precipitation, and other meteorological variables to provide a measure of potential fireline intensity. Several studies have shown the empirical value of ERC on daily-to-interannual timescales in tracking fire activity characteristics (Abatzoglou and Kolden 2013, Riley et al 2013). We chose ERC as a proxy for fuel dryness to leverage available long-term ERC datasets for the western U.S., where this metric is frequently used to support fire suppression and to communicate fire risk. Daily ERC data from gridMET (gridded at 1/24th degree spatial resolution) were calculated using the U.S. National Fire Danger Rating System for a standard fuel model (dense conifer) that is the operational standard for much of the western U.S. (Bradshaw et al 1983). We used historical ERC data to assign an ERC value to each individual fire record using location and ignition date.
2.3. Model development
We developed a suite of spatially explicit statistical models that estimate wildfire ignition location (hereafter referred to as occurrence) and expected fire size as a function of ERC, location, and day-of-year for human and lightning-caused fires following the methods of Ager et al (2018). The ignition prediction model included separate models for human- and lightning-caused ignitions due to their distinct seasonalities (figure 2(C)) and spatial occurrence (figure 2(B)). The modelling workflow starts by estimating daily wildfire occurrence for the study area. Specifically we used the following formula to estimate the probability of any ignition per km2 per day:

where Pig , Plight , Phuman are the probabilities of any ignition, lightning-caused ignition and human-caused ignition, respectively.
We used logistic regression to estimate the probabilities of lightning- and human-caused ignitions. Specifically,

and
where, Y = a binary response variable (lightning-caused ignition, human-caused ignition or occurrence of a fire >10 ha given ignition), X = (X1, ..., Xn ) = a matrix of explanatory variables (ERC, location coordinates, day-of-year, land cover type) and s(X) = a smooth function of the three explanatory variables estimated from the data via spline functions. We used a periodic spline to estimate the effect of day.of.year and a two-dimensional spline to estimate a surface of locational effect. The location term was used as a surrogate to account for spatially-explicit variables (e.g. population density, roads, etc) that might have an effect on the probability of ignition or large fire occurrence and that were not included explicitly in the models.
For the estimation of fire size given a fire >10 ha, we used a log-normal regression with the final model used given by:
where, error was a Gaussian random error. All models were created utilizing the open-source R statistical program (R Core Team 2016).
2.3.1. Model application to future ERC
We then used projected ERC streams from 18 different GCMs in the spatiotemporal ignition prediction model to quantify changes in the number of fires per season, fire size, and frequency of EWEs by cause. We defined EWE as the maximum fire size by climate model for the first ten years of the simulation record (2006–2015) and tested how often the established maximum size record is expected to be exceeded over time.
To incorporate climate change into the spatiotemporal model of fire ignition and size, complementary grids of daily ERC were produced from statistically downscaled GCM data using the Multivariate Adaptative Constructed Analogs approach (Abatzoglou and Brown 2012; supplementary material). We downscaled daily meteorological fields from 18 different GCMs from CMIP5 (Rupp et al 2013) for both historical climate forcing (1950–2005) and future forcing (2006–2060) experiments, with the latter using RCP 4.5. The RCP 4.5 is a posited future pathway with continued climate mitigation whereby the globe warms approximately 2 °C above pre-industrial levels by 2060. These data were downscaled using the gridMET data to foster compatibility with the observed record. However, due to slight biases in covariability among GCM variables, we applied a trend preserving quantile delta mapping of resultant ERC such that the distribution of daily data for each model during 1979–2012 adhered to the distribution of observational data for the same period.
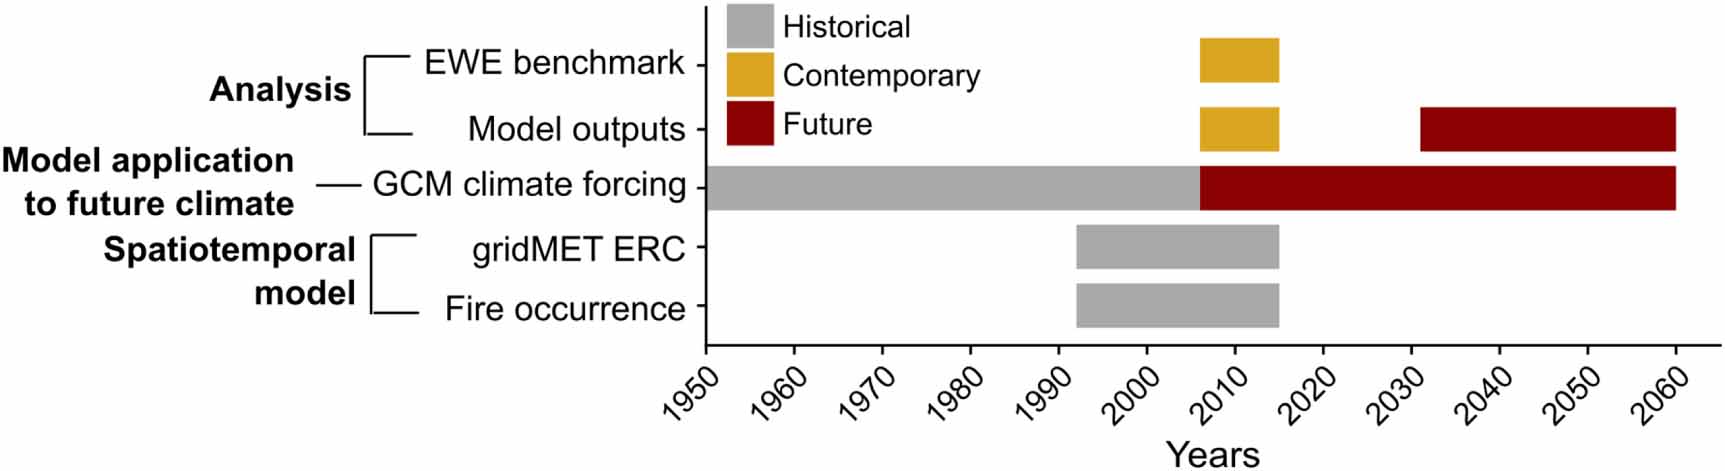
The output of the downscaling process was a series of daily ERC grids for each of the 18 GCMs. Each grid series was used to create additional daily synthetic ERC grid series by randomly shuffling years in a moving five-year window, creating four additional replicate grids (figure 3). All daily ERC grids share the same overall trends of the original ERC stream but allow for variability in daily ERC. This variability in ERC streams allows us to sample a larger range of possible daily ERC values for a given grid cell location and day-of-year. The spatiotemporal ignition prediction model randomly sampled from empirically-derived relationships between ERC, seasonality, location, and fire ignition and size to generate a list of fire ignitions expected to occur in a given fire year (henceforth, firelist). Each ignition listed in a firelist is associated with the following attributes: year, day-of-year, ERC, location, cause, land cover type and expected fire size. Figure 4 describes the time periods for all model data and analyses.
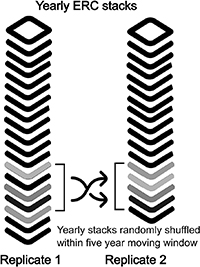
Figure 3. Reshuffling process to create five replicates from a single stack of annual ERC maps. This process was repeated for each of the 18 GCMs, resulting in five replicates per GCM.
Download figure:
Standard image High-resolution image
Figure 4. Periods (in years) associated with different datasets and analyses. EWE = extreme wildfire event; GCM = global climate model; ERC = energy release component.
Download figure:
Standard image High-resolution image2.4. Analysis of model outputs
For the model ensemble, we calculated the change between modelled contemporary (2006–2015) and projected future conditions (2031–2060) for the following variables: number of fires >10 ha, fire size, and occurrence of EWEs for human- and lightning-caused ignitions. We present results in terms of changes between contemporary and future conditions for the model ensemble average. We used the Kruskal–Wallis non-parametric test to compare the medians of the contemporary and future fire size, number of ignitions, and total area burned.
We defined the benchmark EWE as the maximum fire size by climate model for the first ten years of the simulation record (2006–2015) and tested (a) how often the established maximum size record is expected to be exceeded over the following simulated 45 years, and (b) how often the EWE benchmark was reset during that period, i.e. we tracked every year the maximum simulated fire size record was broken throughout the simulation period. We tested whether the probability of the maximum size record being broken differed from a theoretical model under stationary conditions. This was done by comparing modelled probabilities with a theoretical probability curve following decay of 1/n where n is the number of years from the start of the simulation record (Meehl et al 2009). This analysis accounts for the fact that as time passes (and records accumulate), it is increasingly unlikely for a stationary process to break a record.
3. Results
All four terms in equations (2)–(4) had significant effects on the respective ignition probabilities (P < 0.01). The variables day.of.year and land cover did not have a significant effect on fire size when included in a model with ERC and location (P > 0.1). The reliability diagram for ignition probability demonstrates the skill of the model predictions in that, on average, the historical observed fraction of ignitions matches our predictions by probability class (supplementary material figure S1). The between year variability was higher at the higher probability levels. This is to be expected since it is more difficult to predict an ignition than lack of one. The comparison of simulated fire size with ERC, superimposed over historical patterns, demonstrates the model's skill in predicting fire size (supplementary material figure S2).
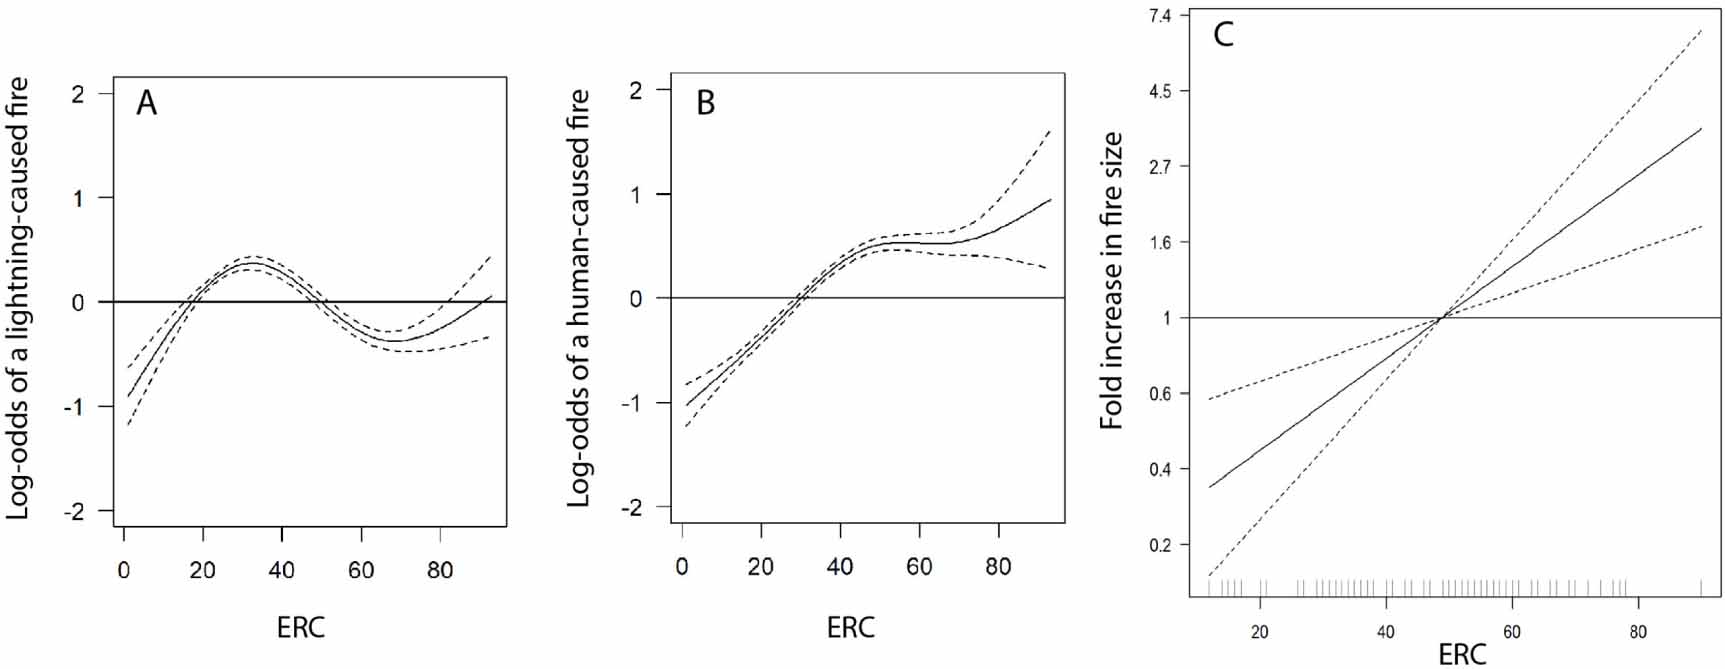
The log-odds of human and lightning ignitions from historical data (1992–2015) showed distinct responses to ERC. The log-odds of a lightning ignition peaked at around ERC = 30, followed by a drop (figure 5(A)), whereas the log-odds of human-caused ignitions increased consistently for ERC >30 (figure 5(B)). Expected fire size (figure 5(C)) increased with ERC as shown by the 'fold' increase in fire size relative to days when ERC = 50.

Figure 5. Log-odds of ignition of any size as a function of energy release component (ERC) for lighting- (A) and human-caused fires (B) based on historical data (1992–2015). Dashed lines denote standard errors. Panel (C) is a graph of estimated fold increase in fire size as a function of ERC. The fold increase is relative to the mean fire size when ERC is 50.
Download figure:
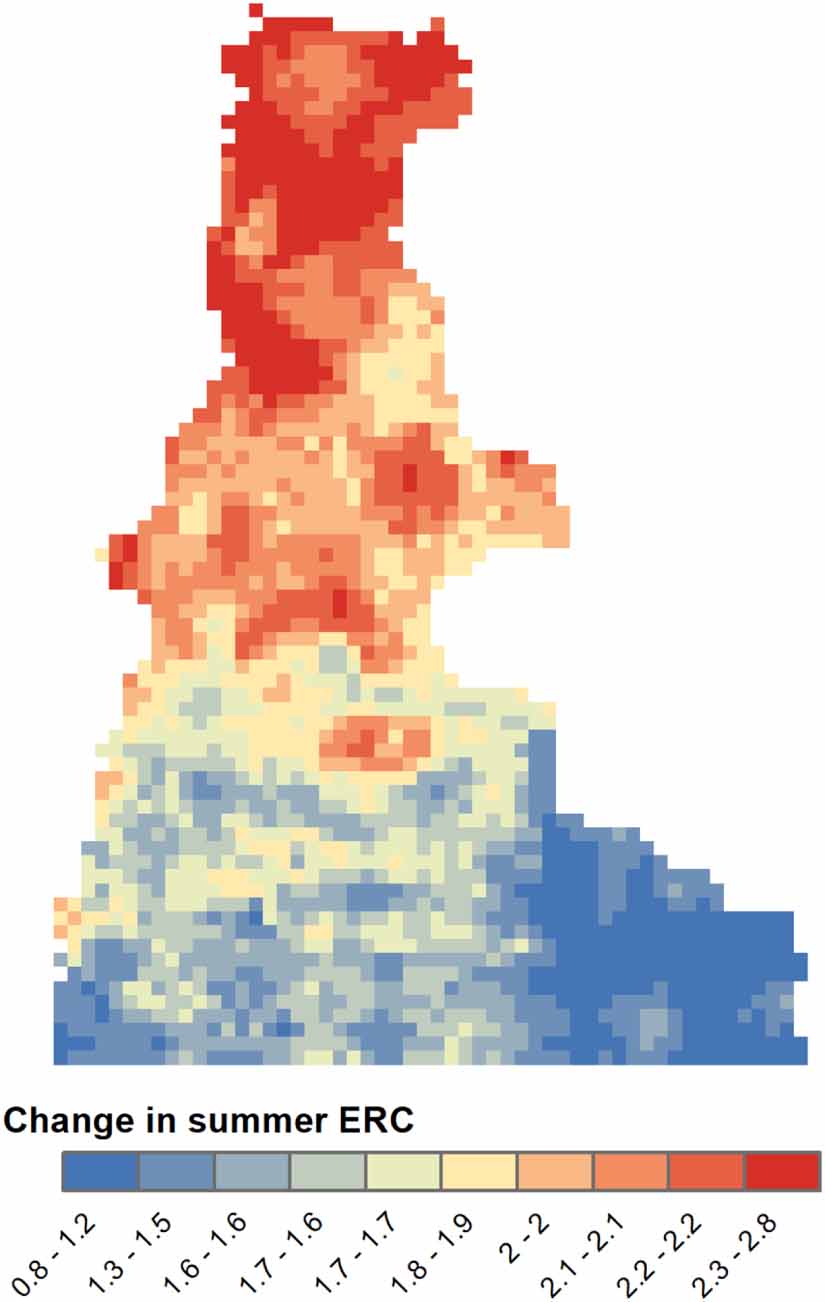
Standard image High-resolution imageMean change in summer ERC between the contemporary and the last decade of the future period varied spatially across the study area (figure 6). We defined summer based on the climatological summer definition, June to August. Maximum mean summer ERC increased a model-average of 2.6 points between the contemporary (2006–2015) and future (2031–2060) periods for the region. Relative to contemporary, mean summer ERC increased on average 1.7 points across the entire study area (figure 6). The increase in mean ERC was more pronounced in subalpine areas located at higher elevation—on average 2.1 relative to contemporary conditions and lesser on dry mixed conifer (lower elevation) areas where ERC mean summer increase increased 1.7 points between the two periods.

Figure 6. Mean change in summer energy release component (ERC) between contemporary and the last decade of the future time period across the study area and all 18 GCM models. Climatological summer was defined between 1 June and 31 August. Note elevational differences across the study area in figure 1.
Download figure:
Standard image High-resolution imageMean annual area burned varied among individual GCMs, with mean ensemble annual area burned (blue line, figure 7(A)) showing no temporal trend over the historical or future periods, and significant interannual variability within and among individual GCMs (figure 7(A)). Despite the lack of a strong temporal trend, relative to contemporary conditions, years with area burned >20 000 ha will be comparably more frequent under future conditions (figure 7(B)). Results from the Kruskal–Wallis non-parametric test showed a significant difference in mean area burned between contemporary (2006–2015) and future (2031–2060) periods (P < 0.0014), with an increase in the latter of 19%.
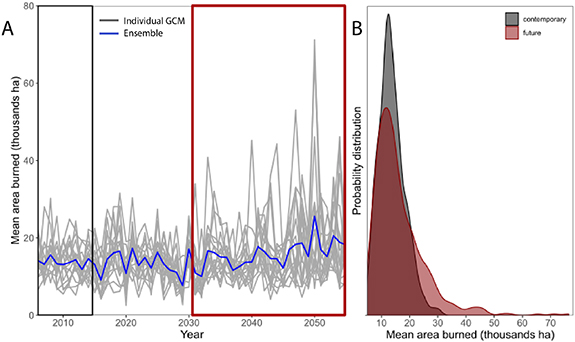
Figure 7. (A) Annual area burned projected by each GCM (each line showing the five-replicate average for any given GCM for a total of 18 lines) and the 18-model ensemble average (blue line). Panel (B) shows the relative frequency of mean annual area burned across GCMs for the contemporary and future periods. Relative frequencies account for differences in the number of years between contemporary (10 year record) and future (30 year record). See figure 4 for a description of the time periods for all model data and analyses.
Download figure:
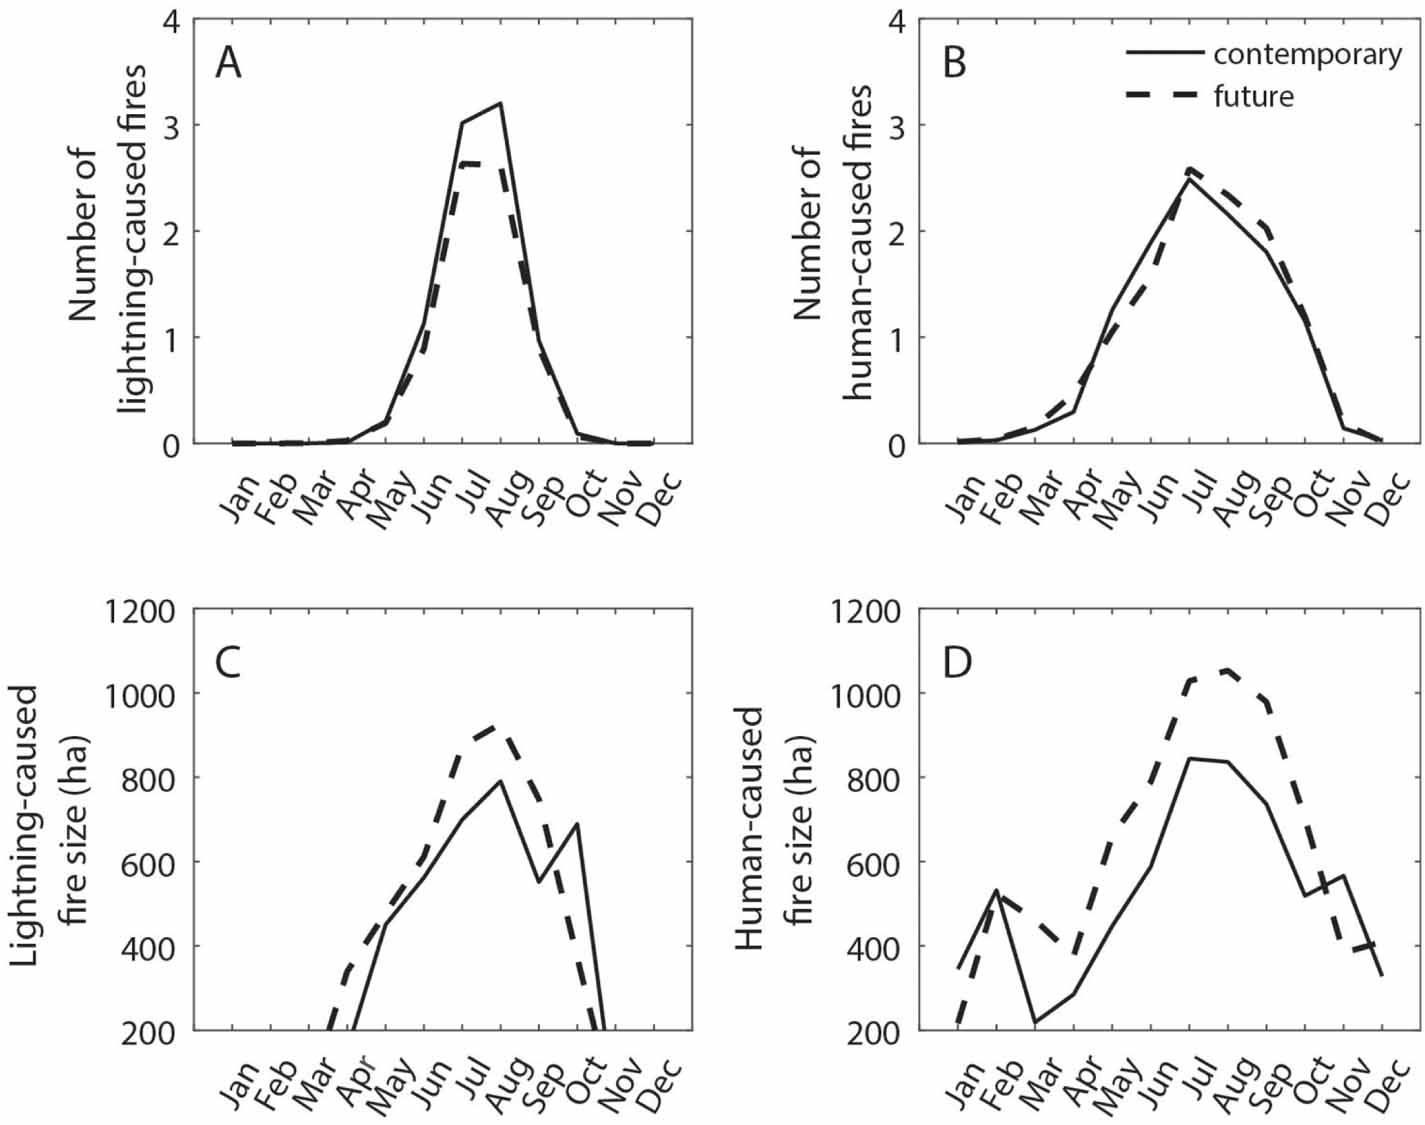
Standard image High-resolution imageThe number of lightning-caused fires was slightly reduced (−14%, interquartile range = 5.18%) under future conditions (P < 0.001) and there was no significant change in mean number of human-caused ignitions (P = 0.145) between the contemporary and future periods (figures 8(A) and (B)). The projected mean number of fires greater >10 ha was 20 fires per year under current conditions and 19 fires per year by mid-century. Relative to contemporary values, mean fire size increased under future conditions, regardless of fire cause. Fire size of lightning-caused fires increased (P = 0.019) by 22% (interquartile range = 34%) under future conditions and human-caused fires were 31% larger (interquartile range = 40%, P < 0.001) than under contemporary conditions (figures 8(C) and (D)).

Figure 8. Number of monthly ignitions for lightning (A) and human-caused (B) ignitions generating fires >10 ha (see figure 2 for the spatial distribution of historical ignitions) and mean fire size associated with lightning- (C) and human-caused (D) fires.
Download figure:
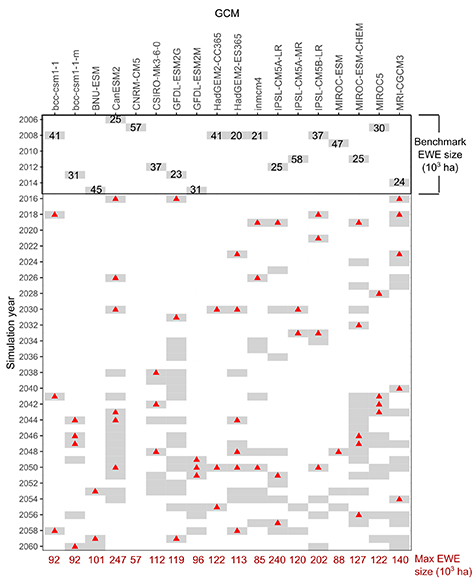
Standard image High-resolution imageModelled EWE frequency for both human and lightning ignitions exceeded what would be expected based on stationary climate (supplemental material figure S3). Ten of the climate scenarios (GCMs) experienced 3.8 EWE events that exceeded the contemporary benchmark (figure 9). Across the whole GCM ensemble, the lowest number of EWEs experienced was zero (CRNM-CRM5), and the highest was six (CanESM2 and HadGEM2-ES). The average increase in EWE size was 43 272 ha with an interquartile range of 39 981 ha. In terms of worse case scenarios, the average increase in EWE size between the benchmark and the maximum EWE experienced (across the 17 GCMs with EWEs) was 346% (89%–895%) (supplemental material table S2). For example, IPSL-CM5A-MR had the highest benchmark EWE value (57 684 ha), and this value was not exceeded by any of the predicted fires until 2030 and 2033. IPSL-CM5A-LR had the highest average EWE increase over the contemporary benchmark (345%), with a maximum EWE of 239 466 ha by the end of the simulation (supplemental material table S2).
Figure 9. Expected extreme wildfire event (EWE) activity over time for each global climate model (GCM). Benchmark EWE is defined as the maximum fire size by GCM across all five replicates for the first ten years of the simulation record (2006–2015). Grey boxes for years 2016–2060 indicate years when the maximum fire size was greater than or equal to the benchmark EWE for any individual replicate. The first red triangle chronologically in the simulation record indicates a year when a new maximum fire size was met for at least one replicate that exceeded the EWE. Each subsequent red rectangle indicates another new maximum fire size (one that exceeded the size threshold set by the previous red triangle). For example, the benchmark EWE for bcc-csm1-1 was 41 223 ha. In 2018 a new maximum fire size threshold was set of 61 133 ha, and in 2041 an even higher maximum fire size threshold was set of 61 480 ha. This threshold was not exceeded again until 2058 (92 137 ha). Note that maximum EWE size by GCM over the course of the simulation is indicated at the bottom of the heatmap.
Download figure:
Standard image High-resolution image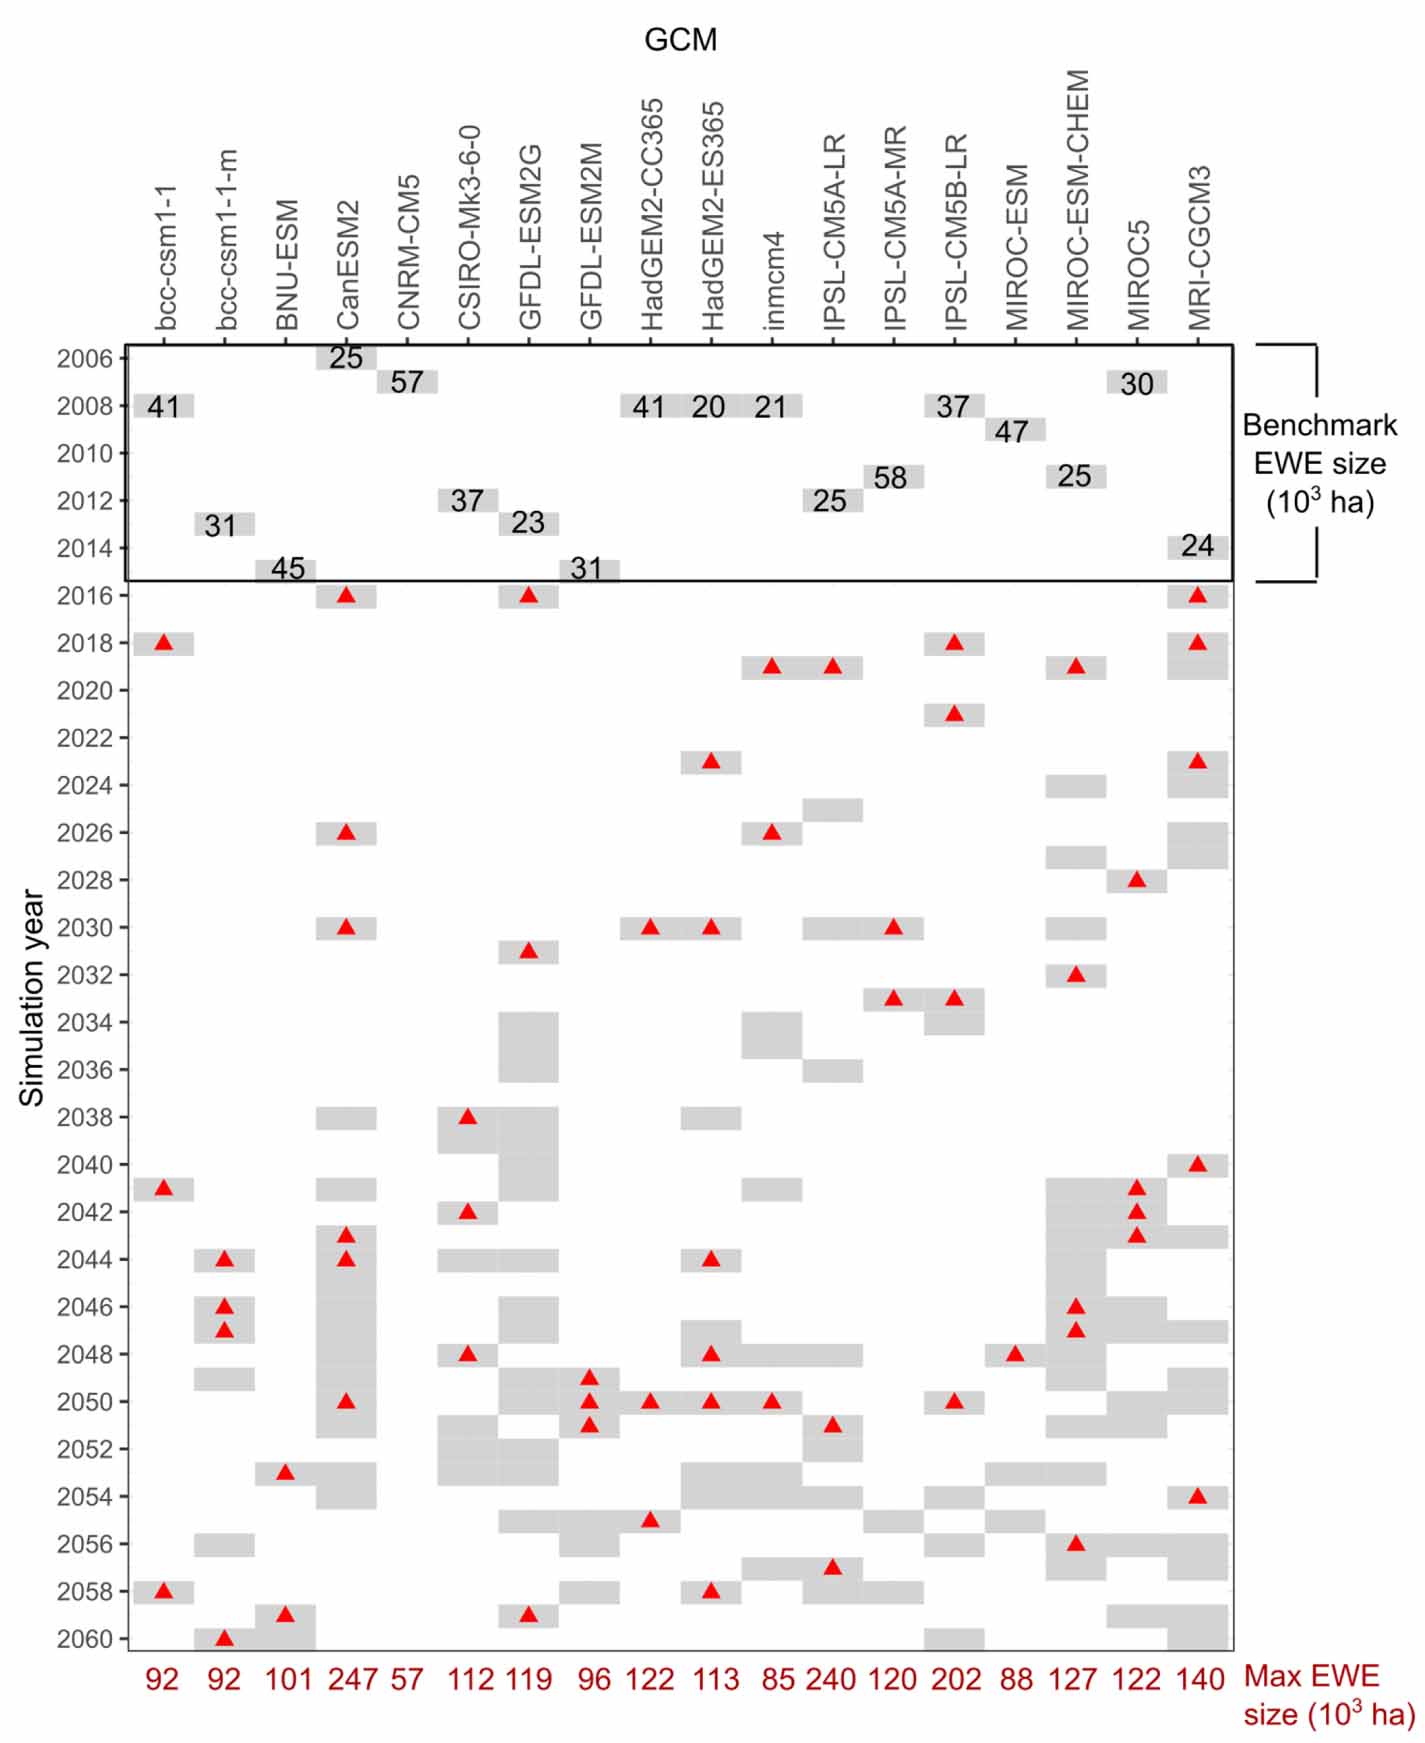
4. Discussion
We modelled future fire regimes at spatial and temporal scales suited to reflect local fire-climate nuances such as seasonality and cause. Results from this analysis can help develop flexible systems that account for the way future climate can impact fire regimes differently and help inform local staffing, preparedness, prevention, and restriction plans. This analysis focused on projected impacts on fire frequency and fire size solely by increasing fire danger days, assuming that contemporary relationships of ERC-fire frequency and ERC-fire size will hold in the future for both human- and lightning-caused fires.
Our model projected increases in area burned by mid-century relative to the contemporary period. This increase in area burned was driven by an increase in fire size. These results agree with previous fire predictions by empirical models operating at coarser scales (western US) that report increases in area burned by mid to late century (McKenzie et al 2004, Kitzberger et al 2017, Littell and McKenzie 2018). The increase in EWEs follows the positive trend identified in previous work projecting future incidence of very large fires, although the definition of very large fire is not consistent across analyses (Barbero et al 2015, McEvoy et al 2020).
4.1. Lightning-caused fires
Our analysis projected that number of fires >10 ha per season remained approximately the same between the contemporary and future time periods. This uniform fire occurrence is likely a response to the shape of the fire ignition-ERC distribution for the region (figure 2(B)), emphasizing the importance of regional studies that capture local patterns of fire occurrence. In the contemporary record, lightning ignitions were more likely on days with moderate ERC, and this likelihood diminished with higher ERC. One possible reason for the reduction in lightning ignitions under higher ERC is that in the region, lightning-caused fires occur after the passage of light precipitation, including that from cold fronts that can lead to a drop in ERC. Numerous fires from widespread cloud-to-ground lightning can flare for days to weeks after the lightning event due to extreme fire weather, reduced fuel moisture, and temperature increases (Schroeder and Buck 1970). It is also important to note that the ignition date that was used to assign a daily ERC value corresponds to the day of detection which may not coincide with day of ignition. Regardless of what explains the observed relationship between number of lightning ignitions and ERC this relationship may not necessarily carry on into the future. For example, Romps et al (2014) projected that by 2088 the rate of lightning flashes over the contiguous United States is likely to increase by half relative to the 1996–2005 reference period. However, the frequency of lightning strikes alone does not necessarily correlate well with fire starts, particularly in the Pacific Northwest (Rorig and Ferguson 1999) where lightning events can be associated with precipitation (wet lightning) or occur outside of the area of precipitation or with precipitation that evaporates before reaching the ground (dry lightning).
Changes in the number and seasonality of lightning-caused ignitions have implications for restoration efforts that plan on lightning ignitions under low-risk conditions to increase the pace and scale of forest restoration. While the number of lightning-caused ignitions was slightly reduced (−14%), this reduction occurred during summer months when fire managers might be less willing to manage lightning ignitions to accomplish ecological objectives due to greater risk of escape, concurrent fires, and potentially fewer resources available. On the other hand, we projected no changes in spring and autumn lightning ignitions when the weather might facilitate management of lightning- ignited fires for ecological objectives (Barros et al 2018).
4.2. Human-caused fires
The likelihood of human-caused fires was similar for ERC values between 40 and 70 and then increased slightly. This suggests the frequency of human-caused fires is more likely to increase in response to increases in daily fuel dryness (ERC) than lightning-caused fires, a problem that is compounded by evidence of the growing frequency and impact of human-caused fires (Abatzoglou et al 2018, Nagy et al 2018, Mietkiewicz et al 2020).
Projected fire size increased for human-caused ignitions—with fires on average 30% larger as a response to an increase in dryness (ERC) only. We did not account for concurrent high wind events or changes in fuels management, landcover, or suppression capacity that may affect future fire size-ERC relationships. We held all these factors constant and looked at the effect of future ERC on the occurrence of EWEs. Our results suggest that future fire regimes in this study landscape may be characterized by an increase in record-breaking fire sizes.
The increase (albeit small) in the number of human-caused fires combined with an increase in fire size can have implications for operating plans that focus on staffing, preparedness, and prevention (Cattau et al 2020). Decision points (e.g. daily ERC, number of concurrent ignitions) based on past conditions may be inadequate as most projections show historical records of area burned and fire size will continue to be broken over time. Adaptation strategies may include setting new ERC thresholds at which restrictions and emergency closures to public lands are enforced during periods when human ignitions are expected to be high (e.g. Fourth of July) and re-dimensioning of daily resource availability and initial attack response during pre-identified times.
Parsing out the relative contribution of human- and lightning-ignited fires in future fire regimes is also critical to inform stakeholder engagement in diverse settings (Bendix and Hartnett 2018). Despite overwhelming evidence in support of increased wildfire frequency and extent in response to a changing climate, at local and regional scales, perceptions of wildfire risk and risk drivers are less unequivocal. A survey of residents in rural communities of the Blue Mountains of Oregon showed that most participants perceive the rising frequency of large wildfires, but the causes and drivers of that increase were perceived differently and predicted by their sociopolitical identity (Hartter et al 2020). In some communities, climate change and its impact on fires today and in the future remain a polarizing theme. This will likely impact how decision-makers and land managers engage with stakeholders and how they craft effective risk mitigation and communication programs—particularly in cases where the risk associated with human-caused ignitions is expected to be compounded by future climate.
We did not account for changes in population density or human behaviour that may affect contemporary patterns of human ignitions and fuels. Similar to other rural areas in the Pacific Northwest (Christensen et al 2000), the study area has seen a shift from timber to a recreation economy with amenity-based property buyers acquiring small tracts of land as seasonal or secondary homes. This has been accompanied by a shift in the way land is perceived and managed (Hartter et al 2020). The many amenities rural spaces provide—environmental quality, access to public recreational and cultural resources—will continue to drive the migration from urban to rural spaces. Presumably, shifts in work practices and the increased ability to telework will compound these effects, however anticipating the role of human impacts on future fire regimes is challenging.
4.3. EWEs
Our projections suggest that in the future individual fire events will be larger (and more frequent) than observed in the available historical record (1992–2015) (figure 9). These projections are in agreement with other regional studies that used alternative future climates to project expected changes in size and frequency of extreme fires albeit with different modelling approaches and definitions of extreme events (Stavros et al 2014b, McEvoy et al 2020). Whether the projected effects on fire occurrence and size will materialize depends on fire and fuel feedbacks not accounted for in our models. For example, in real landscapes, the occurrence of a future EWE is linked to whether and when EWEs occurred in the same area. The effect of past fires on future fire occurrence is typically associated with negative feedbacks (Halofsky et al 2020). In our model, ignitions simulated for any given year assume the same fuel availability every year and have 'no memory' of past fires. Previous fires reduce the fuel available to burn (Donato et al 2013), and as such, can reduce the likelihood of ignition (Parks et al 2016), the likelihood of an ignition becoming a large fire, and expected fire size—the components of our statistical model. However, while past fires can limit the occurrence and spread of subsequent fires, particularly in less productive systems, this effect dampens as time passes and vegetation recovers (Parks et al 2015) and is less pronounced under extreme fire weather characterized by strong winds and warm, dry conditions (Parks et al 2015).
We defined EWE based on size, but it is important to note that not all EWEs are necessarily socio-ecological disasters, i.e. events that caused fatalities, consumed primary homes, and/or were defined as so by a national government (Bowman et al 2017, Joseph et al 2019), and large fires can have an important role in restoring ecological conditions in fire excluded landscapes. However, large fires also have the potential to disproportionally impact vulnerable communities and magnify pre-existing vulnerabilities in ways that play out over years and decades. Long-term recovery and adaptation towards socio-ecological resilience, e.g. ability to afford insurance, rebuild structures, create and maintain defensible spaces, and live with smoke, may be disproportionally hindered in vulnerable communities (Davies et al 2018, Palaiologou et al 2019). In the conterminous U.S., 29 million people coexist with potential for extreme wildfires, but 12 million are socially vulnerable people, meaning that a wildfire event could be disastrous (Davies et al 2018). Furthermore, census tracts that are majority Black, Hispanic or Native American are associated with greater vulnerability to wildfire than other census tracts (Davies et al 2018). Under the status quo, projected climate change is expected to exacerbate social inequalities unless ecosystems and communities adapt to a changing climate and more wildfire (Schoennagel et al 2017) in an equitable way. Adaptation plans must integrate climatic, ecological, and socio-economic data at a scale relevant to identify where social risks are the greatest.
Large fire events can also impact public attitudes and trigger new policy in response to particularly extreme wildfire years (Fischer and Jasny 2017, Mockrin et al 2018, 2020) and can incentivize the development of fire-adapted communities (Schumann et al 2020). For example, the 210 ha Pine Forest community in Winthrop, WA, was exposed to fire during the 2015 Twisp River fire that burned within a quarter-mile of the community. Following the fire, the community organized to update their forest stewardship plan and has completed fuel reduction treatments in 75% of individual lots and 70% of common spaces (WADNR 2020).
Large fire events can also have long-lasting ecological impacts on ecosystems (Foster et al 1998), and those impacts can be compounded by subsequent reburns (Halofsky et al 2020), which our model indicates may be more frequent and extensive in the future. Fire size alone is not always indicative of the ecological outcomes (negative or positive) and should be accompanied by measures of severity per vegetation or land cover type. Future wildfire projections need to broaden the scope of fire regime descriptors to include cause and EWEs in addition to other fire regime metrics that relate to fire effects such as severity.
On the other hand, in many fire-adapted systems where fire reintroduction is a key management goal, more area burned can help accomplish important restoration work. Under certain conditions, fire managers can take advantage of opportunities created by large fires to achieve important forest health work by managing fires for multiple ecological benefits. Increasing and maintaining the capacity to manage very large events across multiple state, local and federal agencies with fire responsibilities will be key to adapt to a future where EWEs will be more frequent and larger.
4.4. Model assumptions and limitations
Our models projected increases in area burned and the potential of increasingly large fires in this central Oregon study area by mid-century. These results quantify the potential effect of future ERC distribution on selected fire regime attributes. We highlight three major assumptions in this study: (a) our model assumes that contemporary ERC-ignition and ERC-fire size relationships will hold under future conditions; (b) the model did not explicitly account for changes in fire weather events, such as the east downslope winds that impacted the western Oregon Cascades in 2020; and (c) our model does not account for interactions between fire and other disturbances that may become more prevalent in a warming climate (Halofsky et al 2020). For example, on hotter and drier sites, the co-occurrence of drought, insect outbreaks, failed regeneration and non-native invasions (Kerns et al 2020) in response to disturbance have the potential to change ERC-occurrence and ERC-size relationships modelled in this study.
5. Conclusions
While climate change is a global challenge with potential impacts on many facets of social and ecological systems, adaptation to future fire regimes will require multi-scale risk governance strategies that include local solutions (Steelman 2016). We reported possible future fire scenarios at a scale compatible with adaptive strategies to changing fire regimes. Projected change in fire frequency and fire size was assessed by increasing periods of high fire danger using empirical relationships of ERC-fire frequency and ERC-fire size, and assumed these will hold in the future for both human- and lightning-caused fires. The projected increase in area burned by mid-century (2031–2060) relative to the contemporary period (2006–2015) was consistent across all future climate scenarios, and driven by an increase in the size of EWEs. However, wildfires can have both positive and negative long-term effects, and severity predictions are needed to refine assessments of impacts of future fire regimes. Positive outcomes from managing natural ignitions are well documented (i.e. resource objective wildfire, (Huffman et al 2020)) in terms of restoring fire excluded forests to resilient conditions. By contrast, human ignitions require an immediate suppression response under current policy, and their projected increase in concert with expanding housing in wildland areas (Radeloff et al 2018) will increasingly challenge fire management agencies, and projected EWEs may lead to community disasters observed in the western US (Ager et al 2021) and elsewhere (Molina-Terrén et al 2019). The next step in our work is to use projected future wildfire events as inputs into an agent based landscape model as performed for contemporary fire regimes in our prior work (Ager et al 2018). In this way scenario analyses can be used to test adaptation strategies and understand the potential impacts of uncertain wildfire futures in a coupled human-natural systems context. Similarly, results from simulations could be used to improve current planning for the socio-ecological impacts of highly uncertain future fire regimes projected in this and other studies (Halofsky et al 2020).
Acknowledgments
We are grateful to Nancy Farr, Kathryn Heim, Heather Dean, Jake Hardt, Angie Lane and Russ Lane for their perspective that greatly contributed to the discussion of results. We are also thankful to the insightful comments of two anonymous reviewers that helped improve earlier versions of this work.
This work was supported by funding from the National Science Foundation, Coupled Human and Natural Systems Program (CHH-1013296), the United States Department of Agriculture, Forest Service, Rocky Mountain Research Station, and the Joint Fire Science Program (14-1-01-22).
Data availability statement
The data that support the findings of this study are available upon reasonable request from the authors.