

Abstract
Electric, autonomous vehicles promise to address technical consumption inefficiencies associated with gasoline use and reduce emissions. Potential realization of this prospect has prompted considerable interest and investment in the technology. Using publicly available data from a select market, we examine the magnitude of the envisioned benefits and the determinants of the financial payoff of investing in a tripartite innovation in motor vehicle transportation: vehicle electrification, vehicle automation, and vehicle sharing. In contrast to previous work, we document that (a) the technology's envisioned cost effectiveness may be impeded by previously unconsidered parameters, (b) the inability to achieve cost parity with the status quo does not necessarily preclude net increases in energy consumption and emissions, (c) these increases are driven primarily by induced demand and mode switches away from pooled personal vehicles, and (d) the aforementioned externalities may be mitigated by leveraging a specific set of technological, behavioral and logistical pathways. We quantify—for the first time—the thresholds required for each of these pathways to be effective and demonstrate that pathway stringency is largely influenced by heterogeneity in trip timing behavior. We conclude that enacting these pathways is crucial to fostering environmental stewardship absent impediments in economic mobility.
Export citation and abstract BibTeX RIS
1. Introduction
Energy demand in road transportation is significant. In the United States alone, gasoline consumption averages over 300 million gallons daily, most of which is used by light-duty vehicles [1]. Though use of these vehicles facilitates economic mobility, negative externalities persist. Internal combustion engines (ICE)—used to propel most light duty vehicles—convert only a fraction of stored energy into propulsion, thereby producing significant consumption inefficiencies [2]. ICE powered vehicles are also—owing to fossil-fuel reliance—a dominant source of air pollutants that contribute to climate change and increase societal morbidity and mortality risk [3, 4].
Can the confluence of three technologies—vehicle electrification, vehicle automation, and vehicle sharing—help address the aforementioned externalities? Vehicle electrification offers a more favorable energy profile owing to superior tank-to-wheel efficiency and zero tailpipe emissions [5]. This proposition is improved upon by vehicle automatization, the shifting of higher-order control functions from humans to machines. Doing so facilitates eco-driving, vehicle maneuvering practices that minimize energy losses associated with repeated, energy-intensive braking-acceleration cycles [6–9].
Further energy related benefits are envisioned via vehicle sharing. Existing personal vehicle (PV) ownership models contribute to road congestion [10], and by consequence, increased consumption/emissions, owing to homogenous temporal and route use. Vehicle sharing—made more seamless by trip matching algorithms—may mitigate these effects by reducing the number of vehicles required to meet local transportation needs [11]. Sharing (here considered separately from ride pooling) entails foregoing PV ownership entirely and instead procuring mobility as a service using commercial fleet operators (i.e. taxis) [12–15].
The confluence of vehicle electrification, vehicle automation, and vehicle sharing features prominently in existing literature as a means of reducing energy consumption and emissions [12–15]. Our work examines the efficacy of this approach. We do so in two parts. First, we quantify the financial proposition of electric, autonomous taxis (ATs) compared to non-electric, non-autonomous vehicles currently employed as conventional taxis (CTs) or PVs. Next, we assess, based on this financial proposition, the energy impact of AT deployment relative to the status quo.
Unlike previous work, our work considers factors such as safety oversight [16–18] 5 , capacity utilization considerations and the share of social gains required by fleet operators as a profit incentive to shift from CTs to ATs [12, 13, 19–21]. Our work considers factors traditionally overlooked when estimating AT costs, the most notable being safety oversight. We also consider the possible paradox whereby technology-driven cost and energy savings produce rebound effects via increased energy use from high elasticity of usage when price falls.
The findings of our paper are fourfold. First, we illustrate that an AT's financial proposition, while being more favorable than CTs, remains—contrary to existing discourse—less favorable than PVs. ATs impose a cost of between $1.42 and $2.24 per mile compared to $3.55 and $0.95 per mile incurred when using CTs and PVs respectively. Second, we identify previously overlooked parameters, the most notable being capacity utilization and profit incentive, as significant impediments to achieving cost parity between ATs and PVs. Omission of these parameters lowers AT rider costs to as low as $0.47 per mile. Third, we document that rebound effects do not require cost parity between ATs and PVs. We show that AT introduction produces a net increase in energy consumption and emissions, despite ATs being more expensive than PVs. Fourth, we identify and quantify the technological, behavioral and logistical pathways—namely, conformance to AT-specific energy profile, ride-pooling and 'smart deployment'—required to achieve net reduction in energy consumption and emissions owing to AT deployment.
Our work collectively shows that the confluence of vehicle electrification, vehicle automation and vehicle sharing may not—contrary to existing discourse—produce a favorable energy outcome. Our position is informed by (a) an analysis of publicly available data in a select market, and (b) accommodation of uncertainties typically associated with the deployment of nascent technology. We conclude that addressing technical consumption inefficiencies and public health concerns associated with CTs and PVs via ATs requires leveraging specific pathways, and by consequence, will demand concerted collaboration and engagement by regulators, auto makers, mobility service providers and consumers alike.
2. Method
Our study examines the viability of ATs as a pathway towards reduced energy consumption and emissions. To do so, we first quantify and compare the financial proposition of electric, ATs to non-electric, non-autonomous vehicles currently employed as CTs or PVs. We subsequently assess, based on an AT's financial proposition, the energy impact of AT deployment relative to the status quo.
Our work employs a two-stage model (figure 1). The first estimates—in a specified market—the cost incurred by consumers for using ATs, CTs and PVs respectively; the second estimates the aggregate change in energy consumption and emissions associated with AT introduction. Cost estimates for ATs inform energy predictions surrounding the technology's use, given the influence cost levies on technology adoption and proliferation.

Figure 1. Two-stage model overview of financial and energy estimation. Arrow widths for financial estimation reflect fare/cost magnitude with wider arrows depicting higher cost. Arrow widths for environmental estimation reflect usage frequency with wider arrows depicting increased use. Increasing color intensity of arrows for environmental estimation reflect higher carbon intensity.
Download figure:
Standard image High-resolution imageWe leverage—where possible—publicly available data to inform our model. In instances where precise data is unavailable, we utilize what data is available to substantiate an informed estimate. We subsequently test the relevance of our estimates by applying sensitivity testing (see section 2.3). Details of our approach, data that inform our model and references justifying their use are available in the supplementary information section (available online at stacks.iop.org/ERL/16/094036/mmedia).
2.1. Financial estimation
Expenditures considered when estimating consumer cost include vehicle financing, licensing, insurance, maintenance, cleaning, fuel and, for ATs specifically, safety oversight [16, 22]. Requisite safety oversight is assumed to decrease as AT technology advances. We also take account of operator-envisioned profit expectations and fluctuations in capacity utilization rates that reflect demand heterogeneity.
AT cost estimates also consider heterogeneity in vehicle operational lifespan and annual mileage. As the pro-rating of fixed costs over time impacts the financial proposition of ATs, both factors warrant attention. Mileage heterogeneity considers vehicle recharging requirements that may limit vehicle productivity and subsequently, profitability [23, 24]. Productivity may be further impeded when vehicle electrification is paired with vehicle automatization owing to increased vehicular weight, sensor load and aerodynamic drag, all of which limit vehicle range [25].
We also consider consumer travel time in terms of hourly wages and thus transform differences in travel time to money units [19, 26]. Literature suggests that productivity benefits are realized through the re-allocation of time to paid or leisure activities that replace the demands of driving on attention. Envisioned benefits include would-be drivers performing other valued activities [19].
2.2. Energy estimation
The nascent nature of AT technology necessitates consideration of a hypothetical vehicle. Our AT is a mid-sized, electric auto with an internal volume between 110 and 120 ft3. The vehicle's energy profile is assumed to be consistent with an electric auto; one with a fuel economy and emissions footprint of 114 miles per gallon equivalent and 159.1 CO2 grams per mile respectively [27]. Fuel economy estimates are within the range of estimates pairing vehicle electrification with vehicle automation [8, 28]. Emissions estimates account for vehicle production, extraction, processing, transportation, and fuel distribution [27].
The energy profile of CTs and PVs—both of which are also assumed to be mid-sized vehicles with an internal volume between 110 and 120 ft—are estimated using pre-existing data [27]. CTs are—consistent with the fleet profile in our target market—assumed to be hybrid-electric vehicles whereas PVs are powered by ICEs. Both vehicles have a fuel economy of 52 and 34 miles per gallon and emit 237.7 and 380.2 grams of CO2 grams per mile, respectively. These figures reflect the lifetime mileage of CTs and PVs in our target market.
Our model also considers the emissions profile of public transit in our target market. Doing so accommodates instances where AT introduction may prompt mode switches from publicly funded transportation modes [29]. Our public transit energy profile is estimated—leveraging market specific demand characteristics—as a weighted average of heavy rail, commuter rail, light rail and transit buses [30, 31]. Consumption and emissions estimate per mile are based on existing sources and are occupancy adjusted [30]. These values are subsequently weighted based on their proportional contribution to overall miles traveled [31]. Proportions exclude passenger miles traveled via other motorized and nonmotorized transportation modes.
2.3. Uncertainty considerations
Uncertainty surrounding an AT's precise financial and energy profile warrant acknowledgement. The validity of our assumptions and the predictions estimated by our model are admittedly based on imperfect information, this given the nascent nature of the technology. For example, there is little publicly available data on what AT financing costs will be. We address concerns regarding the magnitude of input parameters (like financing), the relevance of their inclusion (particularly where licensing fees are concerned) and their subsequent impact on the cost proposition of ATs through elasticity testing and sensitivity analysis (detailed in section 3.1).
A similar approach is employed when estimating the energy impact of ATs. Impact estimates consider specific vehicle energy profiles and where electrified powertrains are concerned, grid carbon intensity and battery replacement frequency. This approach may well under or overestimate the true energy impact of ATs. Consequently, we also quantify the consumption/emissions footprint required of ATs to produce a net positive energy impact, acknowledging that variations in those assumptions would demand a less or more stringent AT energy profile (detailed in section 3.4).
3. Results and discussion
Our results and discussion are structured as follows. In section 3.1, we present and discuss the financial proposition of ATs compared to CTs and PVs. In section 3.2, we assess—based on the aforementioned results—the energy impact of AT deployment relative to the status quo. Our energy assessment subsequently informs our evaluation of subsequent considerations, which are presented in section 3.3. In section 3.4, we address uncertainties surrounding our work and in section 3.5, we assess the public policy implications.
3.1. Financial assessment
AT fare-per-mile estimates drop as technology advances (figure 2). Cost parity between ATs and CTs is achieved at low levels of technological maturity regardless of travel time costs. However, achieving cost parity between ATs and PVs requires both high levels of technological maturity and consideration of travel time cost.
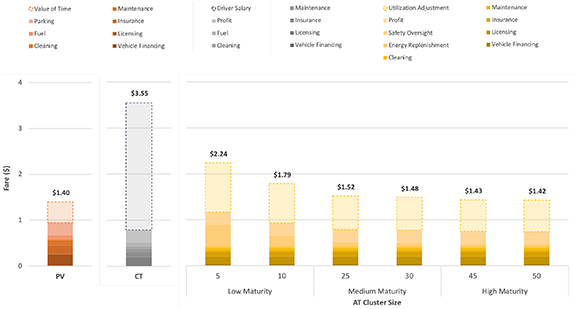
Figure 2. Cost/fare-per-mile estimates.
Download figure:
Standard image High-resolution imageElasticity testing of AT-related input costs and parameters reveals several effects (table 1). Assuming high levels of technological maturity, capacity utilization approaches unit elasticity, dominating other model parameters. This is followed by annual mileage, envisioned profit-per-mile and licensing, whose changes exert disproportional influence on AT fares relative to other model parameters (i.e. financing, insurance, maintenance, cleaning, fuel, safety oversight and operational lifespan).
Table 1. AT fare per mile estimates given a 5% change in specified input parameters.
| Low maturity | Medium maturity | High maturity | ||||
|---|---|---|---|---|---|---|
| 5 | 10 | 25 | 30 | 45 | 50 | |
| Estimated fare per mile | 2.24 | 1.79 | 1.52 | 1.48 | 1.43 | 1.42 |
| Financing | 0.004 | 0.004 | 0.004 | 0.004 | 0.004 | 0.004 |
| −0.159 | −0.200 | −0.235 | −0.240 | −0.249 | −0.250 | |
| Licensing | 0.015 | 0.015 | 0.015 | 0.015 | 0.015 | 0.015 |
| −0.684 | −0.857 | −1.010 | −1.031 | −1.067 | −1.074 | |
| Insurance | 0.010 | 0.010 | 0.010 | 0.010 | 0.010 | 0.010 |
| −0.458 | −0.575 | −0.678 | −0.691 | −0.716 | −0.721 | |
| Maintenance | 0.003 | 0.003 | 0.003 | 0.003 | 0.003 | 0.003 |
| −0.136 | −0.170 | −0.201 | −0.205 | −0.212 | −0.213 | |
| Cleaning | 0.005 | 0.005 | 0.005 | 0.005 | 0.005 | 0.005 |
| −0.216 | −0.270 | −0.319 | −0.325 | −0.337 | −0.339 | |
| Fuel | 0.004 | 0.004 | 0.004 | 0.004 | 0.004 | 0.004 |
| −0.165 | −0.207 | −0.244 | −0.249 | −0.258 | −0.260 | |
| Safety oversight | 0.086 | 0.043 | 0.017 | 0.014 | 0.010 | 0.009 |
| −3.850 | −2.413 | −1.138 | −0.968 | −0.668 | −0.605 | |
| Profit | 0.026 | 0.026 | 0.026 | 0.026 | 0.026 | 0.026 |
| −1.160 | −1.454 | −1.715 | −1.750 | −1.811 | −1.824 | |
| Capacity utilization | 0.107 | 0.085 | 0.072 | 0.071 | 0.068 | 0.068 |
| −4.762 | −4.762 | −4.762 | −4.762 | −4.762 | −4.762 | |
| Operational lifespan | 0.003 | 0.003 | 0.003 | 0.003 | 0.003 | 0.003 |
| −0.152 | −0.190 | −0.224 | −0.229 | −0.237 | −0.238 | |
| Annual mileage | 0.071 | 0.049 | 0.036 | 0.035 | 0.033 | 0.032 |
| −3.164 | −2.760 | −2.401 | −2.353 | −2.268 | −2.251 | |
For each input parameter, the upper line denotes the absolute change in fare-per-mile ($) and the lower line, the relative change (%).
We use sensitivity analysis to identify the conditions under which AT fares become cost competitive with PVs. We focus on inputs/parameters for AT fleet operators—specifically, capacity utilization, annual mileage and envisioned profit-per-mile. This focus is intentional as reductions in other input costs/parameters, specifically financing, maintenance and fuel depend on a complex interaction between and across economic actors and conditions and hence are beyond the control of AT fleet operators.
Our model estimates that increasing AT capacity utilization rates (from 52% to 53%) produces—assuming high levels of technological maturity and consideration of the value of travel time—fares comparable with PVs. Absent consideration of travel time, cost parity between ATs and PVs requires—ceteris paribus—raising AT capacity utilization rates from 52% to 78%. Requisite utilization rates are lower as annual mileage increases and/or envisioned profit-per-mile decreases.
We draw four conclusions from the aforementioned results.
Firstly, ATs can offer fares comparable to or better than CTs today. At current $3.55 per mile fares, our model estimates that operator profits would rise from $0.27 to between $0.95 and $1.38 per mile respectively, subject to ATs' technological maturity. Alternatively, if fleet operators' profits did not increase, per mile fares would decline from $3.55 to between $1.42 and $2.24.
Second, while ATs should be competitive with CTs, they are unlikely to offer a financial proposition comparable to PVs. At high levels of technological maturity, AT fares remain—ceteris paribus—costlier than PV ownership ($1.42 versus $0.95 per mile). This effect persists even when we take account of generalized travel time costs. Consideration of these costs—which raises PV ownership costs to $1.40—improves the value proposition of ATs relative to PVs but fails to deliver cost parity.
Third, the lack of cost parity between ATs and PVs is influenced by previously overlooked factors—specifically capacity utilization and operator-envisioned profit expectations. Absent consideration of these factors, our model estimates that AT fares could be as low as $0.47 per mile, significantly lower than the cost of owning and operating PVs. However, our model estimates that the inclusion of the aforementioned factors, the most influential being capacity utilization, yields a minimum fare of $1.42.
Fourth, the impact that range reductions—potentially induced by pairing vehicle electrification and vehicle automation [23, 24]—have on AT fares, depends on whether these reductions prompt changes in occupied miles travelled. A 15% range reduction requires—ceteris paribus—that AT fare increase from the existing lower bound, $1.42, to at least $1.54 if the absolute number of miles covered by riders decreases proportionally. Conversely, no change in the absolute number of rider miles—which effectively increases the AT's utilization rate—produces fares as low as $1.31 6 .
Our financial results admittedly differ from past studies demonstrating cost competitiveness of ATs with PVs [12–14, 19]. The primary reason for this is that our model accounts for capacity utilization considerations and operator-envisioned profit expectations. Although the inclusion of these factors 'worsens' an AT's financial proposition, their consideration is timely and consistent with commercial fleet operator business practices [20, 21].
3.2. Energy assessment
Turning to the energy impact of ATs, we first consider instances in which AT fares are comparable to those offered by CTs today—a scenario our model predicts is plausible. Under this scenario, presuming demand for AT services parallels that associated with CTs, our model predicts net consumption and emissions reductions of up to 54.39% and 33.07% respectively, the precise figure depending on the magnitude of fleet overhaul (i.e. number of CTs that are replaced by ATs).
Predicting the environmental impact of ATs with fare reductions relative to the status quo is more challenging. On the one hand, our model predicts that fleet operators can—at high levels of technological maturity—offer lower fares and earn profits consistent with those realized today. However, these fares remain costlier than PV ownership.
At first glance, the inability of ATs to fiscally compete with PVs suggests that no change in energy demand/emissions is likely. Given the high(er) cost of using ATs versus PVs, drivers should choose the latter for mobility. Yet, recent research suggests that ATs offering fares lower than CTs but higher than PVs may cannibalize trips away from existing mobility options and induce greater demand [29]. Our model predicts AT fares within that range.
Cannibalization need not necessarily produce a negative environmental impact. Mobility mode switches from PVs to ATs may reduce consumption owing to the latter's improved energy efficiency [6–9]. However, consumption may increase if originally selected mobility modes are more fuel efficient [27, 29]. Further increases are likely owing to induced demand in the form of trips that would otherwise not exist absent the increased affordability of AT services.
We explore this scenario by leveraging pre-existing findings, applicable assumptions and data for our target market [5, 27, 29]. Our model yields four results.
First, demand stimulated by introducing low-cost AT services cannot be accommodated without increasing the size of the existing taxi fleet. Our model estimates that—assuming single ridership—up to 1.98% of demand (both existing and new) may be accommodated. However, maintaining the status quo fleet size of taxis decreases net energy consumption and emissions, owing to an AT's energy advantage over CTs.
Second, accommodating demand totality via AT fleet size increases may reduce the total number of vehicles needed to meet aggregate demand. This effect is attributed to higher daily mileage and by consequence, the number of trips ATs complete relative to PVs. Our model estimates that the magnitude of overall fleet size decreases realized via AT introduction depends on homogeneity in trip timing behavior (figures 3(a) and (b)).
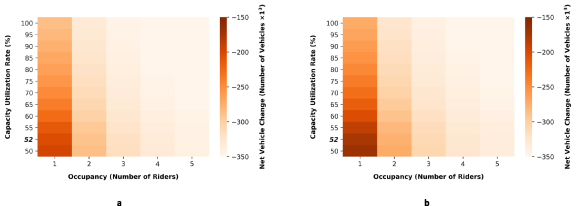
Figure 3. Net change in number of vehicles operational daily assuming AT fare advantage over CTs and complete demand accommodation. Lighter shades represent fewer operational vehicles. Heterogenous and homogenous trip timing scenarios are displayed separately (a) and (b).
Download figure:
Standard image High-resolution imageThird, accommodating aggregate demand using ATs produces a net increase in energy consumption and emissions. This increase is foremost driven by induced demand followed by mode switches from pooled PVs to ATs. The magnitude of the net increase in energy depends on trip timing behavior. Homogeneity in trip timing—such as morning and evening peaks during which a significant proportion of all daily journeys is completed—produces higher net increases in consumption (figures 4(a) and (b)) and emissions (figures 5(a) and (b)) respectively.
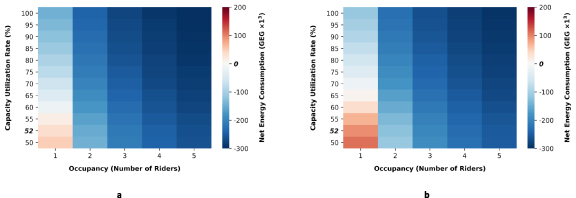
Figure 4. Net change in daily energy consumption assuming AT fare advantage over CTs and complete demand accommodation. Blue shades represent net zero (or more favorable) consumption impact. Heterogenous and homogenous trip timing scenarios are displayed separately (a) and (b).
Download figure:
Standard image High-resolution image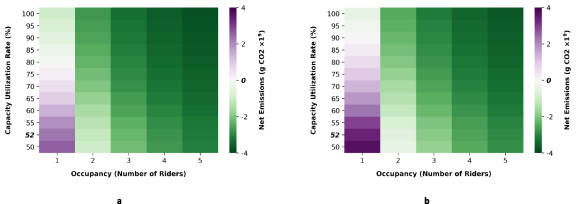
Figure 5. Net change in daily emissions assuming AT fare advantage over CTs and complete demand accommodation. Green shades represent net zero (or more favorable) emissions impact. Heterogenous and homogenous trip timing scenarios are displayed separately (a) and (b).
Download figure:
Standard image High-resolution imageFourth, increasing capacity utilization rates improves an AT's energy proposition. The magnitude of the increase required to achieve net zero consumption and emissions depends on trip timing behavior. Homogeneity in trip timing requires the achievement of higher utilization rates (66% and 91% for consumption and emissions respectively) compared to instances in which trip timing is uniformly spread through the day (57% and 79% for consumption and emissions respectively).
Collectively, our findings suggest that the confluence of vehicle electrification, vehicle automatization and vehicle sharing may—based on our financial assessment, profiled AT and specific market characteristics—be insufficient to achieve favorable energy outcomes, relative to the status quo.
3.3. Pathways towards net zero
Given the aforementioned results, how can the energy benefits of ATs be realized absent the energy costs associated with their use? In this section, we identify pathways for achieving this outcome and quantify the thresholds required for each of these pathways.
3.3.1. Pathway 1—technological improvements
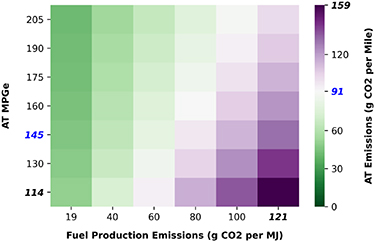
Achieving net zero consumption/emissions via ATs may be achieved via technological advances: specifically, a superior vehicle energy profile. Our model estimates that a favorable energy outcome requires—presuming homogeneity in trip timing behavior—a fuel economy of 145.32 MPGe and an emissions profile of between 91.14 CO2 grams per mile (figure 6). Realization of a higher fuel economy advantage, specifically 245 MPGe, precludes the need for improving an AT's emissions profile given interdependencies between fuel economy and emissions [27]. Existing literature suggests pairing vehicle electrification with automatization makes this outcome plausible [8, 28].
Figure 6. Requisite AT emissions profile assuming improvements in AT MPGe and fuel production emissions. Green shades represent conditions under which an AT emissions profile yields net zero (or more favorable) emissions impact for 52% capacity utilization and single occupancy. Blue text represents requisite fuel economy and emissions thresholds assuming homogeneity in trip timing behavior.
Download figure:
Standard image High-resolution image
Absent this advantage, a favorable energy outcome may be achieved via improvements in fuel economy, lifetime distance travelled and reductions in emissions from vehicle manufacturing and fuel production. Our model identifies improvements in fuel economy and emissions reductions from fuel production as most responsive to producing an energy profile that can, at achievable capacity utilization rates [32–34], produce a favorable energy outcome. Presuming the realization of a consumption advantage required to achieve net zero emissions, the requisite emissions profile may be achieved—ceteris paribus—by reducing emissions from fuel production from 121 CO2 grams per megajoule to 73 CO2 grams per megajoule 7 .
3.3.2. Pathway 2—behavioral improvements
Ride-pooling, the process whereby multiple fare-paying riders travelling to the same destination share the same vehicle, can significantly reduce per passenger energy consumption and emissions [35, 36]. This is as true for ATs (figures 4 and 5) as it is for CTs and PVs. But precisely how many riders are required per ride and what percentage of rides require pooling remains less clear. We address these questions here, given (a) ride-pooling's documented importance as a pathway towards energy savings, and (b) the perceived disutility associated with sharing rides [37–40].
Our model estimates that ATs must have an average rider occupancy of between 1.51 and 1.75—depending on homogeneity in trip timing—to achieve favorable energy outcomes. Assuming an AT is occupied by two riders (who would otherwise complete a trip separately), between 51.04% and 74.57% of trips must be pooled. This requirement—which is significantly higher than pooling rates observed today [41–43]—becomes less stringent if increases in capacity utilization rates and/or the number of fare paying riders per trip are realized.
3.3.3. Pathway 3—logistical improvements
Higher capacity utilization rates obfuscate the need for improving an AT's energy profile and/or ride-pooling. However, this process—traditionally achieved by travelling the same number of miles with more fare-paying passengers—is challenged by homogeneity in trip timing behavior. Most commuters travel during rush hours in the morning and the evening. This ultimately precludes capacity utilization maximization [32–34] and by consequence, this pathway's viability to address the energy challenges documented thus far.
An alternative strategy is to remove ATs from service during demand troughs. Our model estimates mileage reductions of between 33.79% and 42.72% are required—subject to homogeneity in trip timing—to achieve a favorable energy outcome. Fleet 'downtiming' admittedly runs counter to existing commercial business models [20, 21]. An asset not being used is traditionally viewed as one not generating earnings. However, such reasoning may be challenged by more deliberate (versus universal) deployment of AT fleets.
3.4. Uncertainty considerations and management
The energy predictions surmised thus far and the efficacy of the pathways proposed may be challenged given uncertainties endemic to any nascent technology. For example, while our hypothetical AT assumes an energy profile similar to existing electric vehicles, the reality could be different. Higher AT computing demands could increase energy consumption while drive cycle optimization may reduce it [6–9, 25]. Speed selection and conformance may also influence an AT's energy profile [8, 28]. Our estimates may hence under or overrepresent the true energy impact of ATs. We have addressed this critique by estimating the energy profile, ride-pooling requirements and smart deployment thresholds required of ATs to achieve a favorable energy outcome.
However, the precision of these figures are themselves determined by market specific attributes. For example, the energy profile of existing transportation alternatives (specifically CTs, PVs and PT), the frequency of their use following AT introduction, the magnitude of induced demand and homogeneity in trip timing behavior, all influence the thresholds for the aforementioned pathways. But to what extent? Our final analysis addresses this question (table 2).
Table 2. AT threshold requirement for net zero assuming a 5% change in specified parameters/market attributes. Directionality of changes to specified parameters/market attributes favor ATs (e.g. a 5% worsening of a PV's consumption and emissions profile reduces the requisite AT consumption and emissions profile by 4.49% and 4.36% respectively).
| Pathway 1: technological | Pathway 2: behavioral | Pathway 3: logistical | ||||
|---|---|---|---|---|---|---|
| Requisite energy profile | Requisite pooling threshold | Requisite mileage reduction | ||||
| Consumption | Emissions | Consumption | Emissions | Consumption | Emissions | |
| Original estimate | 145.32 | 91.14 | 27.47 | 74.57 | 21.55 | 42.72 |
| PV | −6.53 | 3.97 | −5.73 | −7.30 | −3.69 | −2.50 |
| −4.49 | 4.36 | −20.86 | −9.79 | −17.12 | −5.85 | |
| CT | −0.19 | 0.10 | −0.16 | −0.20 | −0.10 | −0.07 |
| −0.13 | 0.11 | −0.58 | −0.27 | −0.46 | −0.16 | |
| PT | −0.62 | 0.47 | −0.54 | −0.90 | −0.33 | −0.30 |
| −0.43 | 0.52 | −1.97 | −1.21 | −1.53 | −0.70 | |
| PV to AT | −2.14 | 1.30 | −1.88 | −2.44 | −1.17 | −0.82 |
| −1.48 | 1.42 | −6.84 | −3.27 | −5.43 | −1.92 | |
| Pooled | −0.52 | 0.35 | −0.45 | −0.67 | −0.28 | −0.22 |
| PV to AT | −0.36 | 0.39 | −1.64 | −0.90 | −1.30 | −0.51 |
| PT to AT | −0.44 | 0.17 | −0.39 | −0.33 | −0.24 | −0.11 |
| −0.30 | 0.19 | −1.42 | −0.44 | −1.11 | −0.26 | |
| Induced | −1.37 | 0.86 | −1.20 | −1.64 | −0.74 | −0.55 |
| Demand | −0.94 | 0.95 | −4.37 | −2.20 | −3.43 | −1.29 |
| Homogeneity in trip timing | −7.27 | 4.79 | −6.37 | −8.72 | −4.13 | −3.02 |
| −5.00 | 5.26 | −23.19 | −11.69 | −19.16 | −7.07 | |
For each input parameter, the upper line denotes the absolute change required to achieve net zero and the lower line, the relative change (%). Original estimate figures reflect 30% homogeneity in trip timing behavior.
Our model estimates that the stringency of proposed net zero pathways is influenced principally by homogeneity in trip timing and to a lesser extent, the energy profile of PVs currently servicing the market. The former reflects—presuming fluctuations in rider demand—an increase in the number of ATs required to meet this demand, which by consequence, necessitates more stringent technological, behavioral and logistical thresholds to ensure a favorable energy outcome. PVs' role in influencing threshold requirements reflects this mobility mode's dominance in meeting existing mobility needs. Consequently, changing the energy profile of this mode significantly influences the aforementioned requirements.
3.5. Public policy implications
Lessening light-duty vehicle emissions is timely given their contribution to climate change and societal morbidity [3, 4, 12]. However, practical and politically viable solutions entail recognition of the economic benefits linked to existing mobility on demand options [44]. Auto ownership in particular offers not only access to jobs, but also to educational opportunities, health care, food and recreation [45]. Consequently, addressing externalities linked to light-duty-vehicle use cannot—for reasons of economic mobility—impede upon their key offering: inexpensive, convenient point-to-point travel.
ATs have been seen as an optimal solution [30, 31]. The confluence of vehicle electrification, vehicle automation and vehicle sharing are viewed as a means of offering both cost-effective mobility on demand and reduced energy consumption and emissions [12, 24, 25]. Our results suggest otherwise. Firstly, we demonstrate that—contrary to previous work—widespread proliferation of ATs may be impeded by financial considerations (table 1). Secondly, we establish that even limited uptake of the technology may produce a net increase in energy consumption and emissions.
However, we document three pathways—conformance to an AT specific energy profile, ride-pooling and smart deployment—that would facilitate achieving a favorable energy outcome. We identify—for the first time to our knowledge—the numerical thresholds each of these pathways must meet; specifically showing what an AT's energy profile must be, how much ride-pooling is required and how many fewer miles ATs must traverse in order to lower energy consumption and emissions. We further demonstrate that these thresholds are principally influenced by homogeneity in trip timing and to a lesser extent, the energy profile of PVs currently servicing the market.
Changing PV energy profiles—with the aim of lowering AT specific technological, behavioral and logistical thresholds—is admittedly challenged by the relatively slow rate of PV fleet turnover [46]. Similar challenges do not, however, necessarily persist for influencing trip timing homogeneity. Remote work, staggered work schedules and leisure activity engagement during non-peak times could reduce AT threshold requirements via more heterogenous trip timing distribution. However, we acknowledge that a significant and sustained shift towards working from home in particular, could have impacts elsewhere in the energy system, such as those related to preferred modes of transport and demand for office space [47].
4. Limitations and conclusion
Our analysis has limitations. It uses data from one city and would benefit from analysis of other markets. Doing so may yield different financial and/or environmental propositions for ATs owing to market specific attributes (e.g. licensing, existing fleet powertrain composition/improvements and grid energy mix variations) [27, 48, 49]. For example, AT deployment in markets characterized by higher public transit use may increase the stringency of environmental design attributes and capacity utilization rates required to achieve net zero consumption/emissions, whereas deployment in 'dirtier' markets would ease this requirement. We have labored to address this critique via elasticity testing.
Our work also does not consider energy demands associated with vehicle-to-vehicle communication, vehicle-to-infrastructure interactions or synergies with data centers. These attributes may alter the energy impact of AT deployment and warrant further scrutiny. This is also true for congestion-related considerations as marginal changes in road use may increase or decrease overall consumption and emissions levels [49]. Further work should also examine the energy impact of shifts from active mobility options to ATs [29, 50].
Behavioral aspects of AT use also warrant scrutiny. Our model relies on AT per mile fare estimates rather than aggregated trip cost, the latter normally associated with PV ownership. Consumer sensitivity to this difference may alter demand via reductions in trip frequency and/or vehicle miles traveled [6]. Tradeoffs between AT-related productivity gains, PV-related option value—the value derived from car ownership—and its subsequent impact also warrant scrutiny as do consumer attitudes towards AT use.
Limitations notwithstanding, the robustness of our effects leads us to several conclusions. First, ATs can financially compete with CTs. Our model estimates that CT-to-AT substitution represents a viable pathway towards addressing technical inefficiencies and public health concerns surrounding gasoline use. Second, we document that the inability of ATs to achieve cost parity with PVs may not preclude the realization of negative energy externalities. Third, we show that the magnitude of these outcomes depends on key interactions and dependencies between supply-demand matching inefficiencies and homogeneity in trip timing behavior. Finally, we document specific pathways and the requisite thresholds required to reduce energy consumption and emissions.
Leveraging these pathways is—we believe—key to fostering greater environmental stewardship absent impediments in economic mobility.
Acknowledgments
This work was supported by The Alfred P Sloan Foundation (Award #2020-14048) and the National Science Foundation via its program on the Future of Work at the Human-Technology Frontier (Award #1928616, FW-HTF-P: Impact of AI Robotics on Labor). The findings and conclusions expressed are solely those of the authors and do not represent the views of the funding organization.
Data availability statement
All data that support the findings of this study are included within the article (and any supplementary files).
Footnotes
- 5
- 6
This figure assumes profit expectations are aligned with existing per-mile estimates. Realignment with existing annualized profit expectations produces a fare range of between $1.39 and $1.64.
- 7
Heterogenous trip timing behavior requires—for net zero energy outcomes—a consumption and emissions profile of 125.73 MPGe and 105.34 CO2 grams per mile respectively. A fuel economy of 200.05 MPGe precludes the need for AT emissions improvements. Absent this outcome, net zero emission may be realized by reducing emissions from fuel production from 121 CO2 grams per megajoule to 77.84 CO2 grams per megajoule.