

Abstract
To explore electrification as a climate change mitigation strategy, we study US residential heat pump adoption, given the current US housing stock. Our research asks (a) how the costs and benefits of heat pump adoption evolve with increased penetration, (b) what rate of heat pump adoption is economic given today's housing stock, electric grid, energy prices, and heat pump technology, and (c) what effect changing policies, innovations, and technology improvements might have on heat pump adoption. We answer these research questions by simulating the energy consumption of 400 representative single-family houses in each of 55 US cities both before and after heat pump adoption. We use energy prices, CO2 emissions, health damages from criteria air pollutants, and changes in peak electricity demand to quantify the costs and benefits of each house's heat pump retrofit. The results show that 32% of US houses would benefit economically from installing a heat pump, and 70% of US houses could reduce emissions damages by installing a heat pump. We show that the potential for heat pump adoption varies depending on electric grid, climate, baseline heating fuel, and housing characteristics. Based on these results we identify strategic, technology, and policy insights to stimulate high heat pump adoption rates and deep electrification of the US residential heating sector, which reduces CO2 emissions and the impacts of climate change.
Export citation and abstract BibTeX RIS

Original content from this work may be used under the terms of the Creative Commons Attribution 4.0 license. Any further distribution of this work must maintain attribution to the author(s) and the title of the work, journal citation and DOI.
1. Introduction
To avoid the worst effects of climate change, the global economy continues to seek opportunities to reduce greenhouse gas emissions. One of those opportunities is electrification, where energy-consuming activities switch from using fossil fuels to clean electricity. In the residential sector, the main avenue for electrification is to replace existing oil, natural gas, propane heaters, or inefficient resistive electric heaters with heat pumps, which displaces in situ fossil fuel consumption with electricity use. Such a switch has the potential to reduce greenhouse gas or other pollutant emissions, provided that—over the lifetime of the device—the electricity used to energize it is clean enough to have lower emissions than would have occurred from the direct combustion of fossil fuels.
Heat pumps are reversible air conditioners. In the summer, they act as air conditioners. In the winter, they reverse the flow of the refrigerant to absorb heat from the outdoors and release it inside the building. Electricity is used to do the mechanical work to move heat rather than produce it. The ratio of the quantity of heat that is ultimately delivered to the heated space to the amount of energy that is supplied as electricity is typically much greater than one. Even after accounting for the fact that electricity generation through the combustion of coal or natural gas is less efficient than burning natural gas in a home furnace, the switch to a heat pump usually reduces a building's net greenhouse gas emissions. As such, many studies have explored to what degree 100% heat pump adoption would reduce net greenhouse gas emissions in many parts of the world [1].
Residential heat pump adoption, however, has consequences beyond reducing greenhouse gas emissions. It can increase health damages caused by criteria air pollutants. Although residential furnaces and boilers often produce greater net greenhouse gas emissions than heat pumps do, they often produce fewer health-damaging pollutants like SO2, NOx , and PM2.5 than are produced when the same amount of heat is delivered by generating electricity and using it to energize a heat pump [2]. Heat pump adoption can make it harder to operate the electric grid, because large-scale heat pump adoption can significantly increase peak electricity demand [3]. And its private costs can outweigh its public benefits, because heat pumps are more expensive to install than furnaces or boilers and electricity is often more expensive than fuels like natural gas [4]. Given these consequences, this study examines the private and public tradeoffs of heat pump adoption, and assesses how these trade-offs change as heat pump adoption increases, heat pumps get cheaper, and the electricity grid gets cleaner.
The literature examines the effects of heat pump adoption using a variety of energy modeling frameworks. These frameworks typically involve simulating the energy consumption of a house before and after heat pump adoption. By projecting energy prices and emissions estimates onto those energy consumption profiles, a study estimates the costs and/or emissions of the house both before and after heat pump adoption. Although this general strategy is appropriate, the literature exhibits a variety of shortcomings that reduce the method's usefulness as a decision-making guide.
Many studies, for example, fail to examine the tradeoffs between economics, peak electricity demand, health damages, and greenhouse gas emissions or to show how those tradeoffs impact the potential for heat pump adoption. Hanova and Dowlatabadi estimate the sensitivity of CO2 emissions reductions from switching to ground source heat pumps to the CO2 intensity of electricity generation, energy costs, and heat pump efficiency [5]. The New York State Energy Research and Development Authority finds that residential customers would generally see no benefit from switching to electric heat pumps but the switch would reduce CO2 emissions and generate value for the utility by shifting demand away from the summer peak [6]. Neither study considers the effect on emissions of other pollutants. Waite and Modi assess the effect of (partial) heating electrification on electricity system peak demand, but do not consider any of the environmental impacts [3]. Kaufman et al find that, given a combination of technological improvements and climate policy, heat pumps could be cost-competitive relative to gas furnaces in a variety of US climates [7]. Some research explores aspects of these tradeoffs but omit heat pump capital cost [1, 8], changes in peak electricity demand [9], and/or monetized damages of criteria air pollutants [1, 8, 10, 11]. Without a full accounting of these tradeoffs, it is difficult to analyze the pros and cons of different heat pump adoption rates, so most studies ignore this discussion by analyzing the impacts of 100% heat pump adoption alone [1, 10, 12].
Another shortcoming is the failure to simulate houses and electric grid emissions at an hourly resolution. Many studies simulate household energy consumption at annual [13] or seasonal [9] time scales. Likewise, many studies use annualized or averaged factors to quantify electric grid emissions [1]. Without using an hourly resolution, these studies cannot accurately capture the daily and seasonal variation in heating demand, heat pump performance, electric grid emissions, or peak electricity demand that impact the tradeoffs of heat pump adoption.
Most previous analyses also assume a static grid: their analysis of benefits and costs is valid only for the electric grid as it is at the time of analysis. In fact, the US electric grid has got [14], and—if current policy proposals are successful [15]—will continue to get substantially cleaner over the lifetime of a heat pump installed today. In this analysis, we account for a rapid cleanup of the electric grid. Consistent with the 'Progressive' scenario of the Electric Power Research Institute's (EPRI's) 2018 National Electrification Assessment study, we assume that electric grid CO2 emissions and health damages decline by 45% and 75% between 2017 and 2032 [16]; that damages from CO2 emissions are valued at $40 per ton [17]; that heat pump cost and performance is static. We also account for methane leakage from the natural gas production, transmission, and distribution, which affects both residential furnaces and gas-burning power plants.
The literature also inadequately captures the diversity in housing stock, electric grid regions, and climates. Many studies analyze heat pump adoption by simulating single building types [2, 13, 18, 19] or a handful of building archetypes [10] that cannot adequately capture the variety of buildings in the residential housing stock. Although other studies use probabilistic methods to generate hundreds or thousands of building simulations to more thoroughly capture the housing stock diversity, they focus on individual electric grids and climates [1, 8]. Without simulating a diversity of houses, electric grid regions, and climates via the same modeling method, these studies do not adequately explore the variety of situations that make heat pump adoption so nuanced.
Because of these shortcomings, the literature does not fully explore the implications of heat pump adoption. It does not balance the economic, electric grid, health, and climate tradeoffs of heat pump adoption, nor does it consider the full cost and benefits of high rates of heat pump adoption.
In this study, we address the gaps described above. We account for the heterogeneity in the nation's current housing stock, and for how that heterogeneity interacts with differences in regional electricity grids and climate. We account for both, the capital and operating costs, of retrofitting heat pumps to today's houses. We also assess health damages, damages from greenhouse gas emissions, and the effect on peak electricity demand. We assess how the benefits and costs of heat pump adoption change as heat pump penetration increases (i.e. we do not assume 100% penetration). Our analysis also recognizes that, absent policy, adoption rates will likely be driven by private benefits to the adopters. We account for the fact that the grid will evolve over the lifetimes of heat pumps installed today. Finally, we perform a sensitivity analysis to assess the effect of climate policy (e.g. a carbon tax) and an accelerated reduction in grid emissions intensity. To do so, we examine the economic, emissions, and peak demand tradeoffs of heat pump adoption for 400 locally-representative houses in each of 55 cities to ask how the costs and benefits of heat pump adoption evolve with increased penetration. We ask what rate of heat pump adoption is economic, given today's housing stock, electric grid, energy prices, and heat pump technology, assuming that homeowners minimize their costs. And we explore what policies, innovations, and technology improvements can be used to increase heat pump adoption.
By answering these questions, this analysis fills a research gap that fails to understand the full implications of high rates of heat pump adoption. Filling that research gap advances our understanding of the potential for heat pump adoption and the challenges that inhibit higher adoption rates. It helps identify where to focus current efforts to encourage heat pump adoption: both in terms of geographical location and building characteristics. It also helps us develop projections of how new policies and innovations might change the balance of benefits and costs of heating electrification.
2. Method
To quantify the cost and benefit of heat pump adoption across the continental United States, we follow a five-step method.
In step 1, we simulate residential energy consumption. We use NREL's ResStock tool to create a virtual stock of 400 houses for each of 55 cities. We simulate the energy consumption of those houses using the EnergyPlus building simulation software. The result is 22 000 simulated, annual, 8760 h, household-level profiles of natural gas, fuel oil, propane, and electricity consumption.
In step 2, we use publicly available data to quantify those consumption profiles' energy cost, health damages, and CO2 emissions. We multiply electricity consumption by marginal CO2 emissions, marginal health damages factors, and state-level electricity prices. We multiply household fuel combustion by CO2 emissions rates, seasonal health damage factors, and state-level annual average fuel prices. The results show the annual energy cost, annual CO2 emissions, and annual health damages associated with each of the 22 000 household energy profiles.
In step 3, we calculate the private and public net present value (NPV) that results from each household adopting a heat pump. For each simulated house, we replace the existing heating technology with an air-source heat pump. The EnergyPlus model, which underpins ResStock analysis, automatically sizes the heat pump. We choose the operating characteristics of the heat pump (HSPF/SEER) as described in the section above. Then we re-simulate the house's energy profiles and re-calculate their costs, health damages, and emissions. For each house, the private NPV of heat pump adoption equals the energy cost savings minus the amortized cost of the heat pump installation. For each house, the public NPV of heat pump adoption equals the baseline climate damages and health damages minus the heat pump climate damages and health damages.
In step 4, we quantify the percentage of the housing stock that would benefit from heat pump adoption. From a strictly private cost perspective, this includes all houses for which heat pump adoption yields a positive private NPV. From a public perspective, we also include any house whose positive public NPV outweighs its negative private NPV—i.e. where a net positive (private + public) NPV could be achieved by incentivizing heat pump adoption via a subsidy.
In step 5, we use the houses' hourly electricity profiles to quantify the impact of heat pump adoption on peak electricity demand. For each of the 55 cities, we use the electricity profiles from step 1 to calculate the aggregate electricity demand of the 400 baseline houses. Then, we perform the same calculation using updated electricity profiles for any houses identified in step 4 as heat pump adopters. By comparing the aggregate baseline electricity consumption profile with the aggregate profile that includes heat pump adopters, we can quantify how heat pump adoption changes the residential electricity profile for each city, including how heat pump adoption changes peak residential electricity demand.
Following these five steps, we combine a validated residential building energy simulation tool, publicly-available data on cost, health damages, and CO2 emissions, and economic calculations to identify houses across the continental US where heat pump adoption reduces economic cost and monetized environmental harm. The sections below provide additional details about the different components of this method.
2.1. Building energy simulation
We simulate the energy consumption of 400 houses in each of 55 cities using ResStock [20]. ResStock is a database of housing characteristics. It describes those housing characteristics using probability distributions that depend on the house's location, square footage, vintage, and other attributes. This approach allows ResStock to probabilistically generate a virtual stock of hundreds of houses whose distribution of vintage, square footage, attic insulation, air infiltration, HVAC efficiency, window quality, and other characteristics accurately portray the quality of the actual housing stock.
We then feed these ResStock housing models into the EnergyPlus building energy modeling program. EnergyPlus uses a house's construction characteristics and weather data to size the house's air conditioner/furnace/heat pump and calculate its hourly annual operation schedule/energy consumption profile.
Other academic studies have used similar methods. Protopapadaki et al [8] and Asaee et al [12], for example, use probabilistic methods to generate a large sample of virtual houses to feed into a building energy simulation tool. Some studies also use the ResStock tool itself [1].
To reduce the computational expense of simulating such a large number of houses, we took two steps to minimize the number of houses we needed to simulate for each city. We based our analysis on simulation results from NREL, where 80 000 houses are simulated in ResStock and each house's efficiency characteristics and annual energy consumption for heating, cooling, and other end uses are reported. First, we reduced the model's degrees of freedom. We used regression analysis to identify characteristics that had little impact on annual heating or cooling needs. For these characteristics—e.g. dishwasher efficiency, clothes washer efficiency—we gave all houses the same value. We also removed rare characteristics—e.g. triple pane windows, which occur in an extremely small subset of houses.
Second, we used these updated characteristics to simulate 1000 houses for Pittsburgh, Dallas, and San Francisco and compared those houses' annual heating requirements against the 4500 houses provided in the NREL dataset for each of those cities. By randomly sampling subsets of those 1000 simulated houses, we estimated the r-squared fit between the cumulative density functions of annual heating and cooling demand between the NREL simulations and our simulations. See the SI for results of these comparisons (available online at stacks.iop.org/ERL/16/084024/mmedia). We concluded that by simulating 400 houses, we could expect to capture 88%–96% of the variation in annual heating demand that would be captured by a model that uses 4500 houses. We determined that decreasing the number of simulations, to 300 for example, would notably decrease this fit, and that increasing the number of simulations, to 500 for example, would increase computational expense without greatly improving fit. For more detail, see the SI.
To quantify the energy impacts of heat pump adoption, we simulated each of the 22 000 houses with both their baseline HVAC technology and with a heat pump retrofit. We retrofit each house with a 8.5 HSPF, 14.3 SEER air-source heat pump based on Department of Energy efficiency standards [21]. The energy efficiency of a heat pump changes with ambient temperature, where lower temperatures yield lower heat pump efficiency. The EnergyPlus tool uses ambient weather files with hourly historical normal temperatures. When the heating load exceeds heat pump capacity, which may occur at low ambient temperatures where heat pump performance is lower, the EnergyPlus tool assumes that that the heat pump operates as a resistive heater (i.e. with a COP of 1).
2.2. Cities simulated
We simulate the housing stock of 55 cities across the continental US. We assumed that climate and electric grid emissions would be significant indicators of the value of heat pump adoption. Thus, we chose cities to represent a variety of climates and electric grid regions. Climate regions are defined using data from the US Office of Energy Efficiency and Renewable Energy's Building America project [22]. Electric grid regions are defined as the sub-regions used by the North American Electric Reliability Corporation (NERC) [23].
To choose the cities, we started by simulating one city for each combination of climate region and electric grid region. We then added additional cities to better represent (a) areas with large populations and housing stocks and (b) climate/electric regions with large geographic boundaries. Using these guidelines, we chose to simulate the housing stock of the 55 cities shown in figure 1.
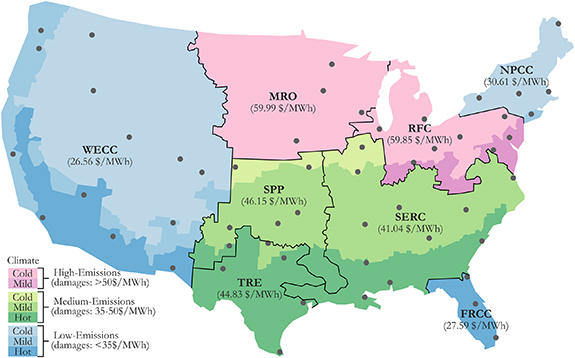
Figure 1. The 55 grey circles represent cities that are simulated in our model. Cities were chosen to represent a variety of electric grid regions as defined by [23] and a variety of climate regions as defined by [22] within each electric grid region. The black lines and text show each NERC region's boundary, name, and average climate + health damages intensity (in $/MWh).
Download figure:
Standard image High-resolution imageTo represent all of the 80 million single-family homes in the US residential sector, we scale up the simulated housing stock: we scale each city's 400 simulated houses up to represent the total number of houses in the city's nearby regions, as defined by data from the NREL ResStock program. In large, densely populated regions like San Francisco, Boston, and Los Angeles, each simulated house is scaled up to represent about 10 000 real world houses. In smaller, sparsely populated regions like Goodland, KS, Caribou, ME, and Midland, TX, each simulated house is scaled up to represent about 500 houses. On average, each simulated city represents 1.45 million houses, and each house is scaled up to represent 3600 houses.
2.3. Climate and health damages
We calculate emissions and the associated climate and health damages both for fossil fuel combustion within each city and for electricity consumption within each electric grid region.
For each electric grid region, we use marginal emissions and health damages factors that vary by season and hour-of-day. These factors are compiled using methods developed by Siler-Evans et al [24] and are reported by the Carnegie Mellon Center for Climate and Energy Decision Making (CEDM) [25]. For CO2 emissions, the factors are reported in units of kilogram-CO2/MWh of electricity consumption. To monetize those climate damages, we multiply those factors by a social cost of carbon of 40 $/tCO2. For health damages, the emissions of SO2, NOx , and PM2.5 are monetized using methods developed by Heo et al [26] and reported in units of $/MWh of electricity consumption. By multiplying each house's hourly electricity consumption by its electric grid's seasonal/hourly climate and health damages, we can calculate the annual electric grid emissions damages caused by each house.
To account for the natural gas infrastructure's leakage of the greenhouse gas methane, we estimate the amount of methane leaked per MWh of electricity generation in each NERC region and convert to CO2-equivalent emissions via the global warming potential (GWP) of methane. For example, we find that in 2017, the states comprising the western region (WECC) of the US electric grid consumed 1.45 million MMcf of natural gas in the power sector [27]. We assume that for every MMcf of consumed natural gas, 0.023 MMcf of methane is leaked into the atmosphere [28]. By multiplying that leakage rate by the 1.45 million MMcf of consumed natural gas, converting to tonnes, and multiplying by a GWP of 28 [29], we estimate that the 2017 WECC power sector contributed to methane leakage amounting to 18.6 Mt CO2-equivalent. By dividing this 18.6 Mt by the 724 TWh of the WECC states' generated electricity [27], we calculate a methane leakage rate factor of 25.7 kg MWh−1. In the same manner, we calculate the methane leakage rate factors for the other NERC regions. We use the 100 years GWP value of 28 for methane. Although there have been proposals to use 20 years GWP values, recent research shows that the benefits of this alternative 20 years time from are overstated [30].
In this study, we refer to different electric grid regions as having low-, medium-, or high-emissions relative to other sub-regions of the US electric grid. We base those distinctions by calculating the average damages. As described above, we calculate damages assuming an SCC of $40 per ton CO2 [17] and, for PM2.5, NOX , and SO2, using methods developed by Siler-Evans et al [24] and reported by CEDM [25] in each region and categorizing them as follows—<35 $/MWh = low; 35–50 $/MWh = medium; >50 $/MWh = high. For more detail, see figure 1.
Since the lifetime of a heat pump is 15 years [31, 32], we assume that emissions will diminish in all US electric grids during the life of the heat pump. To capture this effect, we use electric grid emissions projections from EPRI's National Electrification Assessment [16]. We use that study's 'Progressive' scenario (a balance between the study's 'Conservative' and 'Transformative' scenarios) to assume that from 2017 to 2032, (a) coal energy will decline by 75% from 1200 TWh to 300 TWh and (b) CO2 emissions intensity will decline by 45% from 850 lbs MWh−1 to 450 lbs MWh−1. We assume that the majority of health damages from coal energy [33]. Thus, we assume for each grid region that health damages will decline by 75% and CO2 emissions by 45% by 2032. We assume a linear trend.
For heating fuel combustion, we calculate the CO2, SO2, NOx , and PM2.5 emissions generated by different heating technologies and monetize those emissions using city-specific damage factors. We use data from the Environmental Protection Agency [34] to quantify the CO2 emissions for each heating fuel. To quantify the NOx , and PM2.5 emissions for each heating fuel, we use data from Brookhaven National Laboratory [35]. We apply stoichiometric calculations, assuming 3% O2 in the exhaust, to calculate the kilogram of emissions per mmBtu fuel for gas and fuel oil heaters at various energy efficiency ratings. By setting a trendline to these data, we develop a linear model of NOx and PM2.5 emissions depending on the existing furnace's heating fuel and energy efficiency. We assume that propane and natural gas have similar emissions characteristics. These calculations are similar to the NOx and PM2.5 emissions estimation method used by Vaishnav et al [2]. For SO2 emissions, we use data from [36] and assume a 0.0015% sulfur content in fuel oil [37]. Using these calculations, we develop a series of models for calculating the kg/mmBtu of CO2, SO2, NOx , and PM2.5 emissions generated by each of the different existing heating technologies present in the ResStock houses.
To account for the natural gas infrastructure's leakage of the greenhouse gas methane, we estimate the amount of methane leaked per therm of natural gas consumed for heating and convert to CO2-equivalent emissions via the GWP of methane. We assume that for every therm of natural gas consumed for heating, 0.023 therms of methane escape to the atmosphere [28]. Using the energy density of natural gas, we convert from therms to kilograms and multiply by 28—the GWP of methane [29]—to calculate a rate of 1.27 kg CO2-equivalent per therm of consumed natural gas.
To monetize the SO2, NOx , and PM2.5 health damages, we use the EASIUR health damages model. EASIUR is a reduced-complexity model that uses regression analysis to approximate the results of a more sophisticated chemical transport model, CAMx. Using the EAISUR online tool, we input each city's geographic coordinates to retrieve monetized health damages for each of the three pollutants reported in units of $/kg. These data are provided in 24 h profiles for three seasons. By projecting those damages profiles on the seasonal, hourly energy consumption of each of these fuels for each ResStock house, we estimate the cost of health damages created by fuel combustion. Note that damages can vary significantly by city, and that regions with lower populations and with weather patterns that quickly disperse and dilute pollutant concentrations, the health damages of these emissions will be generally lower, because fewer people will be exposed to the pollutants compared to a higher-population city with different weather patterns. To monetize CO2 emissions, we assume a social cost of carbon of 40 $/tCO2.
In the sensitivity analysis of this study, we adjust the health and climate damages factors for the electric grid as well as the social cost of carbon to see how they impact the public NPV of heat pump adoption. For the electric grid, we assume that climate and health damages decrease at the same rate. If electric grid CO2 emissions fall by 50% from the baseline, for example, we assume that electric grid health damages also fall by 50%. Thus, by decreasing electric grid emissions and increasing the social cost of carbon, for example, the public NPV of heat pump adoption will tend to increase. Then, for any houses where positive public NPV outweighs the negative private NPV, we assume that house will adopt a heat pump when given a subsidy to bring its private NPV to zero.
2.4. Economics
We use the NPV metric to quantify the overall positive or negative change in energy cost, climate damages, health damages, and capital costs. We calculate the NPV of heat pump adoption both from a private and public perspective, as shown in equations (1) and (2).
where Cenergy is the annual cost of the house's electricity, gas, fuel oil, or propane use, Chealth is the annual health damages caused by criteria air pollutants related to the house's energy consumption, Cclimate is the annual climate damages caused by CO2 emissions related to the house's energy consumption, and Kheatpump is the net capital cost of replacing the house's existing heater with a heat pump. In addition, i equals the interest rate and n equals the number of years over which the NPV is calculated. We use i = 7% and n = 15 years to represent the lifetime of a heat pump and the interest rate that could be achieved by investing that capital elsewhere. Other heat pump studies use the same NPV calculation with similar interest rate and lifetime values [2, 10].
Energy costs are calculated by multiplying each house's annual consumption of natural gas, fuel oil, propane, and or electricity by an energy price. Energy prices are annual average retail values as published by the US Energy Information Administration [38] and are different for each fuel and for each US state. We assume that these base fuel prices persist throughout the study period, although the prices seen by consumers may rise based on the carbon prices assumed in some scenarios. Our assumption of historical annual- and state-average prices is a limitation of the analysis. However, given the potentially enormous uncertainty in future energy prices [39], this simplifying assumption makes it easier to delineate the effects of housing stock, electricity generation mix, tax policy, and technology improvements. Health and climate damages are calculated using the method described in section 2.3.
The net heat pump capital cost, Kheatpump, is calculated as shown in equation (3).

where Cheatpump is the cost to purchase and install he heat pump, Cductwork is the cost to install ductwork, Creplacement is the cost of replacing the existing heater with a similar technology. Thus, the net heat pump cost, Kheatpump, is the extra cost of replacing a house's existing heater with a heat pump instead of replacing it with a similar technology. That is, we assume that homeowners are most likely to buy a heat pump whenever their existing heater is nearing the end of its life and will need to be replaced with either a new, similar heater or with a new heat pump system.
Heat pump capital costs and existing heater replacement costs come from the National Residential Efficiency Measures Database [40]. Ductwork cost data come from a compilation of cost surveys provided by [41]. We assume that each of these costs varies depending on the existing house's characteristics.
We calculate heat pump installation cost using a coefficient of 143.30 $/kW of capacity in all cases plus a fixed cost that varies from $3300 to $4800. For houses with existing central air conditioning systems, we assume a $3300 fixed cost, which is the average value reported to replace an existing heat pump system with a new heat pump system. For houses with existing furnaces and baseboards but no centralized air conditioning system, we assume a fixed cost of $3700, which is the average value reported for installing a heat pump system from scratch. For houses with existing boilers, we account for the extra labor of removing the hydronic radiator equipment and assume a fixed cost of $4800, which is the highest value reported for installing a heat pump system from scratch.
We calculate ductwork costs as $0 for houses that already have central ducted systems. Otherwise, we use a fixed cost that depends on the area of the house. The ResStock model has four distinct bins for house area. We use costs of $1500 for houses with an area less than 1500 square feet, $3000 for houses with an area between 1500 and 2500 square feet, $4500 for houses with an area between 2500 and 3500 square feet, and $6000 for houses with an area greater than 3500 square feet.
We calculate the replacement cost of replacing the existing heater with a similar technology using a linear equation, Creplacement = a + bx, where x is the kW capacity of the existing heater. The equation depends on the baseline fuel [40]. For gas heaters, we use 2500 + 13.3x. For fuel oil heaters, we use 4100 + 13.3x. For propane heaters, we use 3800 + 13.3x. And for electric resistance heaters, we use 1600 + 170.6x.
2.5. Peak demand calculations
We calculate the change in peak demand as a function of the heat pump adoption rate for each city using four steps. First, we calculate the private NPV for each house when it adopts a heat pump. Second, we sort the houses in order of increasing private NPV. Third, we aggregate the electricity consumption profiles of the houses to match the heat pump adoption rate of interest. For example, in a sample of 400 houses, the electricity demand for a 30% heat pump adoption rate would be the electricity demand of the 120 houses with the highest private NPV having installed a heat pump plus the electricity demand of the other 280 houses keeping their baseline heating technology. Fourth, we calculate the 99th percentile value of the resulting aggregated electricity profile. We choose the 99th percentile to provide for some leeway given that many transformers and other distribution grid electronics can exceed their rated capacities for a small number of hours per year.
By comparing the peak electricity demand before heat pump adoption with the peak electricity demand after heat pump adoption, we can calculate the percent change in peak demand for different heat pump adoption rates.
Our analysis of peak demand assumes that supplemental heat is provided by resistance heating (i.e. a heat pump operating with a COP of 1). Clearly, peak demand might be reduced (and the private economics of heat pumps might be improved) if supplemental heat were provided by natural gas [3]. However, the use of natural gas for backup heat is antithetical to the goal of decarbonization through electrification. As a practical matter, Waite and Modi [3]conclude that with dual source heat pumps, only 1% and 2% of heating energy may need to be supplied by natural gas. However, it is unclear whether the natural gas distribution network would be economically viable at such low utilizations.
Although some data exists to help quantify the cost—e.g. in $/kW—of firming the grid to accommodate peak demand, we chose to avoid monetizing peak demand increases. There are many distribution networks and electric grids that have excess transmission and distribution capacity. In these cities, increased electricity demand may be beneficial because it increases the utilization rate of existing transmission and distribution infrastructure, and higher peak demands can be easily accommodated by the extra line capacity. Rather than attempt to quantify the reserve capacity of the transmission and distribution networks of each city, we report the changes in peak demand only, and leave the evaluation and monetization of that information to experts of each city's particular situation.
3. Results
3.1. Private economic benefit supports a tripling of US heat pump adoption from 11% to 32% of single-family houses
We find that 16.7 million houses—or 21% of the US single-family residential stock—could benefit today economically from replacing their existing heater with a heat pump. Add to this the 8.7 million houses that already have heat pumps, and the US heat pump adoption rate could increase to 32% total based on private economic benefits alone.
The private economic benefit to these 16.7 million houses amounts to $7.1 billion annually, as shown in figure 2. That private benefit includes $12.0 billion in annual energy savings minus the amortized retrofit cost of the heat pump technology. The public benefit of that heat pump adoption amounts to $0.6 billion in avoided health damages and $1.7 billion in avoided climate damages annually. Residential annual CO2 emissions fall by 8.3% from 506 Mt to 464 Mt.
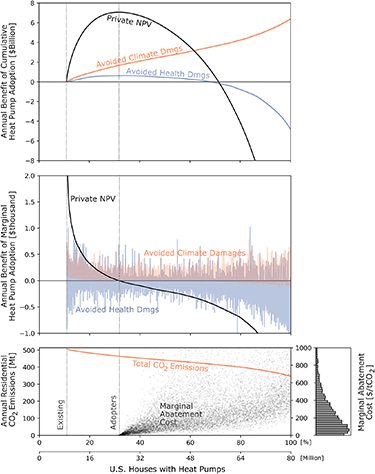
Figure 2. The existing heat pump adoption rate is 11% of current US single-family homes. The private NPV, calculated assuming annual- and state-average electricity and gas prices, of heat pump adoption is positive for an additional 21% of US houses. The health benefits of heat pump adoption vary significantly. Climate benefits mostly increase with heat pump adoption: only in 1.7 million houses (2.1% of the US housing stock) does heat pump adoption increase CO2 emissions. Yet, abatement costs can be high: although 22.4 million houses (28% of the US housing stock) have abatement costs between 0 and 200 $/tCO2, there are 5.1 million houses (6% of the US housing stock) with an abatement cost exceeding 1000 $/tCO2. These estimates are based on historical grid operations and assumptions that—over the heat pump's 15 years life—electric grid CO2 emissions decrease by 45% and health damages decrease by 75%. Private and social costs would fall if the grid gets cleaner faster than assumed in our analysis or for heat pumps installed in the future.
Download figure:
Standard image High-resolution imageMild climates (mixed and coastal) have the greatest potential for heat pump adoption, as shown in figure 3. In these climates, winter temperatures are mild enough to support efficient heat pump performance, and summers are hot enough to yield significant benefits from a heat pump's high-efficiency air conditioning. Homes in cold climates, on the other hand, derive the smallest benefits from heat pump adoption.

Figure 3. Heat pump adoption, subsidy potential, and public detriment vary by electric grid region and climate temperature. See figure 1 for a map showing the various electric grid regions and climate regions.
Download figure:
Standard image High-resolution image3.2. Complete heat pump adoption reduces CO2 by 160 Mt at a $25.2 billion net annual cost
As heat pump penetration exceeds 60%, cumulative climate damages continue to fall while cumulative private costs and health damages skyrocket. If all single-family homes adopted heat pumps, that would reduce residential CO2 emissions to 346 Mt—a reduction of 160 Mt or 32%, which amounts to $6.4 billion in annual climate benefits. Although this climate benefit is substantial, it comes at a significant cost: $4.9 billion in health damages and $26.7 billion in private economic costs. Using those numbers, the cumulative, annual value of 100% heat pump adoption in the continental US is negative $25.2 billion, not including the cost to build out the electricity distribution infrastructure to accommodate increased peak electricity demand.
Moreover, heat pump adoption increases CO2 emissions for 2.1% of US houses and incurs abatement costs of greater than 1000 $/tCO2 for 6% of US houses. Based on these numbers, very high rates of heat pump adoption may be difficult to justify.
3.3. Private and public outcomes are generally aligned
Given the current electric grid, technology, and energy prices, whenever a US house replaces its existing heater with a heat pump because of the private economic benefits, that heat pump adoption usually benefits public health and climate as well. See the blue, unshaded portions of figure 3.
There are many cases where heat pump adoption leads to public harm—i.e. where the public NPV of heat pump adoption is negative. But most of these cases align with houses that are heat pump averse—i.e. houses where the private NPV of heat pump adoption is negative and heat pump adoption is presumably unlikely. See the red, shaded portions of figure 3.
However, there are instances where heat pump adoption creates a private economic benefit but a public detriment. See the blue, shaded portions of figures 3 and 4. This misalignment of private and public outcomes occurs almost exclusively for houses that currently heat with propane. The effect is concentrated in the higher-emitting electric grid regions, and in the colder parts of the medium-emitting grid regions. Propane is relatively clean but expensive. It usually makes private economic sense to replace a propane heater with a heat pump. But in colder climates where heat pumps will operate at lower efficiencies and in electric grids with higher emissions, a propane-to-heat pump switch often increases emissions damages.
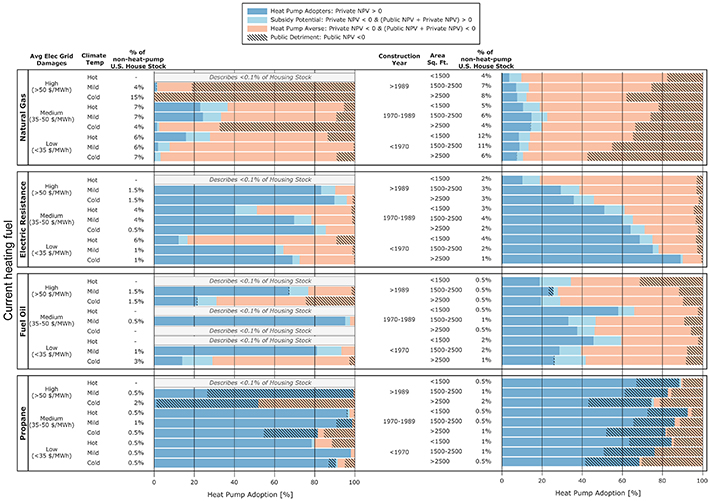
Figure 4. Heat pump adoption, subsidy potential, and public detriment vary by baseline heating fuel, electric grid region, climate temperature, and housing characteristics. The conclusions are based on current housing stock and the electricity grid damages are based on the historical grid and the assumption that those damages decline as described in section 2.3.
Download figure:
Standard image High-resolution image3.4. Pareto-optimal policy could extend heat pump adoption from 32% to 37% of houses
There are many houses where heat pump adoption would provide a public benefit, but heat pump adoption is unlikely because the private NPV is negative. Policy could incentivize these houses to install heat pumps. A policy could, for example, (a) identify houses where the public benefit of heat pump adoption outweighs the private loss and (b) subsidize the heat pump capital cost to bring the private loss to zero. We categorize the subset of houses where this policy is possible as 'subsidy potential' as shown in figures 3 and 4.
This subsidy potential category spans almost every city in this study and includes an additional 3.8 million houses. Such a policy would cost $2.6 billion—an annual amortized cost of $280 million—and would increase health and climate benefits by $190 million and $405 million annually, respectively.
As shown in figure 2 and corroborated by Davis [11], many US houses could be incentivized to adopt a heat pump via a small subsidy. We show, however, that only a small percentage of those heat pump installations would produce emissions benefits that exceed their subsidy cost.
3.5. Heat pump adoption rates vary by electric grid region, climate, housing characteristics, and baseline heating fuel
Perhaps the most important indicator of whether a home's adoption of a heat pump produces a benefit is its current heating fuel. Switching a home's heating fuel from natural gas to heat pumps rarely produces a benefit, especially in cold climates where there are almost no houses where such a switch makes sense. If there is opportunity for beneficially replacing natural gas heaters with heat pumps, it will be in medium-efficiency houses (1970–1989 vintage) in hot or mild climates.
Switching homes that use electric resistance heaters to heat pumps almost always produces a clear benefit. Replacing an electric resistance heater with a heat pump becomes more attractive in large (>1500 SF), lower-efficiency (<1990 vintage) houses in colder climates and higher-emissions electric grid regions.
Fuel oil heated homes almost always yield a positive public benefit from heat pump adoption. But this usually causes the homeowner a private economic loss. Nearly 65% of fuel oil heated houses are in cold climates, where heat pump adoption rates of greater than 20% are unlikely, if homeowners were to choose their mode of heating solely on cost. The greatest opportunity for replacing fuel oil heaters with heat pumps lies with small (<1500 SF), lower-efficiency (<1990 vintage) houses.
Replacing a propane heater with a heat pump, as previously discussed, is often economical to the homeowner but detrimental to air quality. This is especially true in high-emissions electric grids—i.e. MRO and RFC—where nearly 50% of propane heated homes are situated.
3.6. Health damages undermine climate benefits in 28% of potential heat pump retrofits
Heat pump adoption in the US almost always reduces CO2 emissions: for only 1.7 million (2.1% of) US houses does heat pump adoption lead to higher CO2 emissions. See figures 2 and 5. Thus, when viewing heat pumps solely as a means to decarbonization, it makes sense to push for very high adoption rates.

Figure 5. The change in climate and health damages caused by each house adopting a heat pump. Each point represents one simulated house. In most cases, heat pump adoption reduces climate damages but increases health damages. The distinct linear bands of dots in the upper right quadrant show retrofits of electric resistance heaters for distinct electric grid. The ratio of health damages to greenhouse gas damages is fairly constant for a specific electric grid. The distance a particular dot travels up that linear band depends on how much electricity is saved by switching from electric resistance heater to heat pump.
Download figure:
Standard image High-resolution imageHowever, the same relationship does not hold for health damages. Heat pump adoption often increases the health damages caused by criteria air pollutants such as SO2, NOx , and PM2.5. Compared to power plants, residential furnaces and boilers operate at lower combustion temperatures and stricter air quality regulations. That is, power plants produce significantly more criteria air pollutants than residential heaters do. Although adopting a heat pump displaces pollution geographically from urban households to rural areas—where power plants tend to be sited and fewer people may be exposed to the pollution—the net increase in pollutants and the ability of those pollutants to travel many hundreds of miles often yields an increase in health damages overall. As shown in figure 5, this situation—where heat pump adoption increases overall health damages—occurs for 47.5 million US houses, or 67% of the non-heat-pump housing stock. Michalek et al [42] and Holland et al [43] observe a similar shift in damages when passenger cars are electrified.
For 26.1 million of those houses, the climate benefits of heat pump adoption exceed the health damages. This yields a net public value that is positive. Thus, the health damages of heat pump adoption are often outweighed by the climate benefits.
There are many other houses, however, for which the opposite is true: the climate benefits of heat pump adoption are overshadowed by the health damages. Out of the 69.6 million houses where heat pump adoption provides a climate benefit, 19.7 million create health damages that exceed their climate benefits. This yields a net public value that is negative.
The public benefits of heat pump adoption could be improved by reducing the power sector's emission of criteria air pollutants. This could be accomplished, for example, through greater regulation of power plant pollutants—e.g. via desulfurization, catalytic reduction, electrostatic precipitators, and phasing out coal [44].
3.7. Grid firming needs are small except for high heat pump adoption rates in cold climates
In addition to increased health damages, another potential challenge for very high heat pump adoption rates is the cost of firming the electric grid to reliably accommodate greater peak electricity demand [8]. Figure 6 shows how heat pump adoption rates impact each city's peak residential electricity demand. Many cities see manageable grid firming needs. At 100% heat pump adoption, we find that 24 of the studied cities—representing 41% of the US housing stock—see their peak residential demand increase by 50% or less. Moreover, cities in hot climates—where cooling demand drives peak electricity consumption, and a new heat pump may provide an increase in cooling efficiency over the home's existing air conditioner—may even see heat pump adoption lead to a decrease in peak residential electricity demand.

Figure 6. In hot climates, a heat pump often replaces a less-efficient existing air conditioner unit, which decreases the overall residential peak demand. In cold climates, a heat pump often replaces a fossil-fuel furnace or boiler, which increases the overall residential peak demand. For definitions of 'heat pump adopters' and 'subsidy potential', see figure 3.
Download figure:
Standard image High-resolution imageAt 100% heat pump adoption, though, we find that 24 of the studied cities—representing 44% of the US housing stock—see their peak residential electricity demand increase by more than 100%. These cities tend to be in colder climates, where the heat pump must regularly operate at very low temperatures, which lowers heat pump performance.
At lower rates of heat pump adoption, however, most cities will notice only small changes in peak residential electricity demand. At the heat pump adoption rates shown for the 'heat pump adopters' and 'subsidy potential' categories in figure 3, we find that peak residential demand increases by 40% in a few cases, and less than 20% for most cities. Many distribution networks may have the excess capacity to handle these increases without needing any upgrades.
3.8. Sensitivity analyses
Our results so far are based on the assumptions outlined above and detailed in the section 2: that the grid gets substantially cleaner over the lifetime of a heat pump installed today. The outcomes of that analysis may change if those assumptions change. In the following section, we discuss the sensitivity of heat pump adoption rates to electric grid emissions and social carbon costs as well as the cost and efficiency of heat pump technology.
3.9. A higher social cost of carbon must accompany cleaner electric grids
We model the 15 years impacts of heat pump adoption and assume that electric grid emissions—both CO2 and criteria pollutants—decrease over that time. Still, electric grid emissions may fall faster or slower than we assume. The social cost of carbon—the price or economic externality representing the monetized damage caused by carbon emissions—may also increase in the future.
Each of these changes will affect the public NPV of heat pump adoption. Cleaner electric grids and higher social costs of carbon will generally incentivize the decarbonization that heat pumps provide. Figure 7 illustrates this effect.
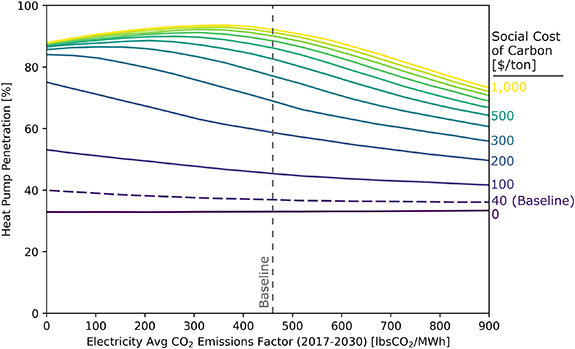
Figure 7. Reduced electric grid emissions fail to incentivize high heat pump adoption rates unless the social cost of carbon increases first. Heat pump adoption rate includes 11% of existing houses with existing heat pumps, 21% of houses that adopt heat pumps for private benefit alone, and houses where subsidizing heat pump adoption would provide a net public benefit. Note that the far left portion of the x-axis—where average 15 years electric grid emissions approach zero—is unlikely if not impossible. The full x-axis is explored for the sake of illustration.
Download figure:
Standard image High-resolution imageUsing our current 40 $/ton social cost of carbon assumption, a cleaner electric grid with fewer CO2 and criteria air pollutant emissions does not incentivize greater heat pump adoption. For many houses, heat pump adoption means small reductions in CO2 emissions, significant health damages, and/or large private economic costs. All of these challenges work against the case for heat pumps as a means to cost-effective deep decarbonization.
To overcome these challenges requires more than cleaning the electric grid—it requires that society place a greater value on the damages caused by CO2 emissions—i.e. a higher social cost of carbon. If both of these occur simultaneously, though, modest increases in carbon cost and reductions in grid emissions can strengthen the argument for significant heat pump adoption. For example, if grid emissions drop 35% lower than our assumptions and the social cost of carbon reaches 300 $/tCO2, then a net benefit for society could be achieved by a heat pump adoption rate of 75%.
3.10. Lower heat pump costs must accompany greater heat pump efficiency
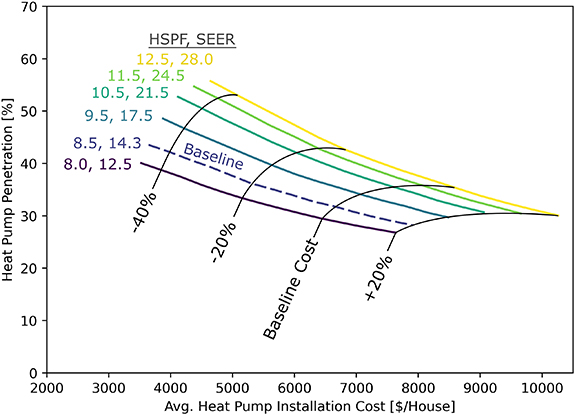
The analysis above describes the effects of replacing a house's baseline heating technology with an 8.5 HSPF, 14.3 SEER heat pump. This replacement costs houses—relative to the cost of replacing their existing heater with the same technology—an average of $6600. But the cost and efficiency of heat pumps may change depending on the project, incentives, or technology research and development.
Changes in heat pumps cost and efficiency will affect both the private and public NPV of heat pump adoption. Cheaper heat pumps increase the public NPV of heat pump adoption and reduce the energy savings needed to make it an attractive option. More efficient heat pumps have lower energy costs. Figure 8 illustrates these effects.
Figure 8. Lowering costs improves the impact of heat pump efficiency on adoption rates. Heat pump adoption rate includes 11% of houses with existing heat pumps and houses where adopting a heat pump would yield a positive private NPV.
Download figure:
Standard image High-resolution image
We show that greater heat pump efficiency does improve heat pump adoption rates, but with diminishing returns. These diminishing returns are particularly noticeable at higher installation costs. At the baseline cost, for example, upgrading the heat pump's efficiency has little impact on the overall adoption rates.
If costs come down—e.g. through technology advances, soft cost reductions, or subsidies—then the diminishing returns of higher-efficiency units are less pronounced. A policy aimed at defraying some of the added cost of higher-efficiency heat pumps, for example, may be an effective way to reduce costs and improve efficiency simultaneously.
4. Discussion
Our paper produces a more nuanced picture of the benefits and costs of heat pump adoption than past studies have. While past studies have identified entire regions where heat pumps produce public or private benefits or disbenefits [2], we find that in most climates and for most home types, heat pump penetration is lower than is socially optimal (i.e. public + private, NPV > 0). Consistent with past studies on the environmental effects of heating [2] and vehicle electrification [42], we find that electrification often cuts greenhouse gas emissions. However, the benefits of these reductions may be overwhelmed by increases in the damages of pollutants that contribute more directly to near-term mortality. Past studies show that full electrification will sharply increase electricity system demand and suggest that a solution might be to continue to use natural gas to provide a small amount of heating [3]. We show that, while peak demand for electricity is unlikely to rise dramatically if heat pumps are only adopted by those who save money by doing so, greater levels of penetration sharply increase peak electricity demand. This will require the electricity system to adapt in creative ways, including distributed generation and demand response (see, for example [45]).
Although our modeling method presents a broad picture of the public and private costs and benefits of heat pump adoption, it has two main shortcomings that could be improved in future work.
We examine energy efficiency in a rudimentary way. ResStock model provides many characteristics on which to assess the energy efficiency of different simulated houses—e.g. air infiltration, window type, attic insulation. A thorough investigation of those characteristics and their impact on heat pump adoption is beyond the scope of this study. Instead, we use house construction year—i.e. vintage—as a proxy for energy efficiency. This assumption is consistent with the way ResStock is designed, because the likelihood of a randomly generated house having high-quality weatherization, windows, attic insulation, and other qualities increases if its vintage is younger. Vintage is also a metric that policymakers could easily use in policy design. However, a policy drive to encourage heat pump adoption may well be accompanied by a drive to improve the quality of the housing stock. Indeed, houses of the future may be designed with electrification and efficiency in mind, and this may change the balance of benefits and costs of heat pumps. Future work should assess the combined benefits and costs of such retrofits with heat pump adoption.
High heat pump adoption rates and the policies, technology development, and innovation required to achieve them will have significant impacts on the electric grid and on energy markets. We assume constant values of fuel prices, marginal grid emissions, electricity prices, and heat pump capital costs. In reality, as heat pump adoption rates increase, and the electric grid becomes cleaner, these variables may change in a number of ways. For example, heat pump costs may decrease due to greater manufacturing economies of scale and experience of heat pump installers, the electric grid may become cleaner faster due to carbon policies, and fuel prices may change as demand for those fuels from the residential sector decreases. Our assumption of historical annual- and state-average prices is a limitation of the analysis. However, given the potentially enormous uncertainty in future energy prices [39], this simplifying assumption makes it easier to delineate the effects of housing stock, electricity generation mix, tax policy, and technology improvements. A more complete study might examine those different sensitivities to better understand the uncertainty of our solution.
Although these shortcomings may impact some of the values of our findings, we do not anticipate that they would impact this study's main conclusions. Heat pump adoption is a multi-faceted problem spanning multiple energy sectors and industries, but our analysis captures enough of that complexity to provide a defensible assessment of the public and private costs and benefits of heat pump adoption in the US. Finally, while we attempt to account for the fact that the grid is likely to become cleaner over the lifetime of heat pumps installed today, there is clearly a need for other approaches that forecast the effects on emissions of structural changes to the grid [46, 47] or even produce alternative estimates of emissions from the current electricity grid [48].
5. Conclusion
Heat pump adoption aligns well with decarbonization. That alignment is weak in some cases—for 8% of US houses, heat pump adoption either increases CO2 emissions or incurs very high abatement costs. While universal heat pump adoption across the US has questionable value, very high adoption rates of 80%–90% may cost-effectively reduce greenhouse gas emissions.
Given current energy prices, electric grid emissions forecasts, and heat pump technology, however, we find such high adoption rates unlikely. From a private economic viewpoint, we find that heat pump adoption yields a net economic benefit for 21% of US single-family houses. When including houses with existing heat pumps, this amounts to a total adoption rate of 32%. From a public welfare viewpoint, we find that the combined climate and health NPV of heat pump adoption is positive for 70% of the non-heat-pump US housing stock. This rate may decrease when considering the cost of firming the electric grid to handle increased peak electricity demand: a consequence that many cities will experience.
Thus, we find merit in heat pumps as a decarbonization tool, but there are many impediments to achieving high adoption rates. However, our analysis reveals key technology, policy, and strategic insights to navigate those impediments, all of which apply not just to the US but to other countries or jurisdictions:
- Address mild climates first: heat pump adoption in mixed and coastal climates (see figure 1) shows strong private economic potential and limited public detriment. This is especially true in electric grids with medium emissions. Moreover, cities in mild climates are less likely to see sharp increases in peak electricity demand or the associated grid firming costs.
- Address cold climates last: heat pump adoption in cold climates (see figure 1) shows weak private economic potential and significant public detriment. Moreover, cities in cold climates are more likely to see sharp increases in peak electricity demand and the associated grid firming costs. The exception is when installing a heat pump to replace an electric resistance heater: this retrofit usually reduces homeowner costs, lowers emissions, and reduces peak electric demand.
- Accelerate the reduction of power sector emissions: efforts to reduce power plants' criteria air pollutants and to construct zero- or low-carbon generation will strengthen the public case for heat pump adoption. The faster these efforts advance, the more beneficial high heat pump adoption rates will become. Where the incumbent technology is fuel oil or resistive heat, a switch to heat pumps is likely to be environmentally and economically beneficial even with current electricity grids.
- Defray the cost of medium-efficiency heat pump technology: small reductions in capital cost and small gains in efficiency could greatly increase adoption rates. These could be achieved by policies such as industry training to reduce installation costs, research and development to lower technology cost, subsidies that prioritize higher-efficiency units, or rewards that incentivize net reductions in CO2 emissions.
- Focus on appropriate housing stock niches: some house types benefit more from heat pump adoption than others. For example, in the US, natural gas retrofits seem most promising in medium-efficiency houses (1970–1989 vintage), oil- and propane-retrofits in small (<1500 SF), older (pre-1990s vintage) houses, and electric resistance heater retrofits in large (>2500 SF), old (pre-1970s vintage) houses.
Targeted strategic, technology, and policy initiatives can support high heat pump adoption rates and deep electrification of the residential heating sector. As the electric grid becomes cleaner, that electrification will yield greater reductions in CO2 emissions.
Acknowledgments
Funding for this work came from the Alfred P Sloan Foundation and from the center for Climate and Energy Decision Making (SES-0949710), through a cooperative agreement between the National Science Foundation and Carnegie Mellon University. Special thanks to Eric Wilson and Joseph Robertson at the National Renewable Energy Laboratory for providing training and troubleshooting for the ResStock program.
Data availability statement
The data that support the findings of this study are available upon reasonable request from the authors.