

UPDATE 5
 by Sheyla Delgado, Gina Moreno, Richard Espinobarros, and Jeffrey A. Butts
INTRODUCTION
The New York City Mayor’s Action Plan for Neighborhood Safety (MAP) is designed to improve the safety and well-being of residents in 17 public housing developments operated by the New York City Housing Authority (NYCHA).(1) With funding provided by the New York City government through the Mayor’s Office of Criminal Justice (MOCJ), John Jay College’s Research and Evaluation Center (JohnJayREC) began an evaluation of MAP in 2017. The quasi-experimental evaluation tracks seven crime outcomes, estimating the extent to which they changed after the introduction of MAP in July 2014.
1. The MAP initiative is often described as an intervention focused on 15 housing developments, but NYCHA considers three of those developments (Red Hook, Queensbridge, and Van Dyke) as comprising two distinct communities each. Thus, MAP could be defined as an effort involving 18 sites. One of those sites, however, is exclusively for older residents (Van Dyke II) and it was excluded from the study. Thus, the evaluation conceptualizes MAP as an initiative affecting 17 NYCHA communities.
Data used in this report are publicly available from the city’s Open Data portal (see MAP Evaluation Update 3 for more information). The NYPD historical complaint data set contains more than six million reports of felony offenses, misdemeanors, and violations from 2006 through the most recent calendar quarter. Nearly all records (97%) include geographic coordinates denoting the closest mid-block location where an incident occurred. Researchers at JohnJayREC introduced a 52-foot geodesic distance buffer (to account for the curvature of the earth) to assign all reported crime incidents to the nearest NYCHA development without overlap. This rich source of point-level data allowed researchers to examine crime-related outcomes across space and time.

MEASURING CHANGE
Researchers first compared reported crime trends in the 17 NYCHA housing developments involved in MAP with trends in all 275 NYCHA developments not participating in MAP as well as citywide trends outside of NYCHA. Reported crime rates (crime “complaints” per 10,000 residents) were calculated for 4.5 years before the launch of MAP (January 2010–June 2014) and 5.5 years after MAP (July 2014–December 2019).
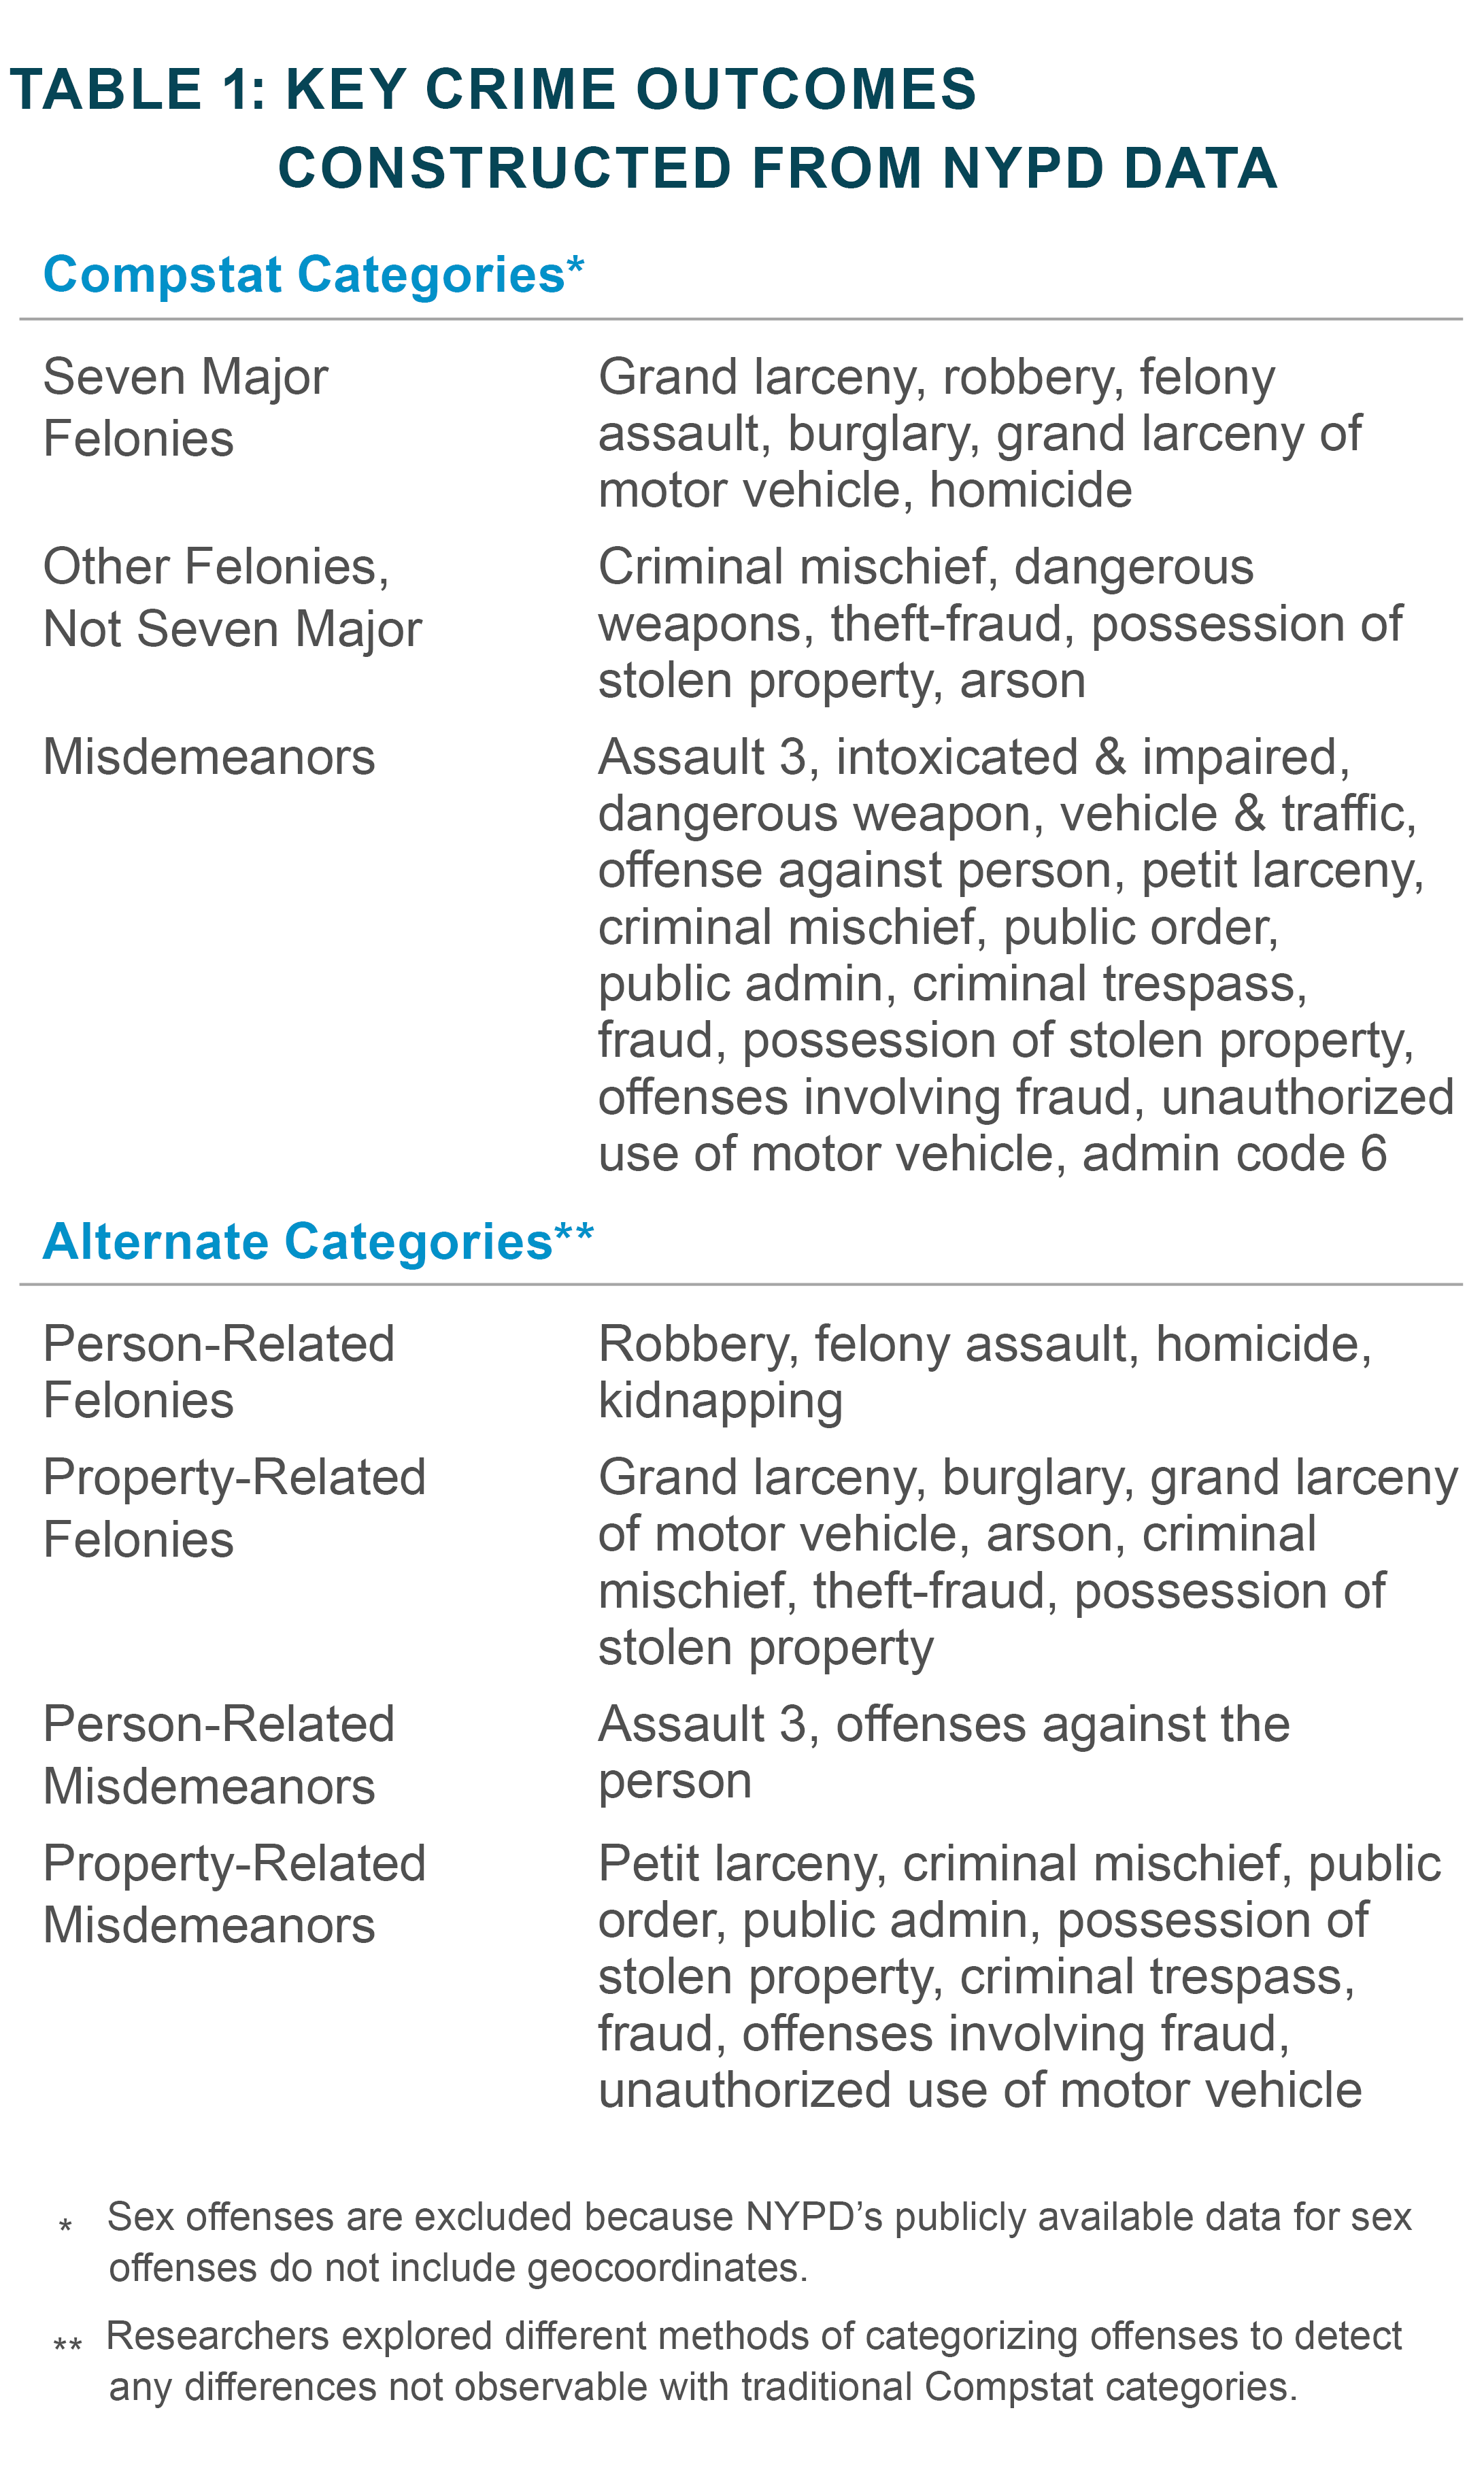
Offense categories included three indices tracked by NYPD’s CompStat system: 1) serious crimes known as “7 Major” felonies; 2) other felonies not included in the seven majors; and 3) misdemeanors. To test other categories, researchers organized many of the same offenses crimes into alternate groups: 4) felonies against persons; 5) felonies involving property; 6) misdemeanors against persons; and 7) misdemeanors involving property (see Table 1).
 Results of this initial analysis suggest that MAP may be a promising approach to improving the safety of public housing communities. When crime rates in MAP developments are compared with all non-MAP developments, trends for some crimes (i.e. misdemeanors) appear to decline more in communities participating in MAP (Figure 1).

Of course, graphing crime rates over time may not tell the complete story about public safety before and after MAP. Crime rates fluctuate, which may obscure general trends. To measure changes more accurately and to discern underlying patterns, researchers must rely on other statistical methods. The study next calculated the overall percentage change in reported crimes before and after the introduction of MAP. Researchers compared the average of all monthly rates of reported crimes before and after MAP in the 17 MAP developments and all other NYCHA developments not involved in MAP (Figure 2).
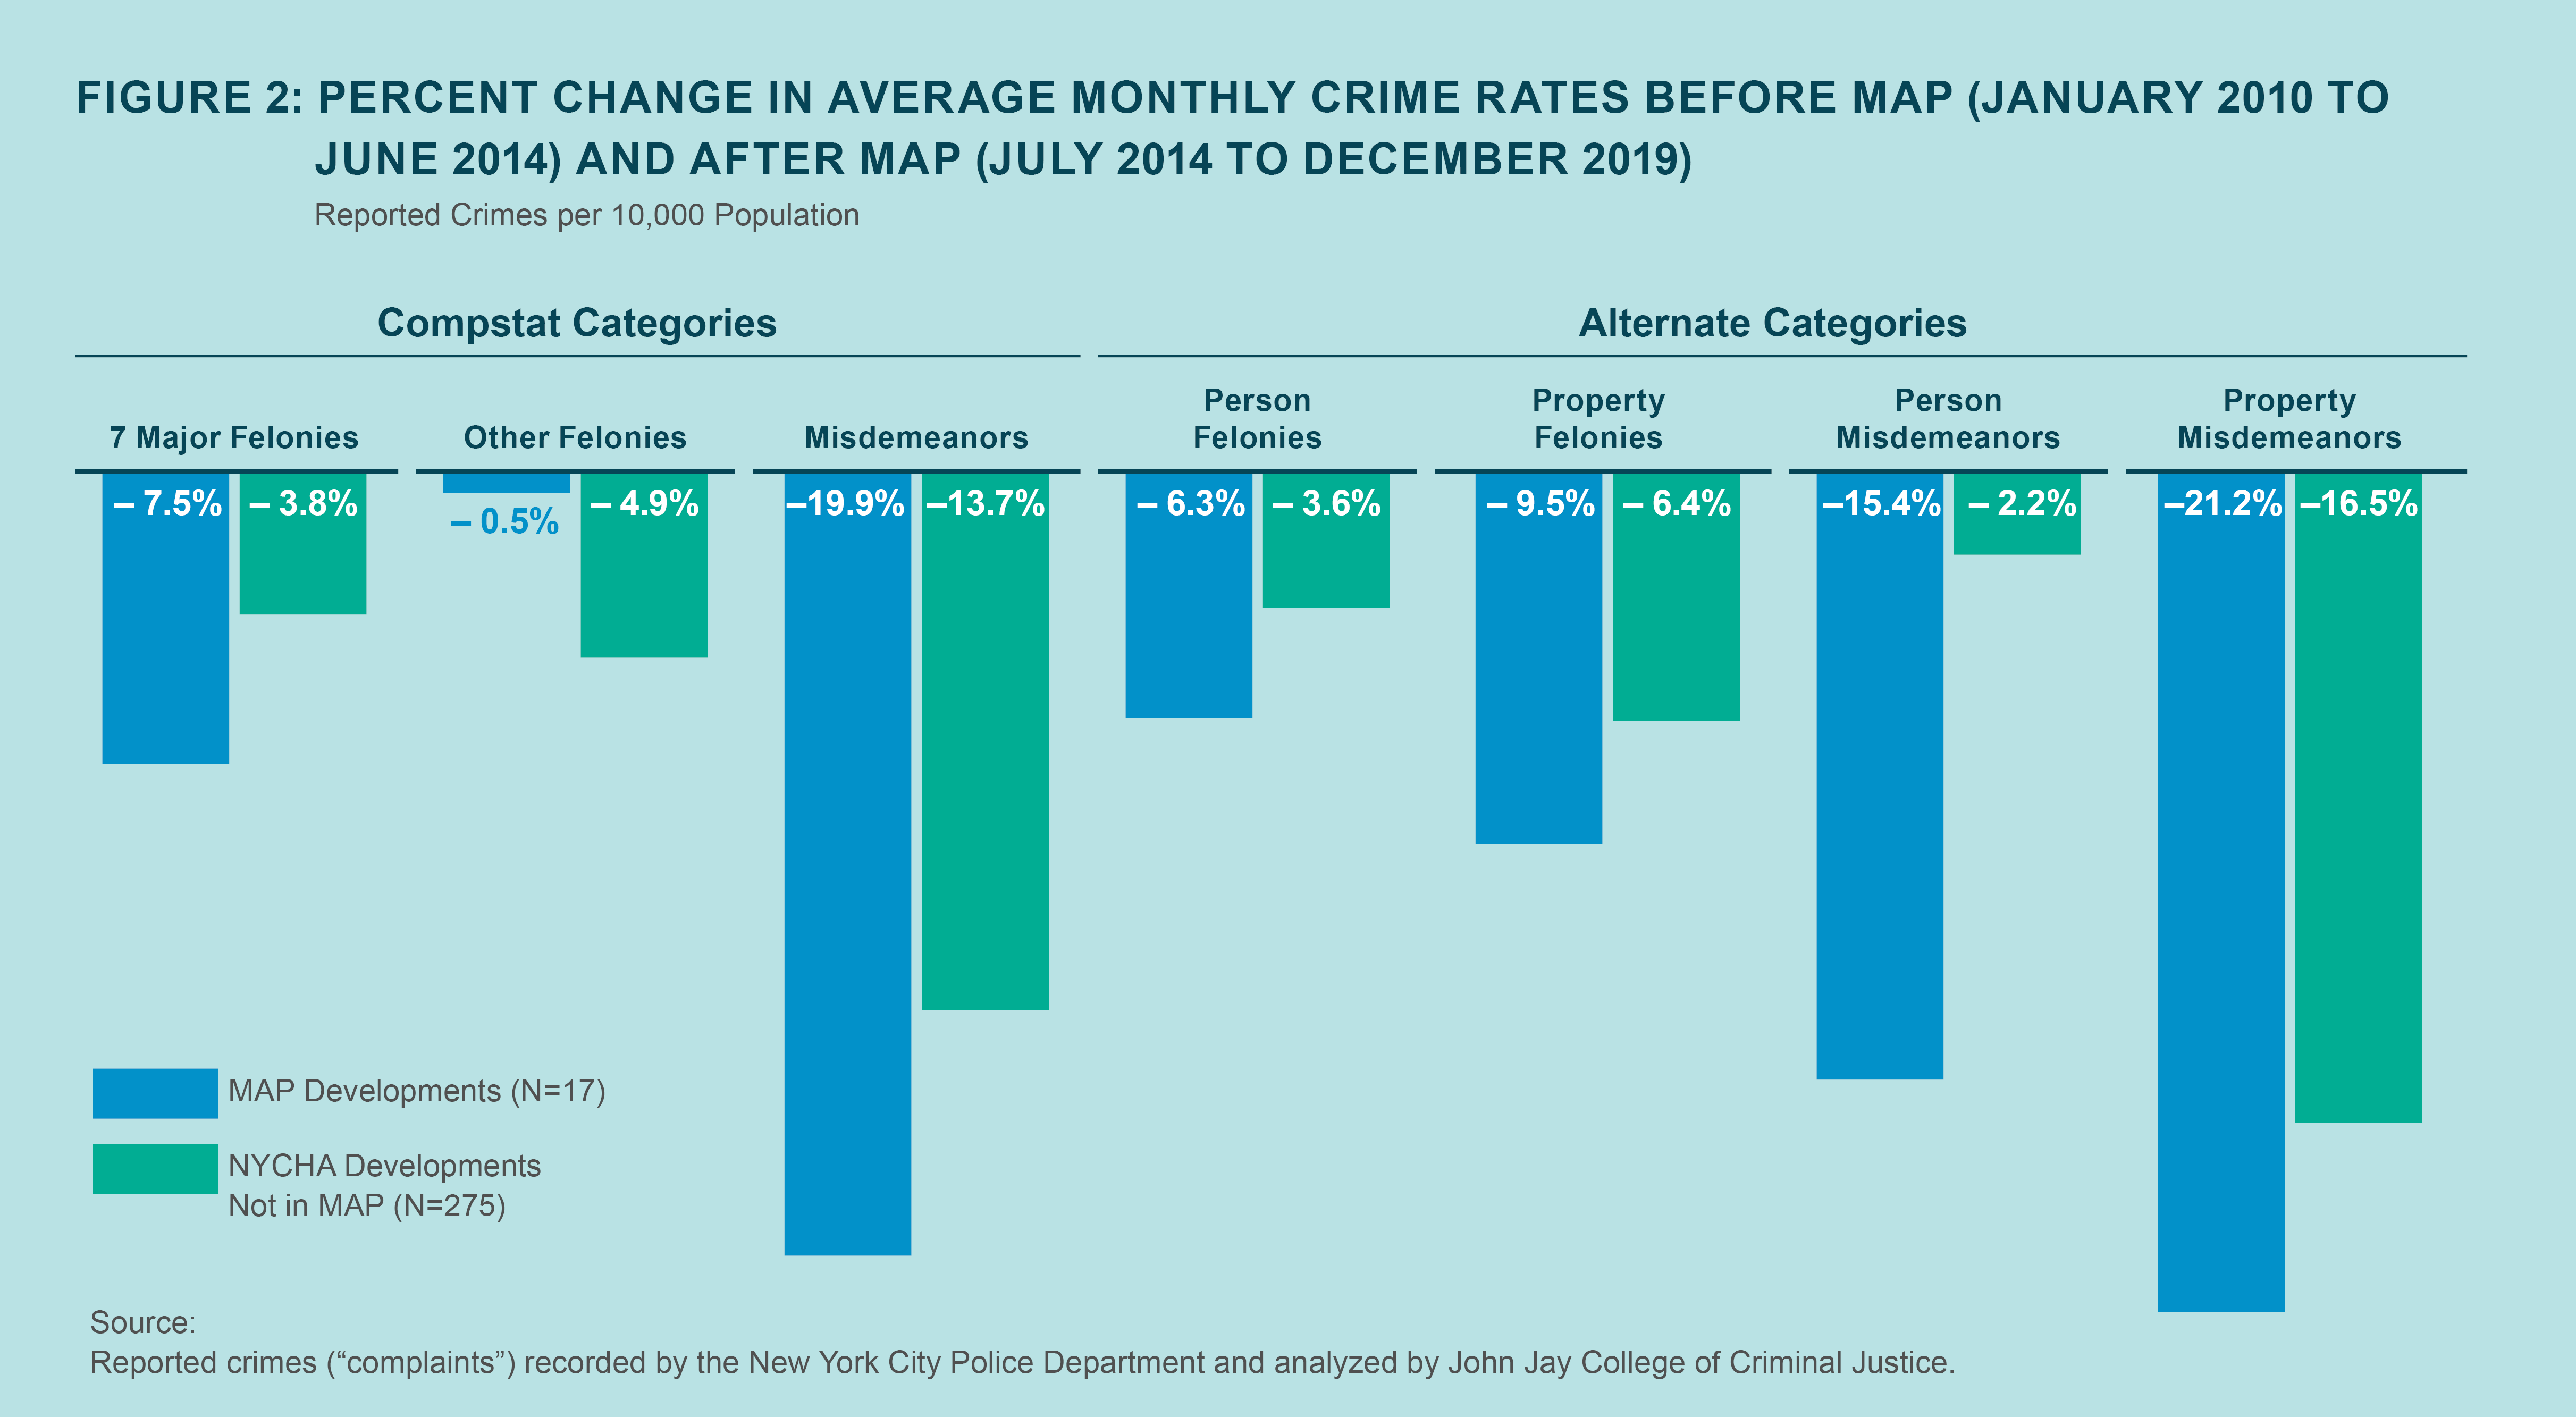
The results remained encouraging. In six of the seven offense categories, average crime rates fell more in MAP developments than in non-MAP developments. The average rate of felony offenses included in NYPD’s 7 majors category, for example, declined 7.5 percent in MAP developments but only 3.8 percent in non-MAP developments.
Changes in other crime rates also favored MAP. Reports of person felonies dropped 6.3 percent in MAP areas but just 3.6 percent in NYCHA developments not involved in MAP. Reports of misdemeanors against persons declined far more in MAP areas than in non-MAP areas (–15.4% versus –2.2%).
This method of detecting change, however, is not definitive. The research team conducted two additional analyses: 1) an interrupted time series analysis of crimes reported in MAP developments; and 2) a difference-in-difference analysis with matched comparison sites.
Interrupted Time Series
To assess whether MAP shifted crime trends in participating developments, researchers conducted single-group interrupted time series analyses, or ITS (Figure 3). The ITS analysis uses a regression model to estimate and fit pre-intervention and post-intervention crime trends.
The results were still encouraging. Three reported crime outcomes (NYPD seven majors, person felonies, and property felonies) showed significant declines ( p < .10) in MAP developments relative to pre-MAP trends. Other outcomes, however, showed only small declines or no declines. Crime may have dropped after the launch of MAP, but the rate of decline was not significantly different than the pre-MAP period.

Researchers identified a matched set of NYCHA communities not participating in MAP using a statistical technique known as propensity score matching (see MAP Evaluation Update 1). More importantly, the single-group ITS analysis characterizes before and after trends in one place, but it does not answer a key question: were similar changes observed in other places? Other than the passage of time before and after 2014 in MAP sites, a single-group ITS analysis does not account for the possibility that crime rates were changing in similar ways in other communities.
Difference-in-Difference
The next step in the investigation was to determine how many of these apparent trends would withstand a more rigorous, comparative analysis. Researchers tracked the same outcomes in otherwise similar places not receiving the intervention. Collecting data from areas unaffected by an intervention is what researchers call measuring the “counterfactual” (MAP Evaluation Update 3).
Each site involved in MAP was paired with another NYCHA site that was similar in demographics and recent crime rates. After matching sites were identified, crime trends across all MAP developments were compared with all matching non-MAP developments using more rigorous analytic techniques.
The study examined group-level differences between MAP sites and comparison sites using two-way fixed effects negative binomial model (Table 2). The analysis first examined the distribution of each outcome and assessed overdispersion (when the variation between data points is greater than expected for a given model). All seven outcomes appeared to be non-normally distributed and overly dispersed, which is often true in studies analyzing law enforcement data due to large numbers of low rates and small numbers of high rates. For this reason, the research team used non-parametric models to test the effects of MAP.(2)
2. Rydberg, Jason and Danielle Marie Carkin (2016). Utilizing Alternate Models for Analyzing Count Outcomes. Crime & Delinquency, 63(1): 61-76.
Researchers tested 35 count regression models across all seven outcomes to estimate changes before and after the launch of MAP. Each model measured the amount of change in an outcome in MAP sites compared with matched non-MAP sites while accounting for monthly and unit fixed-effects with robust standard errors for units.

The coefficients of count regression models are typically represented in either logged form or as incidence rate ratios (IRR), an exponentiated form of the coefficient. The IRR for a binary predictor variable is a ratio of the number of events in one category to the number of events in another category. In this case, the IRR is a ratio of crime incidence counts after MAP compared with counts before MAP. Each model included a binary indicator for the time periods before and after MAP, an indicator for treatment group (MAP versus comparison), and an interaction term (examining each treatment group before and after MAP).
Across all outcomes, MAP sites had higher counts of crime events throughout the study period, and the difference was statistically significant for all three of the CompStat outcomes, as indicated by the coefficients for the group variable. This is not a surprising finding, however, as the treatment areas were selected to host the MAP initiative specifically because they needed more help with public safety issues. More central to the analysis was the variable for treatment effect, which explored whether changes in crime over time favored MAP.
Results of the analysis suggest that, relative to comparison sites and controlling for other factors, the presence of MAP was associated with meaningful declines in two of seven crime outcomes: all misdemeanors monitored by NYPD and especially person-related misdemeanors. Felony offenses remained stable after the launch of MAP relative to the comparison communities. In sum, the analysis suggests that, holding all else constant, and relative to crime trends exhibited in a set of matching NYCHA developments not involved in MAP, the presence of MAP in NYCHA developments was associated with statistically significant declines in misdemeanors with the sharpest decline in misdemeanors against persons.
CONCLUSION
While effects are modest and largely found in misdemeanor offenses, this rigorous test of the Mayor’s Action Plan for Neighborhood Safety indicates that New York City’s effort to improve the safety of public housing communities was beginning to show benefits by the end of 2019. Based on these findings, the results of MAP are promising.
________________________
Technical Notes
Monthly counts of reported crimes for each of 313 public housing developments in New York City from 2010 to 2019 were obtained from the NYC Open Data Portal. To choose the most appropriate type of count data regression model, the research team relied on the Bayesian Information Criterion (BIC). For the seven principal outcomes used in the study, BIC values were consistently lower for negative binomial models. Researchers conducted 35 models, or five model specifications per outcome:
Model 1 – group, intervention, and an interaction term
Model 2 – group, intervention time, interaction term, and covariates
Model 3 – group, intervention time, interaction term, and significant covariates
Model 4 – group, intervention time, interaction term, significant covariates, and dummy variables for fixed effects.
Model 5 – group, intervention time, interaction term, and dummy variables for fixed effects.
Several covariates were explored. Researchers generated a dichotomous monthly-surge-in-arrests variable to measure unusually high arrest activity—i.e. when arrests in a given month were two standard deviations away from the annual mean. Using 311 non-emergency data, the study also tested variables for monthly counts of citizen complaints about noise, heat and hot water, street potholes, and street lights. Some measures were significantly associated with one or more crime outcomes, but none changed the association between MAP and reported crimes when incorporated into multivariate analyses. All five models yielded almost nearly identical results.
This report presents results based on model 5, which included two-way fixed effects for each study site and each time period (120 total periods). Fixed-effects were used when characteristics between entities (i.e., study site) may have biased an outcome. To account for the unique trend of each outcome, all models included a time effect as well.
Acknowledgments
Funding for this report was provided by the New York City Mayor’s Office of Criminal Justice (MOCJ). All crime data were provided by the New York City Police Department. Points of view or opinions contained within this document are those of the authors and do not necessarily represent the official position or policies of the City University of New York, John Jay College, the Mayor’s Office of Criminal Justice, or the New York Police Department.
The authors are grateful to the staff and leadership of the Mayor’s Office of Criminal Justice for their support during the development of the project and to the members of the MAP Advisory Board for their critical guidance. The authors are also grateful for the assistance received from John Jay colleagues who contributed to the project, especially Wogod Alawlaqi, Nicole Alexander, Rebecca Balletto, Justice Banks, Patricia Cobar, Rhoda Ramdeen, and Kathy Tomberg.
Recommended Citation
Delgado, Sheyla A., Gina Moreno, Richard Espinobarros, and Jeffrey A. Butts (2020). Reported Crime in MAP Communities Compared with Other NYC Areas. MAP Evaluation Update 5. New York, NY: Research and Evaluation Center, John Jay College of Criminal Justice, City University of New York.
Copyright
Research and Evaluation Center at John Jay College of Criminal Justice
City University of New York (CUNY)
524 59th Street, Suite 605BMW
New York, NY 10019
www.JohnJayREC.nyc
