AGA Commercial Gaming Revenue Tracker
Keep up to date on the latest commercial gaming revenue numbers.
AGA Commercial Gaming Revenue Tracker
AGA’s Commercial Gaming Revenue Tracker provides state-by-state and cumulative insight into the U.S. commercial gaming industry’s financial performance based on state revenue reports.
AGA’s Commercial Gaming Revenue Tracker provides state-by-state and cumulative insight into the U.S. commercial gaming industry’s financial performance based on state revenue reports. This issue highlights results for the full calendar year 2023, as well as the fourth quarter.
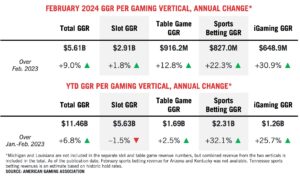
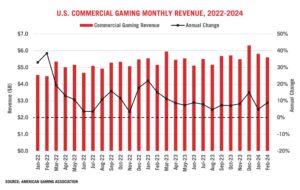
Commercial gaming industry revenue expanded nine percent in February compared to the previous year, the 36th consecutive month of annual growth. State regulator data compiled by the AGA shows that gaming industry win from traditional casino games, sports betting, and iGaming was $5.61 billion – a new record for the month of February.
Through the first two months of 2024, commercial gaming revenue totaled $11.46 billion, 6.8 percent ahead of last year’s record pace.
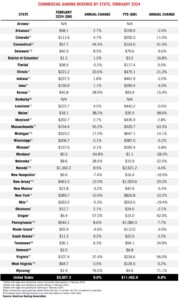
In total, 28 of 34 commercial gaming jurisdictions that were operational a year ago and had published full February data at the time of writing saw combined revenue from traditional casino games, sports betting and iGaming expand from the previous year. Sports betting revenue was not yet available for Arizona and Kentucky at the time of writing.
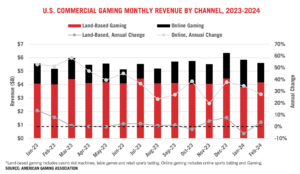
After contracting 5.9 percent in January, revenue from land-based gaming revenue rebounded in February, driven by strong table game performance. Combined revenue from casino slots, table games and retail sports betting reached $4.16 billion, a 3.7 percent increase from the previous year.
Revenue momentum for online gaming—encompassing online sports betting and iGaming—decelerated somewhat from 34.6 percent in January to 27.5 percent in February, largely due to a slower pace of sports betting revenue growth.
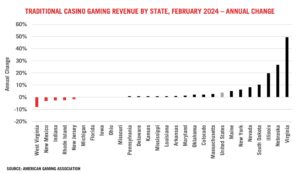
While the more mature traditional casino slot machine and table game segments continue to see slower growth than digital offerings, they remain the dominant revenue drivers for the commercial gaming industry. In February, these segments collectively generated $4.13 billion in total revenue, a year-over-year increase of 4.0 percent. Specifically, slot machines produced $2.91 billion in revenue, up 1.8 percent, while table game revenue jumped 12.8 percent to $916.2 million.
Note that the individual slot and table game figures exclude data from Louisiana and Michigan due to differences in state reporting, but their combined figures contribute to the nationwide total.
At the state level, 20 out of the 27 states offering traditional casino slot machines and/or table games posted gains compared to February 2023, with a median increase of 1.8 percent.
Through February, year-to-date revenue from casino slot machines and table games trails the same period in 2023 by -1.0 percent at $7.88 billion. At the state level, 21 out of 27 commercial gaming states offering these gaming options in 2023 posted year-to-date slot/table revenue declines through February.
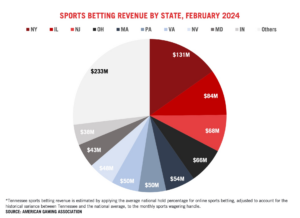
In February, commercial sportsbooks generated $827.0 million in revenue across 31 jurisdictions that had published full February data at the time of writing. This marks an increase of 22.3 percent from February 2023 when commercial sports betting markets were active in 30 jurisdictions.
For the month, Americans wagered $10.49 billion on sports, up 24.8 percent year-over-year.
Year-to-date commercial sports betting revenue was $2.31 billion, exceeding the same period in the previous year by 32.1 percent. The national hold rate was 7.9 percent, unchanged from February 2023.
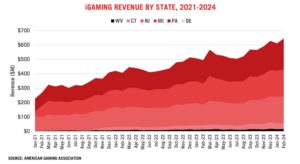
In January, the U.S. iGaming sector marked a new single-month revenue record as combined operations in Connecticut, Delaware, Michigan, New Jersey, Pennsylvania and West Virginia generated $648.0 million, up 30.9 percent year-over-year. All six iGaming markets saw gains compared to the previous year and three – Delaware ($3.9M) Michigan ($188.0M) and Pennsylvania ($215.3M) – reported monthly revenue records.
Year-to-date iGaming revenue stands at $1.26 billion, an increase of 25.7 percent compared to the same period in 2023.
About the Report
AGA’s Commercial Gaming Revenue Tracker provides state-by-state and nationwide insight into the U.S. commercial gaming industry’s financial performance. Monthly updates on AmericanGaming.org feature topline figures based on state revenue reports while quarterly reports provide a more detailed analysis covering the three previous months.