Low-Carbon Hydrogen Market Size, Trends, Country Analysis, Production Process, Cost by Technology, Key Players and Forecast to 2030

Powered by

Access in-depth insight and stay ahead of the market

Accessing the in-depth insight from the ‘Low-Carbon Hydrogen Market’ report can help you:

  • Facilitate decision-making by providing trend analysis in the low-carbon hydrogen market.
  • Develop business strategies by understanding the drivers and challenges of the market.
  • Position yourself to gain the maximum advantage of the industry’s growth potential.
  • Maximize potential in the growth of the low-carbon hydrogen market
  • Identify key partners, geographies, and business-development avenues.
  • Analyze the key end-users, market size, growth, demand, as well as the cost of production by technology.
  • Anticipate expected changes and the key trends shaping the market and adjust your business development strategies.

How is the ‘Low-Carbon Hydrogen Market’ report different from other reports in the market?

  • The report provides an in-depth qualitative analysis of the macroeconomic, technology, and regulatory trends shaping the industry.
  • It offers a quantitative analysis of the key segments in the low-carbon hydrogen industry.
  • The report provides data and analysis on low-carbon hydrogen production and technology, electrolyser capacity, policy, low carbon hydrogen scenario, major active and upcoming plants, and market drivers and challenges.
  • It provides a detailed analysis of the end-users (refining, chemicals, steel, power generation, transportation, and buildings).
  • The report will give you a deeper understanding of the potential regions (Europe, Americas, and APAC) as well as target countries such as the US, Germany, Canada, France, Spain, Portugal, China, Japan, India, South Korea, and Australia.
  • It provides a list of the projects, deals, and milestones.
  • The report offers a list of major companies, major participants in the low-carbon hydrogen value chain, as well as company profiles.

We recommend this valuable source of information to anyone involved in:

  • Hydrogen Project Owners and Developers
  • Fuel Cell Manufacturers
  • EPC Contractors Focused on Hydrogen projects
  • Electrolyzer Manufacturers

To get a snapshot of the low-carbon hydrogen market report, download a free report sample

Low carbon Hydrogen Market Overview

Hydrogen is mainly used in oil refining and the production of fertilizers. The demand for hydrogen in industrial applications has more than tripled since 1975 and the demand is also increasing in meeting the climate change targets of different countries. Countries such as the US, Canada, the Netherlands, the UK, and Australia are making substantial investments in hydrogen technology. Hydrogen has ample possibilities in steel, iron, cement manufacturing and other industries. Hydrogen also has potential applications in fuel cell trucks and cars and shipping and aviation. Already, cars such as the Toyota Mirai and the Hyundai ix35 are powered by hydrogen fuel cells.

Market Size (2022) 1,698 ktpa
Key Processes Steam Methane Reforming (SMR), Autothermal Reforming Biomass Reforming, Electrolysis, Photo Electric Chemical (PEC) Water Splitting, Thermochemical Water Splitting, Biomass Gasification, Coal Gasification, And Methane Pyrolysis
Key Energy Source Natural Gas, Solar, Wind, Hybrid, Biomass, Geothermal, Hydro Energy, and Tidal
Key End-Product Hydrogen, Ammonia, Liquified Hydrogen, Methane, and Methanol
Leading Players Green Hydrogen International, H2 Clean Energy, Intercontinental Energy Corp, and Fortescue Future Industries Pty Ltd

The low carbon hydrogen production capacity was 1,698 ktpa in 2022 and it is anticipated to reach 1,11,326 ktpa in high case scenario by 2030. Low-carbon hydrogen production has shown slow growth in the past. Over the last few years, low-carbon hydrogen production has been flat. However, the trend reversed, and the production increased to 0.66Mtpa in 2021, and the trend is projected to be the same over the coming years.

The low-carbon hydrogen market research report provides a market study at the global level, and a key country level covering eleven key countries in depth. The report also provides key growth drivers and challenges at a country level.

Low-carbon Hydrogen Market Trends

Low-carbon hydrogen is produced in a way that generates little to no GHG emissions. Low-carbon hydrogen can be produced using water and electricity through a procedure called electrolysis, employing biomass through gasification, or adding carbon capture use and storage to a carbon-intensive way of generating hydrogen.

The rising implementation of hydrogen refueling stations, advancements in hydrogen pipelines and the end use of hydrogen in the heating and energy sector, the shift towards green hydrogen, and the growing emphasis on hydrogen for decarbonization goals among others are some of the trends expected in the hydrogen technology over the next couple of years. Approximately 700 hydrogen stations were deployed globally by the end of 2021 of which half were in South Korea, Japan, and China. The largest number of hydrogen fuel stations are in China.

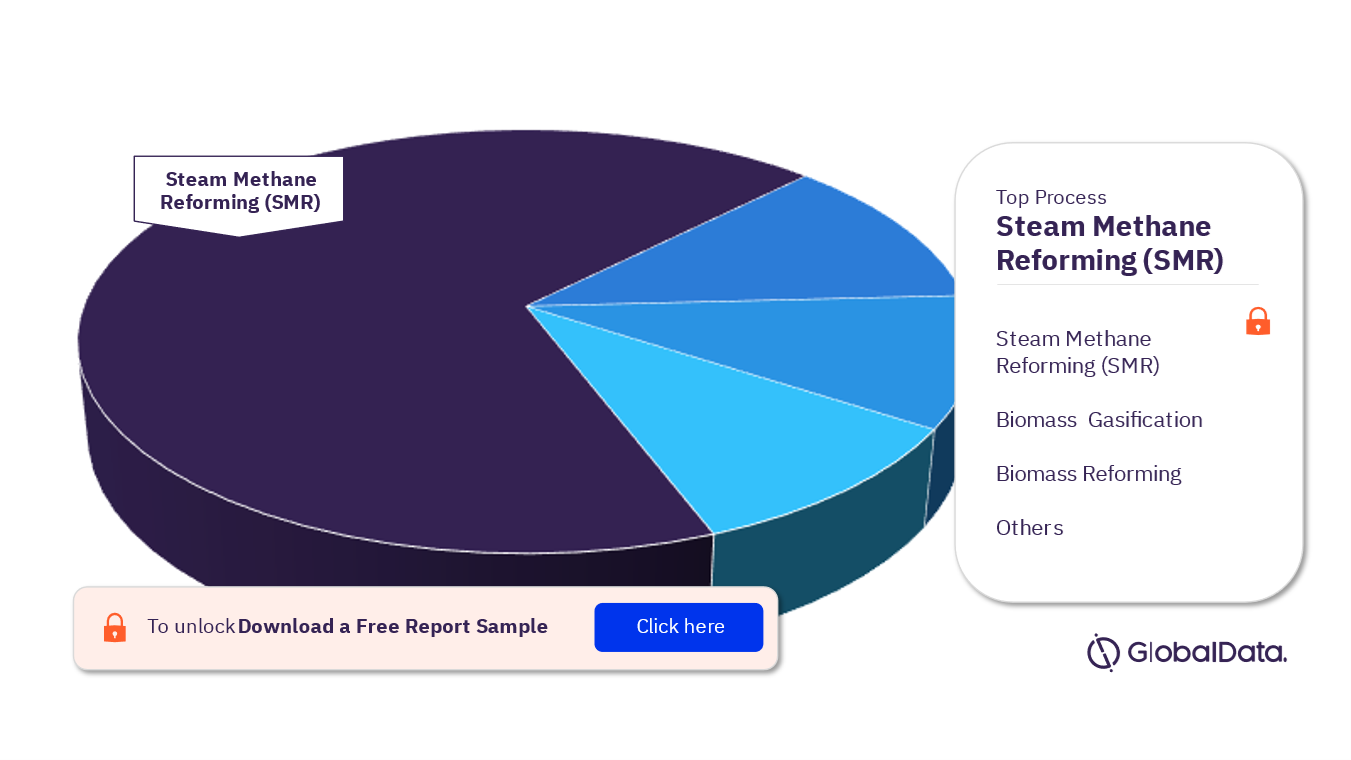
Low-carbon Hydrogen Market Segmentation by Process

The processes in the low-carbon hydrogen market are Steam Methane Reforming (SMR), auto thermal reforming (ATR), biomass reforming, electrolysis, photoelectric chemical (PEC) water splitting, thermochemical water splitting, biomass gasification, coal gasification, and methane pyrolysis. In 2022, Steam Methane Reforming (SMR) led the market for low-carbon hydrogen production with a capacity share of more than 87%, followed by electrolysis and coal gasification.

In the SMR process, high-temperature steam is used to convert methane such as natural gas into pure hydrogen, carbon monoxide, and a relatively small amount of carbon dioxide. The hydrogen produced is purified to quality as per the customer’s specifications. SMR is the most common and economical way to produce hydrogen, which can be used to produce electricity, refine oil, and carry out numerous chemical processes and other industrial applications.

Low-carbon Hydrogen Market Analysis by Process, 2022 (%)

Low-carbon Hydrogen Market Analysis by Process, 2022 (%)

For more insights into the low-carbon hydrogen market segments by process, download a free report sample

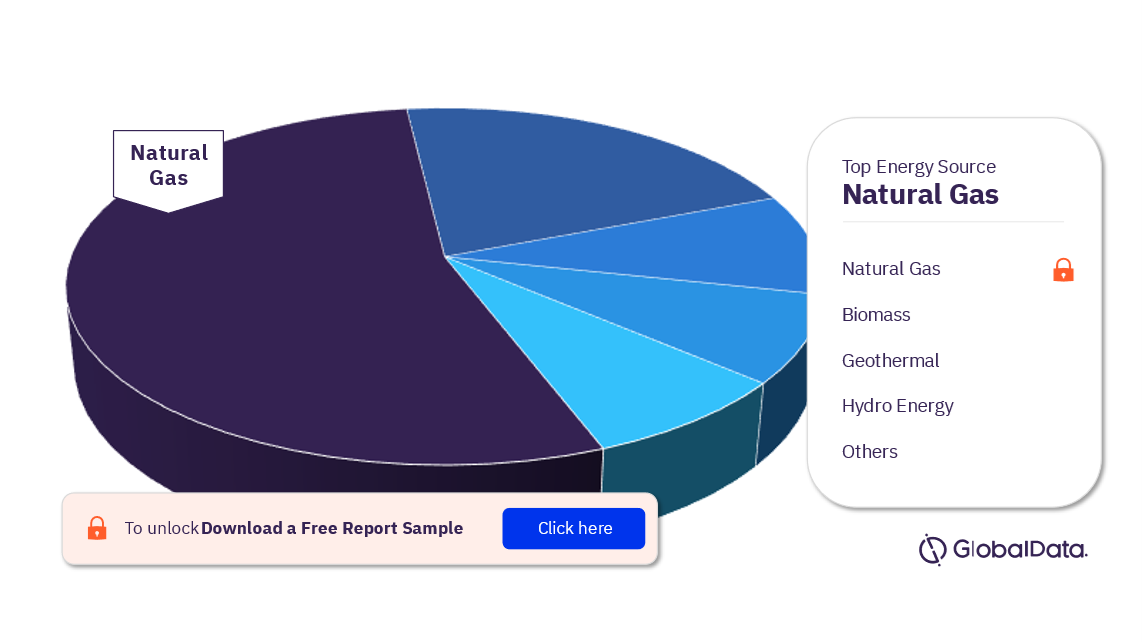
Low-carbon Hydrogen Market Segmentation by Energy Source

The key energy sources in the low-carbon hydrogen market are natural gas, solar, wind, hybrid, biomass, geothermal, hydro energy, and tidal among others. In 2022, natural gas secured its position as the leading energy source for producing low-carbon hydrogen followed by coal and solar power. However, it is anticipated that wind is going to be the major source for low carbon hydrogen production and is expected to secure major share by 2030.

Low-carbon Hydrogen Market Analysis by Energy Source, 2022 (%)

Low-carbon Hydrogen Market Analysis by Energy Source, 2022 (%)

For more insights into the low-carbon hydrogen market segments by energy source, download a free report sample

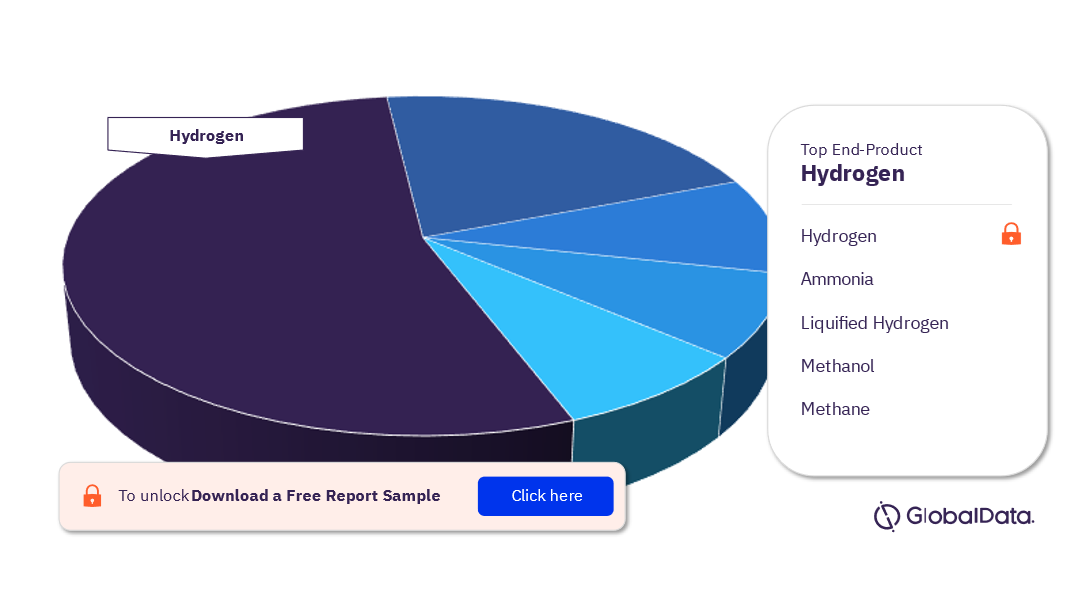
Low-carbon Hydrogen Market Segmentation by End-product

The key segments of the low-carbon hydrogen by end product are hydrogen, ammonia, liquified hydrogen, methane, and methanol. In 2022, Hydrogen led the market for low-carbon hydrogen by end product accounting for a share of more than 85%, followed by Ammonia. The target for clean energy has a positive impact on the demand of low carbon hydrogen worldwide.

Low-carbon Hydrogen Market Analysis by End Product, 2022 (%)

Low-carbon Hydrogen Market Analysis by End Product, 2022 (%)

For more insights into the low-carbon hydrogen market segments by end product, download a free report sample

Low-carbon Hydrogen Market - Competitive Landscape

Key hydrogen operators in the low-carbon hydrogen market include companies such as Green Hydrogen International, H2 Clean Energy, Intercontinental Energy Corp, and Fortescue Future Industries Pty Ltd among others. Green Hydrogen International holds the major share of the market.

Low-carbon Hydrogen Market Analysis by Companies (%)

Hydrogen Market Analysis by Companies (%)

For more company insights into the low-carbon hydrogen market, download a free report sample

Segments Covered in the Report

Low-carbon Hydrogen Market Process Outlook (2022-2030)

  • Steam Methane Reforming (SMR)
  • Autothermal Reforming Biomass Reforming
  • Electrolysis
  • Photo Electric Chemical (PEC) Water Splitting
  • Thermochemical Water Splitting
  • Biomass Gasification
  • Coal Gasification
  • Methane Pyrolysis

Low-carbon Hydrogen Market Energy Source Outlook (2022-2030)

  • Natural Gas
  • Solar
  • Wind
  • Hybrid
  • Biomass
  • Geothermal
  • Hydro Energy
  • Tidal

Low-carbon Hydrogen Market End-Product Outlook (2022-2030)

  • Hydrogen
  • Ammonia
  • Liquified Hydrogen
  • Methane
  • Methanol

Low-carbon Hydrogen Market Technology Outlook (2022-2030)

  • Natural Gas W/O CCUS
  • Natural Gas W CCUS
  • Coal W/O CCUS
  • Coal W CCUS
  • Onshore Wind
  • Offshore Wind
  • Solar PV
  • Nuclear

Scope

The report includes –

  • Low-carbon hydrogen market study at the global level, and at a key country level covering eleven key countries in depth.
  • Key growth drivers and challenges at the global level.
  • Low-carbon hydrogen production capacity globally and country-wise.
  • Hydrogen policy analysis in each of the key countries
  • Low hydrogen carbon and electrolyser data analysis globally and in each of the key countries
  • Key participants in each region.

Key Players

RWE AG
NV Nederlandse Gasunie
European Energy AS
Orsted AS
DH2 Energy SAS
Copenhagen Infrastructure Partners Inc
The ERM Group Inc
Uniper SE
Air
Liquide SA
Equinor ASA
Green Hydrogen International
Total Eren SA
Linde plc
Humboldt Hidrogeno Verde
Enegix Energy Pty Ltd
Proton Ventures BV
Casa dos Ventos Energias Renovaveis SA
Air Products and Chemicals Inc
Clean Hydrogen Works
Exxon Mobil Corp
Intercontinental Energy Corp
Fortescue Future Industries Pty Ltd
Province Resources Ltd
Woodside Energy Group Ltd
Beijing Jingneng Power Co Ltd
Elixir Energy Ltd
Stanwell Corp Ltd
Aqua Aerem Pty Ltd
H2U Group
SEDC Energy Sdn Bhd

Table of Contents

About GlobalData

Table of Contents

1 Executive Summary

2 Introduction

2.1 Hydrogen, Overview

2.2 History of Hydrogen

2.3 Hydrogen, Colours of Hydrogen

Brown Hydrogen

Grey Hydrogen

Blue Hydrogen

Green Hydrogen

Purple Hydrogen

Turquoise Hydrogen

2.4 Hydrogen Production Process

Steam Methane Reforming

Coal Gasification

Electrolysis

2.5 Hydrogen, Market by End-Users

Refining

Chemicals

Steel

Power Generation

Transportation

Buildings (Heating)

2.6 Hydrogen Market, Global, Value Chain

Energy Input

Production

Transport

Storage

End-User

3 Hydrogen Market, Global

3.1 Hydrogen Market, Global, Production

3.2 Hydrogen Demand, Global

Global Pure Hydrogen Demand

Global Hydrogen Production in the Sustainable Development Scenario

3.3 Hydrogen Cost

Hydrogen Production Cost by Technology

Cost Factors

Scaling Up Electrolysers

Green Hydrogen Competitiveness

Hydrogen Cost Reduction by 2030

3.4 Competitive Landscape

Major Participants in the Hydrogen Value Chain

3.5 Hydrogen Market, Global, Major Deals, and Key Milestones

Major Deals

Major Milestones

3.6 Hydrogen Market, Global, Key Trends

Key Market Trends

Macroeconomic Trends

Regulatory trends

3.7 Hydrogen Market, Global, Market Forces Analysis

Drivers

Restraints

Challenges

4 Low-Carbon Hydrogen Market, Global

4.1 Low-Carbon Hydrogen Market, Global, Snapshot

4.2 Low-Carbon Hydrogen Market, Global, Production

4.3 Low-Carbon Hydrogen Market, Global, Production Capacity Forecast

Low – Carbon Hydrogen Market, Global, Production Capacity Forecast by Process

Low – Carbon Hydrogen Market, Global, Production Capacity Forecast by Energy Source

Low – Carbon Hydrogen Market, Global, Production Capacity Forecast by End Product

Low – Carbon Hydrogen Market, Global, Production Capacity Forecast by Plant Type

4.4 Low-Carbon Hydrogen Market, Global, Project Status

4.5 Electrolyser Capacity, Global, Production Capacity Forecast

Electrolyser Capacity, Global, Production Capacity Forecast by Energy Source

Electrolyser Capacity, Global, Production Capacity Forecast by End Product

4.6 Electrolyser Capacity, Global, Project Status

4.7 Key Market Participants, Global

5 Low-Carbon Hydrogen Market, Americas

5.1 Hydrogen Market, Americas, Overview

5.2 Hydrogen Market, Americas, Policy Landscape

5.3 Low-Carbon Hydrogen Capacity, Americas, Snapshot

5.4 Low-Carbon Hydrogen Market, Americas, Production Capacity Forecast

Low – Carbon Hydrogen Market, Americas, Production Capacity Forecast by Process

Low – Carbon Hydrogen Market, Americas, Production Capacity Forecast by Energy Source

Low – Carbon Hydrogen Market, Americas, Production Capacity Forecast by End Product

Low – Carbon Hydrogen Market, Americas, Production Capacity Forecast by Plant Type

5.5 Low-Carbon Hydrogen Market, Americas, Project Status

5.6 Electrolyser Capacity, Americas, Production Capacity Forecast

Electrolyser Capacity, Americas, Production Capacity Forecast by Energy Source

Electrolyser Capacity, Americas, Production Capacity Forecast by End Product

5.7 Electrolyser Capacity, Americas, Project Status

5.8 Low-Carbon Hydrogen Capacity, Americas, Key Market Participants

5.9 Low-Carbon Hydrogen Capacity, Americas, Company Profiles

Green Hydrogen International

Air Products and Chemicals Inc

Clean Hydrogen Works

Linde Plc (Linde)

ExxonMobil Corporation

Total Eren SA

Humboldt Hidrogeno Verde

Enegix Energy Pty Ltd

Proton Ventures BV

Casa dos Ventos Energias Renovaveis SA

6 Low-Carbon Hydrogen Market, Europe

6.1 Hydrogen Market, Europe, Overview

6.2 Hydrogen Market, Europe, Policy Landscape

Road Map to 2050

European Green Deal Investment Plan

Effect of Russia – Ukraine crisis on Europe Hydrogen Sector

6.3 Low-Carbon Hydrogen Capacity, Europe, Snapshot

6.4 Low-Carbon Hydrogen Market, Europe, Production Capacity Forecast

Low – Carbon Hydrogen Market, Europe, Production Capacity Forecast by Process

Low – Carbon Hydrogen Market, Europe, Production Capacity Forecast by Energy Source

Low – Carbon Hydrogen Market, Europe, Production Capacity Forecast by End Product

Low – Carbon Hydrogen Market, Europe, Production Capacity Forecast by Plant Type

6.5 Low-Carbon Hydrogen Market, Europe, Project Status

6.6 Electrolyser Capacity, Europe, Production Capacity Forecast

Electrolyser Capacity, Europe, Production Capacity Forecast by Energy Source

Electrolyser Capacity, Europe, Production Capacity Forecast by End Product

6.7 Electrolyser Capacity, Europe, Project Status

6.8 Low-Carbon Hydrogen Capacity, Europe, Key Market Participants

6.9 Low-Carbon Hydrogen Capacity, Europe, Company Profiles

RWE AG

N.V. Nederlandse Gasunie

European Energy AS

Orsted AS

Air Liquide SA

DH2 Energy SAS

Copenhagen Infrastructure Partners Inc

The ERM Group Inc

Uniper SE

Equinor ASA

7 Low-Carbon Hydrogen Market, Asia Pacific

7.1 Hydrogen Market, Asia Pacific, Overview

7.2 Hydrogen Market, Asia Pacific, Policy Landscape

7.3 Low-Carbon Hydrogen Capacity, Asia Pacific, Snapshot

7.4 Low-Carbon Hydrogen Market, Asia Pacific, Production Capacity Forecast

Low – Carbon Hydrogen Market, Asia Pacific, Production Capacity Forecast by Process

Low – Carbon Hydrogen Market, Asia Pacific, Production Capacity Forecast by Energy Source

Low – Carbon Hydrogen Market, Asia Pacific, Production Capacity Forecast by End Product

Low – Carbon Hydrogen Market, Asia Pacific, Production Capacity Forecast by Plant Type

7.5 Low-Carbon Hydrogen Market, Asia Pacific, Project Status

7.6 Electrolyser Capacity, Asia Pacific, Production Capacity Forecast

Electrolyser Capacity, Asia Pacific, Production Capacity Forecast by Energy Source

Electrolyser Capacity, Asia Pacific, Production Capacity Forecast by End Product

7.7 Electrolyser Capacity, Asia Pacific, Project Status

7.8 Low-Carbon Hydrogen Capacity, Asia Pacific, Key Market Participants

7.9 Low-Carbon Hydrogen Capacity, Asia Pacific, Company Profiles

InterContinental Energy Corp

Fortescue Future Industries Pty Ltd

Province Resources Ltd

Woodside Energy Group Ltd

Beijing Jingneng Power Co Ltd

Elixir Energy Ltd

Stanwell Corp Ltd

Aqua Aerem Pty Ltd

H2U Group

SEDC Energy Sdn Bhd

8 Low Carbon Hydrogen Market, US

8.1 Hydrogen Market, US, Overview

8.2 Low-Carbon Hydrogen Capacity, US, Snapshot

8.3 Low-Carbon Hydrogen Market, US, Production Capacity Forecast

Low – Carbon Hydrogen Market, US, Production Capacity Forecast by Process

Low – Carbon Hydrogen Market, US, Production Capacity Forecast by Energy Source

Low – Carbon Hydrogen Market, US, Production Capacity Forecast by End Product

Low – Carbon Hydrogen Market, US, Production Capacity Forecast by Plant Type

8.4 Low-Carbon Hydrogen Market, US, Project Status

8.5 Electrolyser Capacity, US, Production Capacity Forecast

Electrolyser Capacity, US, Production Capacity Forecast by Energy Source

Electrolyser Capacity, US, Production Capacity Forecast by End Product

8.6 Electrolyser Capacity, US, Project Status

9 Low Carbon Hydrogen Market, Canada

9.1 Hydrogen Market, Canada, Overview

9.2 Low-Carbon Hydrogen Capacity, Canada, Snapshot

9.3 Low-Carbon Hydrogen Market, Canada, Production Capacity Forecast

Low – Carbon Hydrogen Market, Canada, Production Capacity Forecast by Process

Low – Carbon Hydrogen Market, Canada, Production Capacity Forecast by Energy Source

Low – Carbon Hydrogen Market, Canada, Production Capacity Forecast by End Product

Low – Carbon Hydrogen Market, Canada, Production Capacity Forecast by Plant Type

9.4 Low-Carbon Hydrogen Market, Canada, Project Status

9.5 Electrolyser Capacity, Canada, Production Capacity Forecast

Electrolyser Capacity, Canada, Production Capacity Forecast by Energy Source

Electrolyser Capacity, Canada, Production Capacity Forecast by End Product

9.6 Electrolyser Capacity, Canada, Project Status

10 Low Carbon Hydrogen Market, Germany

10.1 Hydrogen Market, Germany, Overview

10.2 Low-Carbon Hydrogen Capacity, Germany, Snapshot

10.3 Low-Carbon Hydrogen Market, Germany, Production Capacity Forecast

Low – Carbon Hydrogen Market, Germany, Production Capacity Forecast by Process

Low – Carbon Hydrogen Market, Germany, Production Capacity Forecast by Energy Source

Low – Carbon Hydrogen Market, Germany, Production Capacity Forecast by End Product

Low – Carbon Hydrogen Market, Germany, Production Capacity Forecast by Plant Type

10.4 Low-Carbon Hydrogen Market, Germany, Project Status

10.5 Electrolyser Capacity, Germany, Production Capacity Forecast

Electrolyser Capacity, Germany, Production Capacity Forecast by Energy Source

Electrolyser Capacity, Germany, Production Capacity Forecast by End Product

10.6 Electrolyser Capacity, Germany, Project Status

11 Low Carbon Hydrogen Market, France

11.1 Hydrogen Market, France, Overview

11.2 Low-Carbon Hydrogen Capacity, France, Snapshot

11.3 Low-Carbon Hydrogen Market, France, Production Capacity Forecast

Low – Carbon Hydrogen Market, France, Production Capacity Forecast by Process

Low – Carbon Hydrogen Market, France, Production Capacity Forecast by Energy Source

Low – Carbon Hydrogen Market, France, Production Capacity Forecast by End Product

Low – Carbon Hydrogen Market, France, Production Capacity Forecast by Plant Type

11.4 Low-Carbon Hydrogen Market, France, Project Status

11.5 Electrolyser Capacity, France, Production Capacity Forecast

Electrolyser Capacity, France, Production Capacity Forecast by Energy Source

Electrolyser Capacity, France, Production Capacity Forecast by End Product

11.6 Electrolyser Capacity, France, Project Status

12 Low Carbon Hydrogen Market, Spain

12.1 Hydrogen Market, Spain, Overview

12.2 Low-Carbon Hydrogen Capacity, Spain, Snapshot

12.3 Low-Carbon Hydrogen Market, Spain, Production Capacity Forecast

Low – Carbon Hydrogen Market, Spain, Production Capacity Forecast by Process

Low – Carbon Hydrogen Market, Spain, Production Capacity Forecast by Energy Source

Low – Carbon Hydrogen Market, Spain, Production Capacity Forecast by End Product

Low – Carbon Hydrogen Market, Spain, Production Capacity Forecast by Plant Type

12.4 Low-Carbon Hydrogen Market, Spain, Project Status

12.5 Electrolyser Capacity, Spain, Production Capacity Forecast

Electrolyser Capacity, Spain, Production Capacity Forecast by Energy Source

Electrolyser Capacity, Spain, Production Capacity Forecast by End Product

12.6 Electrolyser Capacity, Spain, Project Status

13 Low Carbon Hydrogen Market, Portugal

13.1 Hydrogen Market, Portugal, Overview

13.2 Low-Carbon Hydrogen Capacity, Portugal, Snapshot

13.3 Low-Carbon Hydrogen Market, Portugal, Production Capacity Forecast

Low – Carbon Hydrogen Market, Portugal, Production Capacity Forecast by Process

Low – Carbon Hydrogen Market, Portugal, Production Capacity Forecast by Energy Source

Low – Carbon Hydrogen Market, Portugal, Production Capacity Forecast by End Product

Low – Carbon Hydrogen Market, Portugal, Production Capacity Forecast by Plant Type

13.4 Low-Carbon Hydrogen Market, Portugal, Project Status

13.5 Electrolyser Capacity, Portugal, Production Capacity Forecast

Electrolyser Capacity, Portugal, Production Capacity Forecast by Energy Source

Electrolyser Capacity, Portugal, Production Capacity Forecast by End Product

13.6 Electrolyser Capacity, Portugal, Project Status

14 Low Carbon Hydrogen Market, China

14.1 Hydrogen Market, China, Overview

14.2 Low-Carbon Hydrogen Capacity, China, Snapshot

14.3 Low-Carbon Hydrogen Market, China, Production Capacity Forecast

Low – Carbon Hydrogen Market, China, Production Capacity Forecast by Process

Low – Carbon Hydrogen Market, China, Production Capacity Forecast by Energy Source

Low – Carbon Hydrogen Market, China, Production Capacity Forecast by End Product

Low – Carbon Hydrogen Market, China, Production Capacity Forecast by Plant Type

14.4 Low-Carbon Hydrogen Market, China, Project Status

14.5 Electrolyser Capacity, China, Production Capacity Forecast

Electrolyser Capacity, China, Production Capacity Forecast by Energy Source

Electrolyser Capacity, China, Production Capacity Forecast by End Product

14.6 Electrolyser Capacity, China, Project Status

15 Low Carbon Hydrogen Market, Japan

15.1 Hydrogen Market, Japan, Overview

15.2 Low-Carbon Hydrogen Capacity, Japan, Snapshot

15.3 Low-Carbon Hydrogen Market, Japan, Production Capacity Forecast

Low – Carbon Hydrogen Market, Japan, Production Capacity Forecast by Process

Low – Carbon Hydrogen Market, Japan, Production Capacity Forecast by Energy Source

Low – Carbon Hydrogen Market, Japan, Production Capacity Forecast by End Product

Low – Carbon Hydrogen Market, Japan, Production Capacity Forecast by Plant Type

15.4 Low-Carbon Hydrogen Market, Japan, Project Status

15.5 Electrolyser Capacity, Japan, Production Capacity Forecast

Electrolyser Capacity, Japan, Production Capacity Forecast by Energy Source

Electrolyser Capacity, Japan, Production Capacity Forecast by End Product

15.6 Electrolyser Capacity, Japan, Project Status

16 Low Carbon Hydrogen Market, Australia

16.1 Hydrogen Market, Australia, Overview

16.2 Low-Carbon Hydrogen Capacity, Australia, Snapshot

16.3 Low-Carbon Hydrogen Market, Australia, Production Capacity Forecast

Low – Carbon Hydrogen Market, Australia, Production Capacity Forecast by Process

Low – Carbon Hydrogen Market, Australia, Production Capacity Forecast by Energy Source

Low – Carbon Hydrogen Market, Australia, Production Capacity Forecast by End Product

Low – Carbon Hydrogen Market, Australia, Production Capacity Forecast by Plant Type

16.4 Low-Carbon Hydrogen Market, Australia, Project Status

16.5 Electrolyser Capacity, Australia, Production Capacity Forecast

Electrolyser Capacity, Australia, Production Capacity Forecast by Energy Source

Electrolyser Capacity, Australia, Production Capacity Forecast by End Product

16.6 Electrolyser Capacity, Australia, Project Status

17 Low Carbon Hydrogen Market, South Korea

17.1 Hydrogen Market, South Korea, Overview

17.2 Low-Carbon Hydrogen Capacity, South Korea, Snapshot

17.3 Low-Carbon Hydrogen Market, South Korea, Production Capacity Forecast

Low – Carbon Hydrogen Market, South Korea, Production Capacity Forecast by Process

Low – Carbon Hydrogen Market, South Korea, Production Capacity Forecast by Energy Source

Low – Carbon Hydrogen Market, South Korea, Production Capacity Forecast by End Product

Low – Carbon Hydrogen Market, South Korea, Production Capacity Forecast by Plant Type

17.4 Low-Carbon Hydrogen Market, South Korea, Project Status

17.5 Electrolyser Capacity, South Korea, Production Capacity Forecast

Electrolyser Capacity, South Korea, Production Capacity Forecast by Energy Source

Electrolyser Capacity, South Korea, Production Capacity Forecast by End Product

17.6 Electrolyser Capacity, South Korea, Project Status

18 Low Carbon Hydrogen Market, India

18.1 Hydrogen Market, India, Overview

18.2 Low-Carbon Hydrogen Capacity, India, Snapshot

18.3 Low-Carbon Hydrogen Market, India, Production Capacity Forecast

Low – Carbon Hydrogen Market, India, Production Capacity Forecast by Process

Low – Carbon Hydrogen Market, India, Production Capacity Forecast by Energy Source

Low – Carbon Hydrogen Market, India, Production Capacity Forecast by End Product

Low – Carbon Hydrogen Market, India, Production Capacity Forecast by Plant Type

18.4 Low-Carbon Hydrogen Market, India, Project Status

18.5 Electrolyser Capacity, India, Production Capacity Forecast

Electrolyser Capacity, India, Production Capacity Forecast by Energy Source

Electrolyser Capacity, India, Production Capacity Forecast by End Product

18.6 Electrolyser Capacity, India, Project Status

19 Appendix

19.1 Abbreviations

19.2 Methodology

Coverage

Secondary Research

Primary Research

Modelling and Forecasting

Contact Us

Table

Table 1: CCS Projects in Operation

Table 2: Hydrogen, Routes for Low-Carbon Hydrogen Production

Table 3: Hydrogen Production

Table 4: Hydrogen, Routes of Hydrogen in Heating Supply in Buildings

Table 5: Hydrogen, Key Participants in the Hydrogen Value Chain

Table 6: Hydrogen, Deals

Table 7: Hydrogen Milestones

Table 8: Hydrogen, Market Trends

Table 9: Hydrogen, Macroeconomic Trends

Table 10: Hydrogen, Regulatory Trends

Table 11: Americas, Hydrogen, Policy Landscape

Table 12: Green Hydrogen International

Table 13: Air Products and Chemicals Inc

Table 14: Clean Hydrogen Works

Table 15: Linde Plc

Table 16: ExxonMobil Corporation

Table 17: Total Eren SA (Total Eren)

Table 18: Humboldt Hidrogeno Verde

Table 19: Enegix Energy Pty Ltd

Table 20: Proton Ventures BV

Table 21: Casa dos Ventos Energias Renovaveis SA

Table 22: Europe, Hydrogen, Policy Landscape

Table 23: RWE AG

Table 24: N.V. Nederlandse Gasunie

Table 25: European Energy AS

Table 26: Orsted AS

Table 27: Air Liquide SA

Table 28: DH2 Energy SAS

Table 29: Copenhagen Infrastructure Partners Inc

Table 30: The ERM Group Inc

Table 31: Uniper SE

Table 32: Equinor ASA

Table 33: Asia-Pacific, Hydrogen, Policy Landscape

Table 34: InterContinental Energy Corp.

Table 35: Fortescue Future Industries Pty Ltd

Table 36: Province Resources Ltd

Table 37: Woodside Energy Group Ltd

Table 38: Beijing Jingneng Power Co Ltd.

Table 39: Elixir Energy Ltd

Table 40: Stanwell Corp Ltd

Table 41: Aqua Aerem Pty Ltd

Table 42: H2U Group

Table 43: SEDC Energy Sdn Bhd

Table 44: US Hydrogen Road Map

Table 45: Abbreviations

Figures

Figure 1: Hydrogen, Colors of Hydrogen

Figure 2: Hydrogen, Steam Methane Reforming Process

Figure 3: Hydrogen, Coal Gasification Process

Figure 4: Hydrogen, Working Principles of Electrolysis

Figure 5: Hydrogen, Energy Value Chain

Figure 6: Hydrogen, Storage

Figure 7: Global, Hydrogen Production by Source, 2021

Figure 8: Global, Pure Hydrogen Demand, 2000–21

Figure 9: Global, Hydrogen Demand by Sector, Sustainable Development Scenario, 2030–70

Figure 10: Global, Hydrogen Market, Average Hydrogen Production Cost by Technology

Figure 11: Global, Hydrogen Market, Drivers, Restraints, and Challenges

Figure 12: Global Low Carbon Hydrogen Market, Snapshot, 2023

Figure 13: Global, Low-Carbon Hydrogen Production (Mt/year), 2014–21

Figure 14: Global, Low-Carbon Hydrogen Production Capacity (ktpa), 2022–30

Figure 15: Global, Low – Carbon Hydrogen Market, Active Production Capacity by Region (As of February 2023)

Figure 16: Global, Low – Carbon Hydrogen Market, Active Production Capacity by Country (As of February 2023)

Figure 17: Global, Low – Carbon Hydrogen Capacity, by Process (%) (As of February 2023)

Figure 18: Global, Low – Carbon Hydrogen Capacity, by Energy Source (%) (As of February 2023)

Figure 19: Global, Low – Carbon Hydrogen Capacity, by End Product (%) (As of February 2023)

Figure 20: Global, Low – Carbon Hydrogen Capacity, by Plant Type (%) (As of February 2023)

Figure 21: Global, Low – Carbon Hydrogen Market, Capacity by Status and Number of Projects (As of February 2023)

Figure 22: Global, Low – Carbon Hydrogen Market, Pipeline Capacity by Development Stage and Number of Projects (As of February 2023)

Figure 23: Global, Electrolyser Capacity (GW/yr), 2023–30

Figure 24: Global, Electrolyser Capacity, by Energy Source (%) (As of February 2023)

Figure 25: Global, Electrolyser Capacity, by End Product (%) (As of February 2023)

Figure 26: Global, Electrolyser Capacity by Status and Number of Projects (As of February 2023)

Figure 27: Global, Electrolyser Capacity and Number of Projects in Pipeline (As of February 2023)

Figure 28: Global, Low- Carbon Hydrogen, Key Market Players

Figure 29: Global, Electrolyser, Key Market Players

Figure 30: Americas, Low Carbon Hydrogen Market, Snapshot

Figure 31: Americas, Low-Carbon Hydrogen Production Capacity (ktpa), 2022–30

Figure 32: Americas, Low – Carbon Hydrogen, Active Production Capacity (As of February 2023)

Figure 33: Americas, Low – Carbon Hydrogen, Announced Production Capacity (As of February 2023)

Figure 34: Americas, Low – Carbon Hydrogen, Planned Production Capacity (As of February 2023)

Figure 35: Americas, Low – Carbon Hydrogen Capacity, by Process (%) (As of February 2023)

Figure 36: Americas, Low – Carbon Hydrogen Capacity, by Energy Source (%) (As of February 2023)

Figure 37: Americas, Low – Carbon Hydrogen Capacity, by End Product (%) (As of February 2023)

Figure 38: Americas, Low – Carbon Hydrogen Capacity, by Plant Type (%) (As of February 2023)

Figure 39: Americas, Low – Carbon Hydrogen, Capacity by Status and Number of Projects (As of February 2023)

Figure 40: Americas, Low – Carbon Hydrogen, Pipeline Capacity by Development Stage and Number of Projects (As of February 2023)

Figure 41: Americas, Electrolyser Capacity (GW/yr), 2023–30

Figure 42: Americas, Electrolyser Capacity, by Energy Source (%) (As of February 2023)

Figure 43: Americas, Electrolyser Capacity, by End Product (%) (As of February 2023)

Figure 44: Americas, Electrolyser Capacity by Status and Number of Projects (As of February 2023)

Figure 45: Americas, Electrolyser, Pipeline Capacity and Number of Projects (As of February 2023)

Figure 46: Americas, Low- Carbon Hydrogen, Key Market Players

Figure 47: Americas, Electrolyser, Key Market Players

Figure 48: Europe, European Hydrogen Green Deal Timeline

Figure 49: Europe, Low Carbon Hydrogen Market, Snapshot

Figure 50: Europe, Low-Carbon Hydrogen Production Capacity (ktpa), 2022–30

Figure 51: Europe, Low – Carbon Hydrogen, Active Production Capacity (As of February 2023)

Figure 52: Europe, Low – Carbon Hydrogen, Announced Production Capacity (As of February 2023)

Figure 53: Europe, Low – Carbon Hydrogen, Planned Production Capacity (As of February 2023)

Figure 54: Europe, Low – Carbon Hydrogen Capacity, by Process (%) (As of February 2023)

Figure 55: Europe, Low – Carbon Hydrogen Capacity, by Energy Source (%) (As of February 2023)

Figure 56: Europe, Low – Carbon Hydrogen Capacity, by End Product (%) (As of February 2023)

Figure 57: Europe, Low – Carbon Hydrogen Capacity, by Plant Type (%) (As of February 2023)

Figure 58: Europe Low – Carbon Hydrogen, Capacity by Status and Number of Projects (As of February 2023)

Figure 59: Europe, Low – Carbon Hydrogen, Pipeline Capacity by Development Stage and Number of Projects (As of February 2023)

Figure 60: Europe, Electrolyser Capacity (GW/yr), 2023–30

Figure 61: Europe, Electrolyser Capacity, by Energy Source (%) (As of February 2023)

Figure 62: Europe, Electrolyser Capacity, by End Product (%) (As of February 2023)

Figure 63: Europe, Electrolyser Capacity by Status and Number of Projects (As of February 2023)

Figure 64: Europe, Electrolyser, Pipeline Capacity and Number of Projects (As of February 2023)

Figure 65: Europe, Low- Carbon Hydrogen, Key Market Players

Figure 66: Europe, Electrolyser, Key Market Players

Figure 67: Asia Pacific, Low Carbon Hydrogen Market, Snapshot

Figure 68: Asia Pacific, Low-Carbon Hydrogen Production Capacity (ktpa), 2022–30

Figure 69: Asia Pacific, Low – Carbon Hydrogen, Active Production Capacity (As of February 2023)

Figure 70: Asia Pacific, Low – Carbon Hydrogen, Announced Production Capacity (As of February 2023)

Figure 71: Asia Pacific, Low – Carbon Hydrogen, Planned Production Capacity (As of February 2023)

Figure 72: Asia Pacific, Low – Carbon Hydrogen Capacity, by Process (%) (As of February 2023)

Figure 73: Asia Pacific, Low – Carbon Hydrogen Capacity, by Energy Source (%) (As of February 2023)

Figure 74: Asia Pacific, Low – Carbon Hydrogen Capacity, by End Product (%) (As of February 2023)

Figure 75: Asia Pacific, Low – Carbon Hydrogen Capacity, by Plant Type (%) (As of February 2023)

Figure 76: Asia Pacific, Low – Carbon Hydrogen, Capacity by Status and Number of Projects (As of February 2023)

Figure 77: Asia Pacific, Low – Carbon Hydrogen, Pipeline Capacity by Development Stage and Number of Projects (As of February 2023)

Figure 78: Asia Pacific, Electrolyser Capacity (GW/yr), 2023–30

Figure 79: Asia Pacific, Electrolyser Capacity, by Energy Source (%) (As of February 2023)

Figure 80: Asia Pacific, Electrolyser Capacity, by End Product (%) (As of February 2023)

Figure 81: Asia Pacific, Electrolyser Capacity by Status and Number of Projects (As of February 2023)

Figure 82: Asia Pacific, Electrolyser, Pipeline Capacity and Number of Projects (As of February 2023)

Figure 83: Asia Pacific, Low- Carbon Hydrogen, Key Market Players

Figure 84: Asia Pacific, Electrolyser, Key Market Players

Figure 85: US, Low Carbon Hydrogen Market, Snapshot

Figure 86: US, Low-Carbon Hydrogen Production Capacity (ktpa), 2022–30

Figure 87: US, Low – Carbon Hydrogen Capacity, by Process (%) (As of February 2023)

Figure 88: US, Low – Carbon Hydrogen Capacity, by Energy Source (%) (As of February 2023)

Figure 89: US, Low – Carbon Hydrogen Capacity, by End Product (%) (As of February 2023)

Figure 90: US, Low – Carbon Hydrogen Capacity, by Plant Type (%) (As of February 2023)

Figure 91: US, Low – Carbon Hydrogen, Capacity by Status and Number of Projects (As of February 2023)

Figure 92: US, Low – Carbon Hydrogen, Pipeline Capacity by Development Stage and Number of Projects (As of February 2023)

Figure 93: US, Electrolyser Capacity (GW/yr), 2023–30

Figure 94: US, Electrolyser Capacity, by Energy Source (%) (As of February 2023)

Figure 95: US, Electrolyser Capacity, by End Product (%) (As of February 2023)

Figure 96: US, Electrolyser Capacity by Status and Number of Projects (As of February 2023)

Figure 97: US, Electrolyser, Pipeline Capacity and Number of Projects (As of February 2023)

Figure 98: Canada, Low Carbon Hydrogen Market, Snapshot

Figure 99: Canada, Low-Carbon Hydrogen Production Capacity (ktpa), 2022–30

Figure 100: Canada, Low – Carbon Hydrogen Capacity, by Process (%) (As of February 2023)

Figure 101: Canada, Low – Carbon Hydrogen Capacity, by Energy Source (%) (As of February 2023)

Figure 102: Canada, Low – Carbon Hydrogen Capacity, by End Product (%) (As of February 2023)

Figure 103: Canada, Low – Carbon Hydrogen Capacity, by Plant Type (%) (As of February 2023)

Figure 104: Canada, Low – Carbon Hydrogen, Capacity by Status and Number of Projects (As of February 2023)

Figure 105: Canada, Low – Carbon Hydrogen, Pipeline Capacity by Development Stage and Number of Projects (As of February 2023)

Figure 106: Canada, Electrolyser Capacity (GW/yr), 2023–30

Figure 107: Canada, Electrolyser Capacity, by Energy Source (%) (As of February 2023)

Figure 108: Canada, Electrolyser Capacity, by End Product (%) (As of February 2023)

Figure 109: Canada, Electrolyser Capacity by Status and Number of Projects (As of February 2023)

Figure 110: Canada, Electrolyser, Pipeline Capacity and Number of Projects (As of February 2023)

Figure 111: Germany, Low Carbon Hydrogen Market, Snapshot

Figure 112: Germany, Low-Carbon Hydrogen Production Capacity (ktpa), 2022–30

Figure 113: Germany, Low – Carbon Hydrogen Capacity, by Process (%) (As of February 2023)

Figure 114: Germany, Low – Carbon Hydrogen Capacity, by Energy Source (%) (As of February 2023)

Figure 115: Germany, Low – Carbon Hydrogen Capacity, by End Product (%) (As of February 2023)

Figure 116: Germany, Low – Carbon Hydrogen Capacity, by Plant Type (%) (As of February 2023)

Figure 117: Germany, Low – Carbon Hydrogen, Capacity by Status and Number of Projects (As of February 2023)

Figure 118: Germany, Low – Carbon Hydrogen, Pipeline Capacity by Development Stage and Number of Projects (As of February 2023)

Figure 119: Germany, Electrolyser Capacity (GW/yr), 2023–30

Figure 120: Germany, Electrolyser Capacity, by Energy Source (%) (As of February 2023)

Figure 121: Germany, Electrolyser Capacity, by End Product (%) (As of February 2023)

Figure 122: Germany, Electrolyser Capacity by Status and Number of Projects (As of February 2023)

Figure 123: Germany, Electrolyser, Pipeline Capacity and Number of Projects (As of February 2023)

Figure 124: France, Low Carbon Hydrogen Market, Snapshot

Figure 125: France, Low-Carbon Hydrogen Production Capacity (ktpa), 2022–30

Figure 126: France, Low – Carbon Hydrogen Capacity, by Process (%) (As of February 2023)

Figure 127: France, Low – Carbon Hydrogen Capacity, by Energy Source (%) (As of February 2023)

Figure 128: France, Low – Carbon Hydrogen Capacity, by End Product (%) (As of February 2023)

Figure 129: France, Low – Carbon Hydrogen Capacity, by Plant Type (%) (As of February 2023)

Figure 130: France, Low – Carbon Hydrogen, Capacity by Status and Number of Projects (As of February 2023)

Figure 131: France, Low – Carbon Hydrogen, Pipeline Capacity by Development Stage and Number of Projects (As of February 2023)

Figure 132: France, Electrolyser Capacity (GW/yr), 2023–30

Figure 133: France, Electrolyser Capacity, by Energy Source (%) (As of February 2023)

Figure 134: France, Electrolyser Capacity, by End Product (%) (As of February 2023)

Figure 135: France, Electrolyser Capacity by Status and Number of Projects (As of February 2023)

Figure 136: France, Electrolyser, Pipeline Capacity and Number of Projects (As of February 2023)

Figure 137: Spain, Low Carbon Hydrogen Market, Snapshot

Figure 138: Spain, Low-Carbon Hydrogen Production Capacity (ktpa), 2022–30

Figure 139: Spain, Low – Carbon Hydrogen Capacity, by Process (%) (As of February 2023)

Figure 140: Spain, Low – Carbon Hydrogen Capacity, by Energy Source (%) (As of February 2023)

Figure 141: Spain, Low – Carbon Hydrogen Capacity, by End Product (%) (As of February 2023)

Figure 142: Spain, Low – Carbon Hydrogen Capacity, by Plant Type (%) (As of February 2023)

Figure 143: Spain, Low – Carbon Hydrogen, Capacity by Status and Number of Projects (As of February 2023)

Figure 144: Spain, Low – Carbon Hydrogen, Pipeline Capacity by Development Stage and Number of Projects (As of February 2023)

Figure 145: Spain, Electrolyser Capacity (GW/yr), 2023–30

Figure 146: Spain, Electrolyser Capacity, by Energy Source (%) (As of February 2023)

Figure 147: Spain, Electrolyser Capacity, by End Product (%) (As of February 2023)

Figure 148: Spain, Electrolyser Capacity by Status and Number of Projects (As of February 2023)

Figure 149: Spain, Electrolyser, Pipeline Capacity and Number of Projects (As of February 2023)

Figure 150: Portugal, Low Carbon Hydrogen Market, Snapshot

Figure 151: Portugal, Low-Carbon Hydrogen Production Capacity (ktpa), 2022–30

Figure 152: Portugal, Low – Carbon Hydrogen Capacity, by Process (%) (As of February 2023)

Figure 153: Portugal, Low – Carbon Hydrogen Capacity, by Energy Source (%) (As of February 2023)

Figure 154: Portugal, Low – Carbon Hydrogen Capacity, by End Product (%) (As of February 2023)

Figure 155: Portugal, Low – Carbon Hydrogen Capacity, by Plant Type (%) (As of February 2023)

Figure 156: Portugal, Low – Carbon Hydrogen, Capacity by Status and Number of Projects (As of February 2023)

Figure 157: Portugal, Low – Carbon Hydrogen, Pipeline Capacity by Development Stage and Number of Projects (As of February 2023)

Figure 158: Portugal, Electrolyser Capacity (GW/yr), 2023–30

Figure 159: Portugal, Electrolyser Capacity, by Energy Source (%) (As of February 2023)

Figure 160: Portugal, Electrolyser Capacity, by End Product (%) (As of February 2023)

Figure 161: Portugal, Electrolyser Capacity by Status and Number of Projects (As of February 2023)

Figure 162: Portugal, Electrolyser, Pipeline Capacity and Number of Projects (As of February 2023)

Figure 163: China, Low Carbon Hydrogen Market, Snapshot

Figure 164: China, Low-Carbon Hydrogen Production Capacity (ktpa), 2022–30

Figure 165: China, Low – Carbon Hydrogen Capacity, by Process (%) (As of February 2023)

Figure 166: China, Low – Carbon Hydrogen Capacity, by Energy Source (%) (As of February 2023)

Figure 167: China, Low – Carbon Hydrogen Capacity, by End Product (%) (As of February 2023)

Figure 168: China, Low – Carbon Hydrogen Capacity, by Plant Type (%) (As of February 2023)

Figure 169: China, Low – Carbon Hydrogen, Capacity by Status and Number of Projects (As of February 2023)

Figure 170: China, Low – Carbon Hydrogen, Pipeline Capacity by Development Stage and Number of Projects (As of February 2023)

Figure 171: China, Electrolyser Capacity (GW/yr), 2023–30

Figure 172: China, Electrolyser Capacity, by Energy Source (%) (As of February 2023)

Figure 173: China, Electrolyser Capacity, by End Product (%) (As of February 2023)

Figure 174: China, Electrolyser Capacity by Status and Number of Projects (As of February 2023)

Figure 175: China, Electrolyser, Pipeline Capacity and Number of Projects (As of February 2023)

Figure 176: Japan, Low Carbon Hydrogen Market, Snapshot

Figure 177: Japan, Low-Carbon Hydrogen Production Capacity (ktpa), 2022–30

Figure 178: Japan, Low – Carbon Hydrogen Capacity, by Process (%) (As of February 2023)

Figure 179: Japan, Low – Carbon Hydrogen Capacity, by Energy Source (%) (As of February 2023)

Figure 180: Japan, Low – Carbon Hydrogen Capacity, by End Product (%) (As of February 2023)

Figure 181: Japan, Low – Carbon Hydrogen Capacity, by Plant Type (%) (As of February 2023)

Figure 182: Japan, Low – Carbon Hydrogen, Capacity by Status and Number of Projects (As of February 2023)

Figure 183: Japan, Low – Carbon Hydrogen, Pipeline Capacity by Development Stage and Number of Projects (As of February 2023)

Figure 184: Japan, Electrolyser Capacity (GW/yr), 2023–30

Figure 185: Japan, Electrolyser Capacity, by Energy Source (%) (As of February 2023)

Figure 186: Japan, Electrolyser Capacity, by End Product (%) (As of February 2023)

Figure 187: Japan, Electrolyser Capacity by Status and Number of Projects (As of February 2023)

Figure 188: Japan, Electrolyser, Pipeline Capacity and Number of Projects (As of February 2023)

Figure 189: Australia, Low Carbon Hydrogen Market, Snapshot

Figure 190: Australia, Low-Carbon Hydrogen Production Capacity (ktpa), 2022–30

Figure 191: Australia, Low – Carbon Hydrogen Capacity, by Process (%) (As of February 2023)

Figure 192: Australia, Low – Carbon Hydrogen Capacity, by Energy Source (%) (As of February 2023)

Figure 193: Australia, Low – Carbon Hydrogen Capacity, by End Product (%) (As of February 2023)

Figure 194: Australia, Low – Carbon Hydrogen Capacity, by Plant Type (%) (As of February 2023)

Figure 195: Australia, Low – Carbon Hydrogen, Capacity by Status and Number of Projects (As of February 2023)

Figure 196: Australia, Low – Carbon Hydrogen, Pipeline Capacity by Development Stage and Number of Projects (As of February 2023)

Figure 197: Australia, Electrolyser Capacity (GW/yr), 2023–30

Figure 198: Australia, Electrolyser Capacity, by Energy Source (%) (As of February 2023)

Figure 199: Australia, Electrolyser Capacity, by End Product (%) (As of February 2023)

Figure 200: Australia, Electrolyser Capacity by Status and Number of Projects (As of February 2023)

Figure 201: Australia, Electrolyser, Pipeline Capacity and Number of Projects (As of February 2023)

Figure 202: South Korea, Low Carbon Hydrogen Market, Snapshot

Figure 203: South Korea, Low-Carbon Hydrogen Production Capacity (ktpa), 2022–30

Figure 204: South Korea, Low – Carbon Hydrogen Capacity, by Process (%) (As of February 2023)

Figure 205: South Korea, Low – Carbon Hydrogen Capacity, by Energy Source (%) (As of February 2023)

Figure 206: South Korea, Low – Carbon Hydrogen Capacity, by End Product (%) (As of February 2023)

Figure 207: South Korea, Low – Carbon Hydrogen Capacity, by Plant Type (%) (As of February 2023)

Figure 208: South Korea, Low – Carbon Hydrogen, Capacity by Status and Number of Projects (As of February 2023)

Figure 209: South Korea, Low – Carbon Hydrogen, Pipeline Capacity by Development Stage and Number of Projects (As of February 2023)

Figure 210: South Korea, Electrolyser Capacity (GW/yr), 2023–30

Figure 211: South Korea, Electrolyser Capacity, by Energy Source (%) (As of February 2023)

Figure 212: South Korea, Electrolyser Capacity, by End Product (%) (As of February 2023)

Figure 213: South Korea, Electrolyser Capacity by Status and Number of Projects (As of February 2023)

Figure 214: South Korea, Electrolyser, Pipeline Capacity and Number of Projects (As of February 2023)

Figure 215: India, Low Carbon Hydrogen Market, Snapshot

Figure 216: India, Low-Carbon Hydrogen Production Capacity (ktpa), 2022–30

Figure 217: India, Low – Carbon Hydrogen Capacity, by Process (%) (As of February 2023)

Figure 218: India, Low – Carbon Hydrogen Capacity, by Energy Source (%) (As of February 2023)

Figure 219: India, Low – Carbon Hydrogen Capacity, by End Product (%) (As of February 2023)

Figure 220: India, Low – Carbon Hydrogen Capacity, by Plant Type (%) (As of February 2023)

Figure 221: India, Low – Carbon Hydrogen, Capacity by Status and Number of Projects (As of February 2023)

Figure 222: India, Low – Carbon Hydrogen, Pipeline Capacity by Development Stage and Number of Projects (As of February 2023)

Figure 223: India, Electrolyser Capacity (GW/yr), 2023–30

Figure 224: India, Electrolyser Capacity, by Energy Source (%) (As of February 2023)

Figure 225: India, Electrolyser Capacity, by End Product (%) (As of February 2023)

Figure 226: India, Electrolyser Capacity by Status and Number of Projects (As of February 2023)

Figure 227: India, Electrolyser, Pipeline Capacity and Number of Projects (As of February 2023)

Frequently asked questions

Currency USD
$3,995

Can be used by individual purchaser only

$11,985

Can be shared globally by unlimited users within the purchasing corporation e.g. all employees of a single company


Undecided about purchasing this report?

Enquire Before Buying Request a Free Sample

Get in touch to find out about multi-purchase discounts

reportstore@globaldata.com
Tel +44 20 7947 2745

Every customer’s requirement is unique. With over 220,000 construction projects tracked, we can create a tailored dataset for you based on the types of projects you are looking for. Please get in touch with your specific requirements and we can send you a quote.

Sample Report

We are confident about Low-Carbon Hydrogen Market Size, Trends, Country Analysis, Production Process, Cost by Technology, Key Players and Forecast to 2030 report's unique quality. However, we want you to make the most beneficial decision for your business, so we offer free sample pages to help you:

  • Assess the relevance of the report
  • Evaluate the quality of the report
  • Justify the cost

Download your copy of the sample report and make an informed decision about whether the full report will provide you with the insights and information you need.

Below is a sample report to understand what you are buying

See what our customers are saying

“The GlobalData platform is our go-to tool for intelligence services. GlobalData provides an easy way to access comprehensive intelligence data around multiple sectors, which essentially makes it a one-for-all intelligence platform, for tendering and approaching customers.

GlobalData is very customer orientated, with a high degree of personalised services, which benefits everyday use. The highly detailed project intelligence and forecast reports can be utilised across multiple departments and workflow scopes, from operational to strategic level, and often support strategic decisions. GlobalData Analytics and visualisation solutions has contributed positively when preparing management presentations and strategic papers.”

Business Intelligence & Marketing Manager, SAL Heavy Lift

“COVID-19 has caused significant interference to our business and the COVID-19 intelligence from GlobalData has helped us reach better decisions around strategy. These two highlights have helped enormously to understand the projections into the future concerning our business units, we also utilise the project database to source new projects for Liebherr-Werk to use as an additional source to pitch for new business.”

Market Analyst & Management, Liebherr-Werk

Your daily news has saved me a lot of time and keeps me up-to-date with what is happening in the market, I like that you almost always have a link to the source origin. We also use your market data in our Strategic Business Process to support our business decisions. By having everything in one place on the Intelligence Center it has saved me a lot of time versus looking on different sources, the alert function also helps with this.

Head of Key Accounts, Saab AB

Having used several other market research companies, I find that GlobalData manages to provide that ‘difficult-to-get’ market data that others can’t, as well as very diverse and complete consumer surveys.

Marketing Intelligence Manager, Portugal Foods

Our experience with GlobalData has been very good, from the platform itself to the people. I find that the analysts and the account team have a high level of customer focus and responsiveness and therefore I can always rely on. The platform is more holistic than other providers. It is convenient and almost like a one stop shop. The pricing suite is highly competitive and value for our organisation.

I like reports that inform new segments such as the analysis on generation Z, millennials, the impact of COVID 19 to our banking customers and their new channel habits. Secondly the specialist insight on affluent sector significantly increases our understanding about this group of customers. The combination of those give us depth and breadth of the evolving market.

I’m in the business of answering and helping people make decisions so with the intelligence center I can do that, effectively and efficiently. I can share quickly key insights that answer and satisfy our country stakeholders by giving them many quality studies and primary research about competitive landscape beyond the outlook of our bank. It helps me be seen as an advisory partner and that makes a big difference. A big benefit of our subscription is that no one holds the whole data and because it allows so many people, so many different parts of our organisation have access, it enables all teams to have the same level of knowledge and decision support.

Head of Customer Insight and Research, Standard Chartered

“I know that I can always rely on Globaldata’s work when I’m searching for the right consumer and market insights. I use Globaldata insights to understand the changing market & consumer landscape and help create better taste & wellbeing solutions for our customers in food, beverage and healthcare industries.

Globaldata has the right data and the reports are of very high quality compared to your competitors. Globaldata not only has overall market sizes & consumer insights on food & beverages but also provides insights at the ingredient & flavour level. That is key for B2B companies like Givaudan. This way we understand our customers’ business and also gain insight to our unique industry”

Head of Consumer Sensory Insights, Givaudan

GlobalData provides a great range of information and reports on various sectors that is highly relevant, timely, easy to access and utilise.  The reports and data dashboards help engagement with clients; they provide valuable industry and market insights that can enrich client conversations and can help in the shaping of value propositions. Moreover, using GlobalData products has helped increase my knowledge of the finance sector, the players within it, and the general threats and opportunities.

I find the consumer surveys that are carried out to be extremely beneficial and not something I have seen anywhere else. They provided an insightful view of why and which consumers take (or don’t) particular financial products. This can help shape conversations with clients to ensure they make the right strategic decisions for their business.

One of the challenges I have found is that data in the payments space is often piecemeal. With GD all of the data I need is in one place, but it also comes with additional market reports that provide useful extra context and information. Having the ability to set-up alerts on relevant movements in the industry, be it competitors or customers, and have them emailed directly to me, ensures I get early sight of industry activity and don’t have to search for news.

Senior Account Manager, TSYS
Go even deeper with GlobalData Intelligence Center

Every Company Report we produce is powered by the GlobalData Intelligence Center.

Subscribing to our intelligence platform means you can monitor developments at Low-Carbon Hydrogen Market Size, Trends, Country Analysis, Production Process, Cost by Technology, Key Players and Forecast to 2030 in real time.

  • Access a live Low-Carbon Hydrogen Market Size, Trends, Country Analysis, Production Process, Cost by Technology, Key Players and Forecast to 2030 dashboard for 12 months, with up-to-the-minute insights.
  • Fuel your decision making with real-time deal coverage and media activity.
  • Turn insights on financials, deals, products and pipelines into powerful agents of commercial advantage.