Carbon and ecosystem programs have splashed onto the agricultural scene over the last couple years. These programs are still in their early stages and acreage enrollments are small relative to the US row crop sector, but the branding, financial, and political investment across supply chain players suggests they are here to stay.
Tracking core elements and features will help navigate the carbon jungle.
The question of “inset” or “offset” is about who is buying the credit.
Carbon credits are generated by a measurable reduction in greenhouse gas emissions (“GHGs”) or actual sequestration of atmospheric carbon into the soil.
In the following pages, this Carbon and Data Guidebook covers the basics of emerging carbon and ecosystem programs, their farm data needs, and how you can better position your farm operation for any program or precision ag initiative. HOUSE UNLOCK
ORGANIZE THE DATA
TO
It’s been nearly a decade since Monsanto announced its $1 Billion acquisition of Climate Corp. It’s been even longer for farmers waiting to realize the full yield and cost savings promises of precision ag, much less getting paid for their farm data. Sometimes progress is more of a slow march than a forward leap.
This area is moving so quickly that program overviews and summaries are nearly out of date by the time they go to print.
The carbon and ecosystem programs that have exploded onto the scene in the last couple years, however, are starting to look like the first real circumstance where good farm data converts into – or at least is required to access – hard dollars. Whether or not your farming operation is pursuing a carbon or conservation program, it’s time to take a harder look at how you are collecting, managing, and storing your farm data.
CARBON OR ECOSYSTEM SERVICES?
$$ FOR YOUR FARMING OPERATION
Today there is no single standard for defining carbon credits, so carbon credit buyers (usually large companies who have made public commitments to reducing their carbon footprints) largely decide the type and quality of the credits they are seeking. Carbon Registries, such as Verra and Climate Action Reserve, provide an oversight and audit function to “verify” the carbon credits.
WHO GETS THE CREDIT FOR THE CREDIT?
When a farm-generated carbon credit is sold to another party within the food and ag supply chain (e.g., a large food company), that’s an “inset” – the supply chain is reducing its own carbon footprint.
INSETS AND OFFSETS:
CARBON AND ECOSYSTEM PROGRAMS
When a farm-generated carbon credit sells to a party outside the food and ag supply chain (e.g., an oil & gas company), that’s an “offset” – the buyer is offsetting its activities with a carbon reduction from elsewhere.
Carbon sequestration (removing carbon from the atmosphere and storing in the soil) receives much of the “top-line” billing, but carbon programs actually fit within a broader context of “ecosystem services.” These “services” are using natural systems and agricultural practices and management to produce a variety of environmental outcomes like reduction in nutrient runoff, improving water quality, and erosion mitigation. Some programs like Soil & Water Outcomes Fund take an approach broader than just carbon. Expect this to happen more.


ADDITIONALITY AND PERMANENCE: ARE YOU SURE? If you’ve followed carbon offerings, you’ve undoubtedly heard these terms. Additionality: Creating a carbon credit requires doing something new or different. Why? Because carbon reduction is about reducing carbon emissions from a baseline. In the row crop sector the two biggest additional practices are reduced (or no) tillage and cover cropping. Additionality creates two tricky issues for row crop farmers:
MARKET, PROGRAM OR DATA PLATFORM?
Not all carbon programs or ecosystem programs function in the same way. The Illinois Sustainable Ag Partnership uses three categories to group emerging programs:
Programs, payments, verifiers and terms may all vary, but the starting point for any farm is farm records and farm data. Getting this right will decrease enrollment and reporting time, increase potential for payments, and lay the foundation for programs and income streams in the future.
1. Farmers who have long histories with cover cropping or reduced tillage struggle to get paid for their good stewardship because these practices are already their status quo; 2. Once a farmer has implemented reduced tillage and cover cropping on a field for a particular market, switching markets for a better payment opportunity may be difficult as the additional practice has already been provided to their original market.
Permanence: For carbon reduction to “count,” the reduction has to be permanent – sequestering carbon one year to just release it the next doesn’t reduce overall atmospheric carbon contributing to climate change. Hence the long-term, multi-year program commitments of various carbon offerings.
Markets: Providing the link between farm-generated credits and diverse buyers Input Providers: Programs offered by ag input providers and their distribution channels Data Platforms: Offerings focused on the underlying digital tools and data infrastructure for a variety of applications
The terms farm data and farm record overlap and are frequently used interchangeably, and with good reason: there’s no “official” definition for either. Let’s assume farm record is simply a written record of a farming activity or attribute and farm data is a numerically-organized farm record. Are we splitting hairs? Probably a little, but here’s the point: Today, enrolling in carbon programs requires organized (or producible) farm records, not thumb drives or cloud folders of years of shape files. Plan on 3-5 years of historical records, depending on your crop rotation.
required
FIELD HISTORY REPORTS
Farm data, big data, clean data, precision data… you’re not alone if you feel like there are times when the industry talks more about the data than the farming practices underlying it!
HISTORICAL FARM RECORDS FARM DATA FIELD NOTES FIELDELECTRONICINORGANIZEDHANDWRITTENANDRECORDSRECORDSEXCELORWORDRECORDS THE ORIGINAL
Some programs use historical satellite imagery and analytics to pre-populate data (like crop rotation), while others might provide a formatted Excel sheet to fill in, an on-line portal with drop-down options, or a live consultant to talk through your field history. The key is to have – or prepare – detailed and accessible historical records. In these early stages, most programs will “work with what you’ve got.”
purposes: 1. Documentation
STORAGE (YOUR
The farm records required to determine program eligibility and enrollment can typically be provided a number of formats and the information needed is outlined in greater detail on the Farm Data Checklist. DATA MEMORY) FROM MANAGEMENTEXISTINGSYSTEMS
practices 2. Data input for calculating carbon credits generated 3. Training and improving carbon models
three
verification)
in
FARM DATA OR FARM RECORD?
The
The implementation of data-rich precision ag tools to generate yield increases and costs savings has not been an overnight success. But the industry has certainly made headway, especially in the last decade. farm data related to carbon and ecosystem market programs is used for fundamental (and of farming


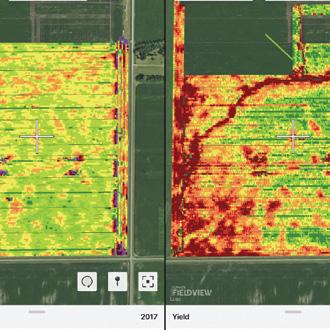

A PDF of a yield map, or a print-out that’s been scanned? It’s a digitized record – a digitized version of a hardcopy that lacks the data richness of the original source. It’s kind of like the difference between a document available as a Microsoft Word file vs. a picture of that document – one can be edited and has the richness of the original work, and one does not.
of forms (Shape files are the best known, but there are a multitude of file formats, some proprietary, depending on your equipment, monitors, and controllers.)
While all of these digital records exist today, systems inoperability, data compatibility, and file access across partners and service providers continue to pose challenges in bringing it all together. But the industry is getting closer.
A common complaint is that carbon programs aren’t paying enough today. Farmers can help the business model by having organized, easy-to-share records. Business models might support high-touch field reps to get your farm data during a ramp-up period, but that comes at a significant cost to those programs and those are dollars that could be paid to growers instead.
*BoundarySoilTillageFertilityCropPlanting*Harvest/Yield*ProtectionPassesTestFile*Reliableboundary
files, as-planted and yield data are common baseline items every grower should have available and ready to share.
ELECTRONIC FIELD RECORDS (“EFR”) Electronic field record may be the best way to think about digital records from farm operations, especially since they exist in a plethora
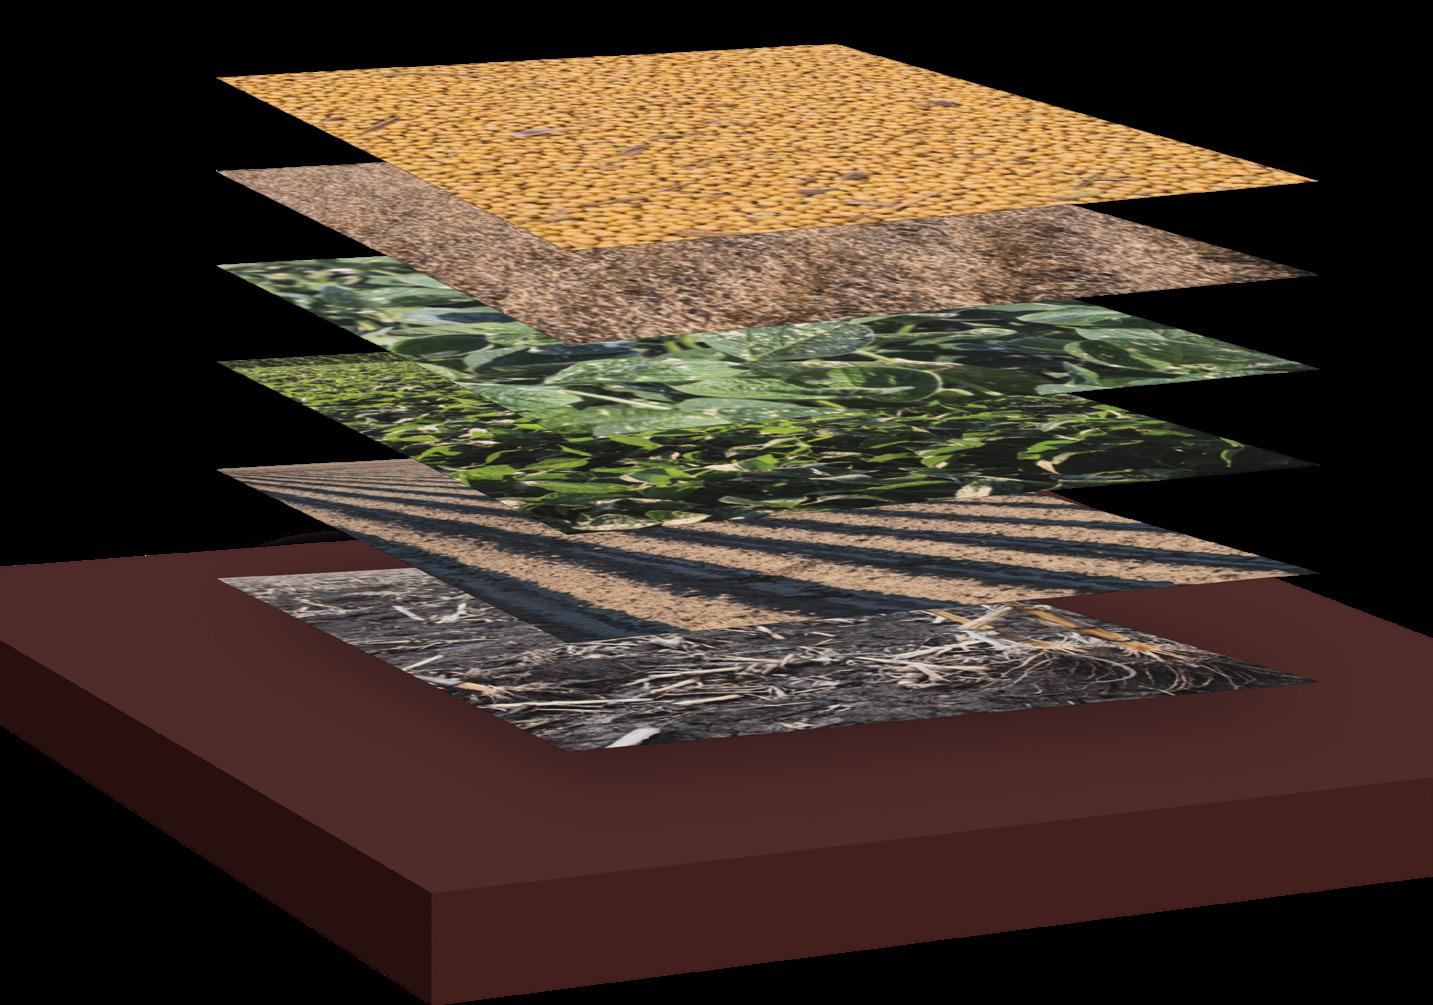
THE DIGITAL FARM DATA STACK
At the very least, organizing and digitizing (using a spread sheet, word doc, or even scanning handwritten field notes) will speed up this process.
Digital records and digitized records certainly sound the same… but they’re not. The yield map shape file from your combine monitor? It’s a digital record that has data and attributes stored in the 1s and 0s of digital code, referenced to your actual GPS position, and carries informational attributes that can be taken into a variety of systems and analyses.
GETTING ON-BOARD Today most carbon programs will engage directly to acquire a grower’s historical records as part of program qualification and on-boarding, with some even sending reps to the farm to meet and capture whatever records (even handwritten ones!) that are available.
DIGITAL OR DIGITIZED?
The “holy grail” of farm data is the complete geospatial digital stack.
Hire or outsource if you don’t have the skill or time Good farm data can’t be done well with a half-effort. Consider who on your team has the interest and skills to be your data czar, determine if your agretailer or input supplier can be your data captain, or consider an independent agronomist and consultant who can help.
Consistency across equipment isn’t just a systems matter – it’s less complexity for your team, family, and hired help.
Whether you use an ATV with RTK correction driven around your field perimeter (arguably the best boundary you can create), an actual field pass, or draw it using satellite images, create a single master-set of your field boundaries that everyone uses for your operation.
You’d never run a tractor without engine oil… consider whether operational monitors and active data collection are a requirement anytime your equipment is rolling.
Be consistently consistent
From using the same set-up files across your monitors to naming fields the exact same way, good data needs consistency and a commitment from your team to “do it one way.” From a data perspective “Johnson West 80” and “Johnson W80” are two different fields, and naming consistency up-front saves the data-cleaning standardization on the back-end. This holds true for all identity fields – from chemical names to field varieties to equipment names – consistent means identical.
Avoid calibrations and changes mid-field
Focus your equipment fleet within as few brands as possible
In-cab technology from independents like AgLeader, Raven, Topcon, and Trimble can provide a consistent experience and data flow across a multi-color equipment fleet.
Spend the time to create a clean master-set of your field boundaries, and share them with your trusted advisors and partners
DATA BEST PRACTICES
Don’t give up your thumb drives just yet Cloud-connectivity is great… when it works. Plan to pull the original monitor files with a good ‘ole thumb drive at the end of the season, if not sooner. Keep a basic paper back-up record Having a fall-back record of dates and details for your field operations can be invaluable, whether you are data cleaning or dealing with an inevitable “oops, we missed that” EFR.
TIPS FROM CARBON PROGRAM ADMINISTRATORS AND FARM DATA EXPERTS
Use that smartphone Enable your GPS-tagging and use that camera to document your activities, especially for items like planting cover crops. Timestamped and geo-referenced, it’s a great record.
Post-season calibration and correction is possible, especially for yield data, but only when the original data is consistent –don’t calibrate your yield monitor in the middle of a field!
For multi-color fleets, invest in a single, standardized set of monitors
Treat data collection like engine oil
FARM DATA CHECKLIST FARM RECORDS – “Data” to Capture What About Electronic Field Records? Soil Tests • Request from your lab if available. (MODUS is an emerging soil test standard, but the variety of file formats for tests remains a weak link in the data chain.) Fall and Spring Tillage • Tillage passes are equipment dependent but generally not auto-generated in a useful form, making non-EFR records important! • Programs like FieldView are developing tools to create after-the-fact tillage maps TypeDate of DiskEquipmentTillageUsedorCoulterAngle (if applicable) % Row Width Cultivated Fertility • Make receipt of variable rate prescriptions and as-applied files a requirement of your ag retail and custom application relationships • Remember variable rate prescriptions may be easier to collect than actual as-applied TypeDate / Manure:InhibitorRatesInjectionTime-ReleaseApplicationProductMethodDepthN,P,KUsedRate,C:NRatio, N %, Moisture % Planting • Planter data should be considered a must-have with today’s equipmentRowPopulationVarietyCropDateSpacing Crop Protection • Equipment and ag retailer dependent • Be aware of the complexity of multi-product tank mixes and the need to keep non-EFR detailed records TypeDate / ApplicationApplicationProductMethodRate Harvest • Yield data is a must-have with today’s equipmentResidueMoistureYieldDateRemoval Cover Crops • Planter data may be available • Use a smartphone camera with GPS-tagging enabled to document planting, seed tags, and termination Planting Date CropVarietySeeding TerminationTerminationRateDateMethod Pre-Season Activities • Confirm master field boundaries • Pre-populate all monitors with same set-up files • Set clear data expectations with your drivers and team members Post-Season Activities • Organize and complete back-up records • Pull original raw data files from monitors • Review data for holes and inconsistencies • Document or create EFRs for unrecorded passes • Post-calibrate yields
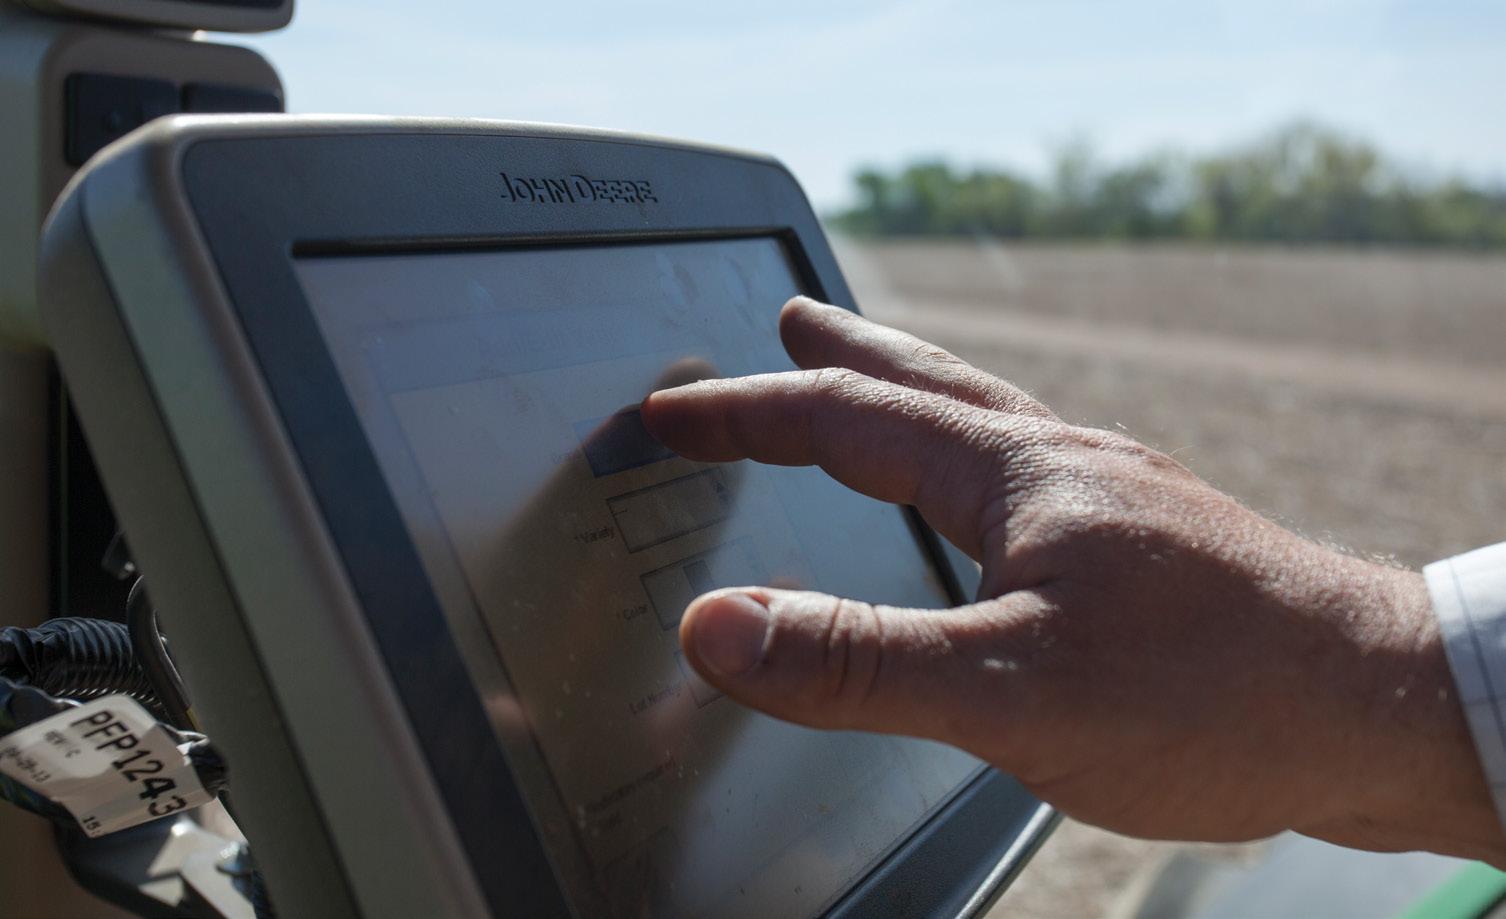
CLOUD SERVERS3,4 TELEMATICS3 IN-CAB MONITORS + CONTROLLERS2
Those monitors and controllers visualize that data in-cab for presentation to the operator. When multiple monitors are present, it is important to note which system is controlling implements versus just displaying system information. TELEMATICS like JDLink can provide direct-to-CLOUD data uploading, but THUMB DRIVES play an important role as backup to ensure complete file transfers and to circumvent slow internet connections.
54321 MACHINERY2 THUMB
FARM DATA FLOW – ELECTRONIC FIELD RECORDS SATELLITES1
PLUG-AND-PLAY DEVICES like Farmobile PUC and FIELDVIEWdrive can transport equipment data straight from the 9-pin diagnostic port to IPADS/ TABLETS or CLOUD SERVERS. While these can be great options to get data “off” multi-color fleets, they are only as good as the set-up files, field boundaries, and product names they are given!
COMPUTER5 IPAD/TABLET4
Modern equipment throws off a multitude of engine and machine performance data that is independent of field-related information needed for agronomic and management decisions. Some of this data is standardized, and some is proprietary to the manufacturer. While no carbon program requires this information today, early discussions suggest the “next” data request will be for fuel consumption – a logical ask to document reduced carbon footprint from changing farm operations like fewer tillage passes.
Shape files are one of the most common and easiest-to-use types of geospatial data used to capture location-specific information. But calling it a shape file is misleading: it’s actually multiple files.
WHAT IS A SHAPE FILE, ANYWAY?
PLUG-AND-PLAYDEVICES4
MACHINERY connects raw data to IN-CAB MONITORS AND CONTROLLERS, sometimes from the OEM (“original equipment manufacturer”) and sometimes from after-market providers (like AgLeader, TopCon, or Trimble).
Three files are always required – .shp, .shx, and .dbf that contain feature geometry, an index file, and attribute information – and a fourth frequently-required file .prj that contains (usually satellite) coordinate information.
Laptop and desktop COMPUTERS still provide the primary means for data visualization, which depends on software to convert files into imagery and readable text. The “hiccups” in the data chain occur when your software platform of choice cannot read the exported machine data, either because it has not been converted or it exists in a format unique to the equipment brand. DRIVE3
WHAT ABOUT ENGINE AND MACHINE DATA?
SATELLITES provide the geospatial referencing giving EFRs value as GPS data linked information.
Every farm is different, but the farm operations that have figured out their data game have one thing in common: they’ve made a consistent, serious effort and have either invested in people, skills, and training within their own team, or found the capable trusted advisor or input provider who can be the data team captain. Without a commitment to the people collecting, transferring, and organizing your data, it won’t be valuable.
Yesterday was the time to collect data for tomorrow’s program payments: what are you waiting for?
AgGateway, a global non-profit organization with some 200 members (including nearly all of the major equipment manufacturers, crop input companies, ag retailers, and technology providers), develops open-source software and resources to help connect the industry.
The industry has made significant headway in recent years, largely due to investment in APIs (application programming interfaces) that allow different software systems to “talk.”
BRINGING
While farm data collection, storage, and sharing is getting easier, there will probably never be an easy button
And as any grower will tell you, that depends.
When enrolling in a market, growers should be sure to ask about data privacy and whether the market they are considering is part of Ag Data Transparent. IT ALL TOGETHER
INTEROPERABILITY
DATA PRIVACY
Its work is behind the scenes but is driving major improvements in standards and interoperability, like the MODUS soil testing standard now gaining headway.
Program.CheckoffAssociationSoybeanIllinoisthebyFunded
Interoperability is industry lingo for “do they play together nicely?”
– DATA’S SINGLE GREATEST RESOURCE
Low-cost, high-resolution, ubiquitous satellite imagery and the AI and machine learning that powers its analysis is already beginning to change the way we conceive of on-farm privacy. Crop rotation, tillage methods, use of cover crops, and estimated yields – to name a few items – are no longer field-level trade secrets known only to the grower. As technology continues to advance, this will continue to Agchange.DataTransparent (“ADT”), a non-profit formed in 2014 through collaborative efforts of the American Farm Bureau Federation and industry partners, is the foremost industry organization promoting transparency in data usage and ownership and offers a formal certification to agricultural companies. Growers can find an outline of core data policies and procedures of each certified company on the ADT website at www.agdatatransparent.com/certified2