

April 29, 2022

Acknowledgements
The author would like to thank Karen Conner, Matthew Sedlar, Sarah Rawlins, Joseph Peck, and Shawn Fremstad for their assistance.
Overview
The first day of May is International Workers Day. The holiday is meant to commemorate the shared struggle of workers across the globe. While a similar observance takes place on Labor Day in the US and Canada (one that Teen Vogue notably called a government scam), it is worth honoring the original workers’ holiday in the US by revisiting its state of union membership.
The overall union membership share returned to its 2019 level in 2021, declining by half a percentage point to 10.3 percent from its notable uptick in 2020 (Table 1). The number of union members also fell by 241,000 (Table 2). The unionization rate fell in both the public and private sectors between 2020 and 2021, by 0.9 and 0.2 percentage points, respectively. Compared to 2019, however, union density in the public sector increased by 0.3 percentage points (Figure 1).
| (percent of employees) | |||||||||||
|---|---|---|---|---|---|---|---|---|---|---|---|
| Membership | Coverage | ||||||||||
| 2019 | 2020 | 2021 | Change (2020-2021) | Change (2019-2021) | 2019 | 2020 | 2021 | Change (2020-2021) | Change (2019-2021) | ||
| All | 10.3 | 10.8 | 10.3 | -0.5 | 0.0 | 11.6 | 12.1 | 11.6 | -0.5 | 0.0 | |
| Public sector | 33.6 | 34.8 | 33.9 | -0.9 | 0.3 | 37.2 | 38.4 | 37.6 | -0.8 | 0.4 | |
| Private sector | 6.2 | 6.3 | 6.1 | -0.2 | -0.1 | 7.1 | 7.2 | 7.0 | -0.2 | -0.1 | |
| Gender | |||||||||||
| Women | 9.7 | 10.5 | 9.9 | -0.6 | 0.2 | 11.0 | 11.8 | 11.3 | -0.5 | 0.3 | |
| Men | 10.8 | 11.0 | 10.6 | -0.4 | -0.2 | 12.1 | 12.3 | 11.9 | -0.4 | -0.2 | |
| Race and ethnicity | |||||||||||
| White | 10.3 | 10.7 | 10.3 | -0.4 | 0.0 | 11.5 | 12.0 | 11.6 | -0.4 | 0.1 | |
| Black | 11.2 | 12.3 | 11.5 | -0.8 | 0.3 | 12.7 | 13.9 | 12.9 | -1.0 | 0.2 | |
| Hispanic | 8.9 | 9.8 | 9.0 | -0.8 | 0.1 | 10.2 | 11.0 | 10.3 | -0.7 | 0.1 | |
| Asian | 8.8 | 8.9 | 7.7 | -1.2 | -1.1 | 10.0 | 10.0 | 9.0 | -1.0 | -1.0 | |
| Age | |||||||||||
| 16-24 | 4.4 | 4.4 | 4.2 | -0.2 | -0.3 | 5.2 | 5.2 | 5.3 | 0.1 | 0.1 | |
| 25-34 | 8.8 | 9.8 | 9.4 | -0.4 | 0.7 | 10.3 | 11.0 | 10.7 | -0.3 | 0.4 | |
| 35-44 | 11.8 | 12.2 | 11.4 | -0.8 | -0.4 | 13.1 | 13.5 | 12.8 | -0.7 | -0.3 | |
| 45-54 | 12.6 | 13.2 | 13.1 | -0.1 | 0.5 | 13.9 | 14.7 | 14.4 | -0.3 | 0.5 | |
| 55-64 | 12.7 | 13.0 | 12.1 | -0.9 | -0.6 | 14.1 | 14.5 | 13.6 | -0.9 | -0.5 | |
| 65 or over | 9.7 | 9.0 | 8.7 | -0.3 | -1.0 | 10.9 | 10.1 | 9.8 | -0.3 | -1.1 | |
| Education* | |||||||||||
| Less than high school | 5.3 | 5.4 | 5.2 | -0.2 | 0.0 | 6.2 | 6.2 | 6.0 | -0.3 | -0.2 | |
| High school | 9.6 | 10.0 | 9.3 | -0.7 | -0.3 | 10.7 | 11.0 | 10.4 | -0.7 | -0.3 | |
| Some college | 10.2 | 11.0 | 10.5 | -0.5 | 0.3 | 11.2 | 12.0 | 11.6 | -0.4 | 0.3 | |
| Bachelor’s degree | 9.9 | 10.0 | 9.9 | -0.2 | -0.1 | 11.3 | 11.6 | 11.4 | -0.1 | 0.1 | |
| Advanced degree | 15.3 | 15.5 | 14.8 | -0.7 | -0.5 | 17.5 | 17.6 | 16.8 | -0.8 | -0.7 | |
| Nativity* | |||||||||||
| US born | 10.7 | 11.2 | 10.7 | -0.5 | 0.0 | 12.0 | 12.5 | 12.0 | -0.5 | 0.0 | |
| Foreign born | 8.3 | 8.8 | 8.3 | -0.6 | 0.0 | 9.4 | 10.0 | 9.5 | -0.5 | 0.1 | |
Source : Data for all, public, private, gender, race/ethnicity, and age, from Bureau of Labor Statistics (2021-2022); * data for education and nativity from CEPR analysis of Current Population Survey Outgoing Rotation Group, for 2019–2021. Some differences in the fourth, fifth, ninth, and tenth columns reflect rounding.
| (thousands of workers) | |||||||||||
|---|---|---|---|---|---|---|---|---|---|---|---|
| Membership | Coverage | ||||||||||
| 2019 | 2020 | 2021 | Change (2020-2021) | Change (2019-2021) | 2019 | 2020 | 2021 | Change (2020-2021) | Change (2019-2021) | ||
| All | 14,574 | 14,253 | 14,012 | -241 | -562 | 16,383 | 15,939 | 15,802 | -137 | -581 | |
| Public sector | 7,066 | 7,173 | 6,982 | -191 | -84 | 7,821 | 7,921 | 7,747 | -174 | -74 | |
| Private sector | 7,508 | 7,080 | 7,030 | -50 | -478 | 8,562 | 8,018 | 8,055 | 37 | -507 | |
| Gender | |||||||||||
| Women | 6,624 | 6,672 | 6,490 | -182 | -134 | 7,538 | 7,507 | 7,386 | -121 | -152 | |
| Men | 7,950 | 7,582 | 7,523 | -59 | -427 | 8,845 | 8,432 | 8,416 | -16 | -429 | |
| Race or ethnicity | |||||||||||
| White | 11,208 | 10,944 | 10,774 | -170 | -434 | 12,583 | 12,221 | 12,142 | -79 | -441 | |
| Black | 2,043 | 2,055 | 1,993 | -62 | -50 | 2,310 | 2,321 | 2,232 | -89 | -78 | |
| Hispanic | 2,258 | 2,315 | 2,221 | -94 | -37 | 2,590 | 2,586 | 2,551 | -35 | -39 | |
| Asian | 817 | 766 | 706 | -60 | -111 | 932 | 855 | 818 | -37 | -114 | |
| Age | |||||||||||
| 16-24 | 827 | 741 | 763 | 22 | -64 | 977 | 865 | 954 | 89 | -23 | |
| 25-34 | 2,973 | 3,071 | 3,041 | -30 | 68 | 3,464 | 3,455 | 3,449 | -6 | -15 | |
| 35-44 | 3,515 | 3,475 | 3,326 | -149 | -189 | 3,906 | 3,836 | 3,740 | -96 | -166 | |
| 45-54 | 3,543 | 3,469 | 3,521 | 52 | -22 | 3,918 | 3,868 | 3,880 | 12 | -38 | |
| 55-64 | 2,952 | 2,842 | 2,696 | -146 | -256 | 3,266 | 3,175 | 3,028 | -147 | -238 | |
| 65 or over | 764 | 656 | 665 | 9 | -99 | 852 | 740 | 751 | 11 | -101 | |
| Education* | |||||||||||
| Less than high school | 598 | 519 | 535 | 16 | -63 | 702 | 592 | 611 | 14 | -91 | |
| High school | 3,541 | 3,331 | 3,218 | -113 | -323 | 3,937 | 3,655 | 3,590 | -103 | -347 | |
| Some college | 3,998 | 3,919 | 3,792 | -127 | -206 | 4,415 | 4,274 | 4,187 | -129 | -227 | |
| Bachelor’s degree | 3,419 | 3,397 | 3,437 | 40 | 18 | 3,891 | 3,905 | 3,975 | 10 | 84 | |
| Advanced degree | 3,011 | 3,085 | 3,022 | -62 | 11 | 3,430 | 3,509 | 3,433 | -120 | 2 | |
| Nativity* | |||||||||||
| US born | 12,554 | 12,331 | 12,096 | -235 | -458 | 14,084 | 13,767 | 13,603 | -323 | -480 | |
| Foreign born | 2,012 | 1,919 | 1,908 | -12 | -105 | 2,291 | 2,169 | 2,192 | -5 | -99 | |
Source: Data for all, public, private, gender, race/ethnicity, and age, from Bureau of Labor Statistics (2021-2022); *data for education and nativity from CEPR analysis of Current Population Survey Outgoing Rotation Group, for 2019–2021. Some differences in the fourth, fifth, ninth, and tenth columns reflect rounding.
Figure 1
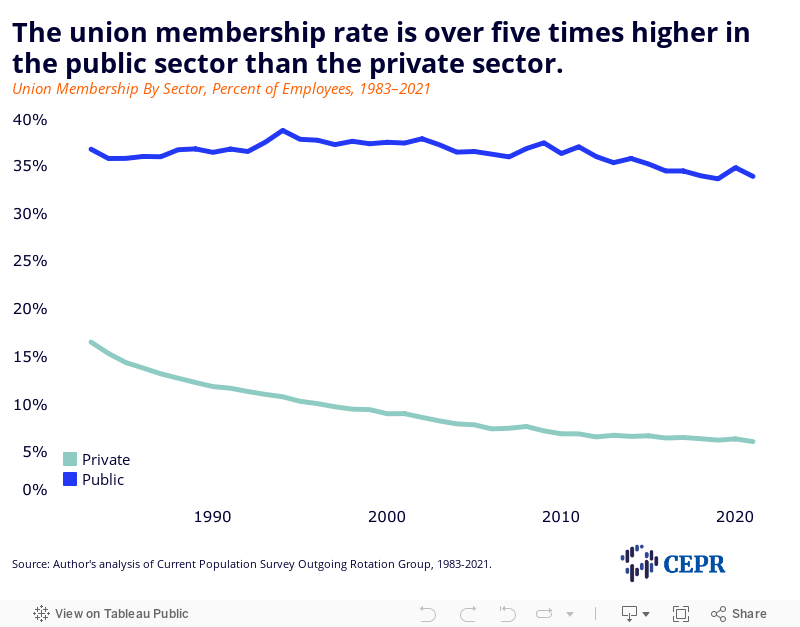
While the year-over-year changes between 2020 and 2021 look especially dramatic and dire, it is important to note that 2020 was an abnormal economic year in ways that affected union membership statistics. Amid the massive pandemic-related job loss in 2020, proportionately more nonunion workers lost jobs than union workers. As a result, union members made up a larger share of those who remained employed.
A similar dynamic was observed in 2007 and 2008, following the financial crisis. Since many of those who lost jobs returned to work in 2021, it is likely more instructive to examine union membership changes since 2019 rather than simply measuring the year-over-year changes between 2020 and 2021. This will be the primary type of comparison in the analysis that follows. If not otherwise specified, references to changes in union membership describe those that took place between 2019 and 2021.
It is disappointing for the labor movement that 2020’s uptick in union density did not continue in 2021, instead returning to its pre-pandemic lows. However, it is increasingly evident that things have not returned to business as usual for organized labor in the US.
In 2021, unions’ favorability rating among the American public reached the highest level since 1965, with especially high approval among younger workers. This coincided with a 0.7 percentage point uptick in union membership among workers ages 25 to 34 between 2019 and 2021. However, the unionization rate for these workers remains below 10 percent. The disparity between the share of young workers who are union members and the share who approve of unions represents a unique opportunity to grow union membership and worker power in the years to come.
That growth might already be underway. Election data from the National Labor Relations Board (NLRB)—the agency responsible for overseeing many private sector union elections—suggest that a renaissance in union organizing may have begun. Specifically, the NLRB reported that union representation petitions increased by 57 percent during the first six months of Fiscal Year 2022 (October 2021–March 2022) compared to the first half of Fiscal Year 2021. In April 2022, the NLRB certified a groundbreaking upset win by the Amazon Labor Union in Staten Island, the largest shop to win an NLRB election in decades.
Though the apparent revitalization in organizing is encouraging, significant barriers persist. Passing legislation like the Protecting the Right to Organize (PRO) Act that removes obstacles to organizing would help workers build on the historic momentum generated during the pandemic. Public sector workers should also be guaranteed the right to join a union and to bargain collectively, as per the recently revived Public Service Freedom to Negotiate Act. Finally, the NLRB remains an important player due to its enforcement prerogative. It must be sufficiently funded to fulfill its mission.
Demographic Trends
Union members have grown more demographically diverse over the last several decades. For example, in 1989, nearly half of union members were white men. In 2021, white men made up just over a third of union workers. The share of union members who are white men also fell by one percentage point between 2019 and 2021.
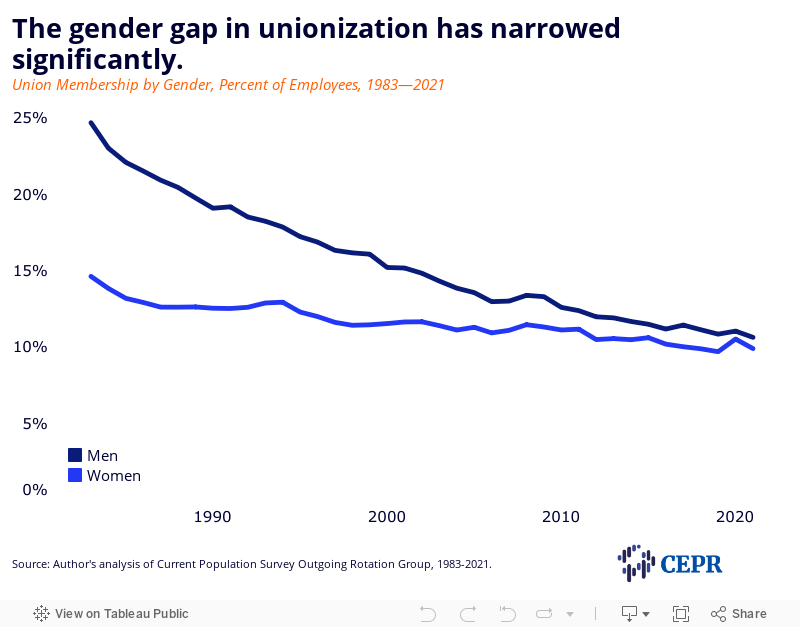
The gender gap in union membership has narrowed over the years due to a slower membership decline among women than men (Figure 2). The gap has been below 2.0 percentage points since 2010, and was less than a percentage point for the second year in a row in 2021. Between 2019 and 2021, the share of women who were union members increased by 0.2 percentage points, while the share of men who were union members decreased by the same. There were also over 400,000 fewer men who were union members in 2021 than in 2019; losses among women were less than a third of this, with the number of women union members dropping by 134,000.
Figure 2
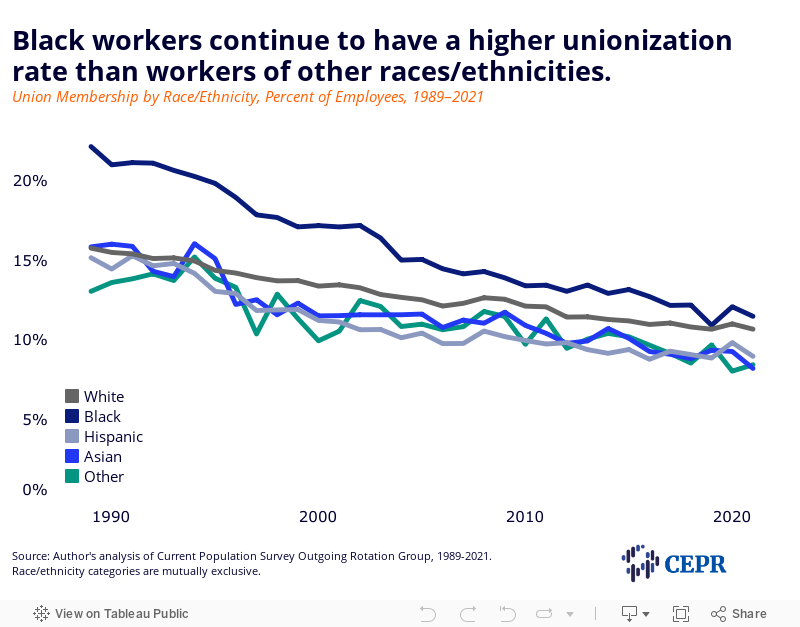
Black workers and their families have historically derived immense benefits from union membership, especially from union jobs in the public sector. Black workers continued to have the highest union membership rate of any race or ethnicity in 2021 (Figure 3), with a rate of 11.5 percent. The percentage of Black workers who were union members grew by 0.3 percentage points between 2019 and 2021, the largest increase of any racial or ethnic group during this period. It is worth noting that union membership among Black workers was at a record low in 2019, and the 2021 rate still represents a comparative decline, historically speaking. The number of Black union members fell by 50,000 between 2019 and 2021.
The biggest pandemic era decline in union membership rates occurred among Asian workers. Their membership share fell by 1.1 percentage points between 2019 and 2021, representing a loss of 111,000 union workers over a two-year period.
Figure 3
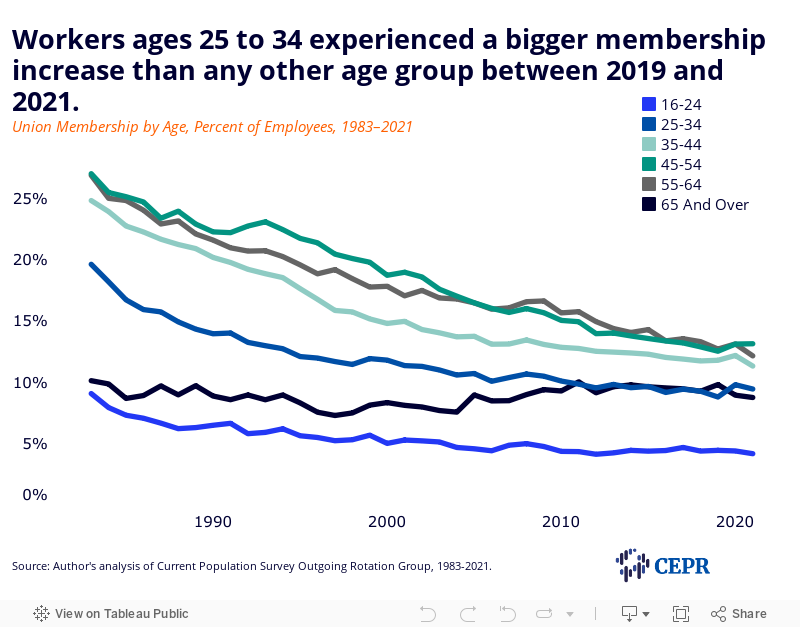
Steep membership declines among workers 65 and older continued in 2021 (Figure 4). The unionization rate for this group fell by 1.0 percentage point between 2019 and 2021, representing a loss of 99,000 workers. Union membership also fell by 0.6 percentage points among workers ages 55 to 64. This age group experienced the largest pandemic drop in the number of union members, with 256,000 fewer union members in 2021 than in 2019.
The union membership rate increased by 0.7 percentage points among workers ages 25 to 34 between 2019 and 2021. This was also the only age group that added union members during this period, growing by 68,000. Union membership gains among the youngest prime age workers coincided with an upswell in union approval among adult workers under the age of 35. In 2021, 77 percent of those in this age group expressed positive views toward labor unions, the highest level of any age group. In the same year, less than 10 percent of workers in this age group were union members. Lower unionization rates among workers under 25 may be attributable to weaker attachment to the labor force. But the disparity in union membership and union approval among younger prime age workers (those ages 25 to 34) represents a generational growth opportunity for the labor movement.
Figure 4
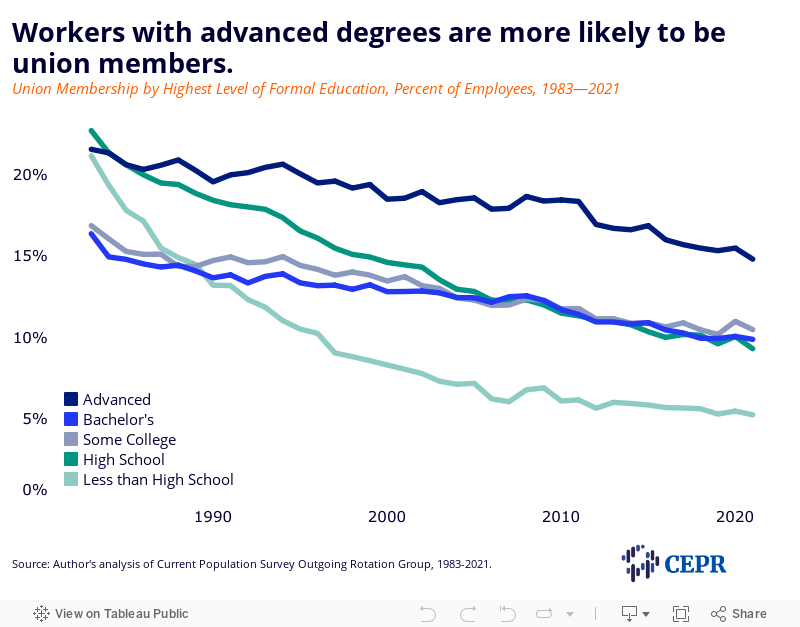
With a membership rate of 14.8 percent in 2021, workers with advanced degrees are still more likely to be union members than those with less formal education (Figure 5). Although the membership rate for those with advanced degrees declined by 0.5 percentage points between 2019 and 2021, the number of union members with advanced degrees increased by 11,000 in the same period. The unionization rate for workers whose highest level of education was a bachelor’s degree decreased more modestly, declining by 0.1 percentage points. However, the number of union members in this group grew by 18,000.
The union membership rate rose by 0.3 percentage points among those with some college but no bachelor’s degree between 2019 and 2021. However, this group still lost over 200,000 members over this period.
Among those with no formal education beyond high school, membership fell by 0.3 percentage points between 2019 and 2021, representing an exodus of more than 300,000 union members.
Those with less than a high school education are less likely to be union members compared to those with more formal education. The rate of union membership in this group returned to approximately its 2019 level in 2021, though the number of members with less than a high school education was 63,000 short of what it was in 2019.
It is unclear how much of these changes may be due to union members acquiring more formal education rather than unions attracting new members within these educational groupings. Union members are uniquely positioned to acquire additional education; dues-paying members and their families have access to free online college classes for credit and free programs to help them complete bachelor’s degrees.
Figure 5
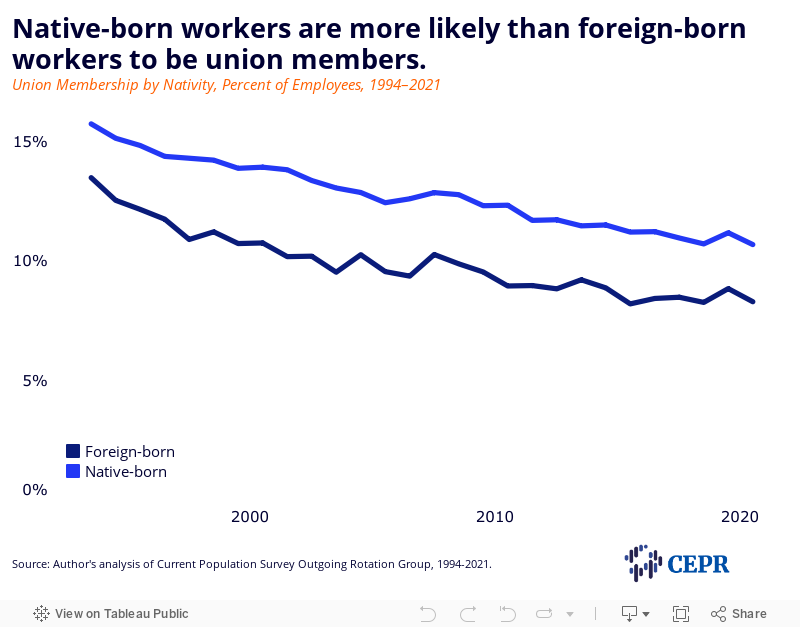
Native-born workers continue to be more likely than foreign-born workers to be union members. The gap between these groups now sits at 2.4 percentage points, identical to what it was in 2019 (Figure 6). The union membership rate among native-born workers returned to 2019 levels in 2021, while union density among foreign-born workers increased by 0.1 percentage points. Between 2019 and 2021, membership totals shrunk by 458,000 among the native-born and 105,000 among the foreign-born.
Figure 6
Industry and Occupation Trends by Sector
Table 3 shows union membership by industry and sector. In the public sector, union membership shares increased by 0.2 in state government and 0.8 percentage points in local government between 2019 and 2021. The federal government union membership rate fell by 0.7 percentage points during this period. The number of union members decreased at all levels of government, though local government was especially hard-hit, losing 51,000 members.
The most pronounced growth in private sector membership rates occurred in motion pictures and sound recording industries (up 3.7 percentage points), followed by non-internet publishing (up 2.3 percentage points), and mining, quarrying, and oil and gas extraction (up 1.7 percentage points).
Utilities industries continued to have the highest union membership rate in the private sector in 2021. However, union density in this industry group decreased between 2019 and 2021, falling 3.7 percentage points to 19.7 percent. This represented a loss of 57,000 union members.
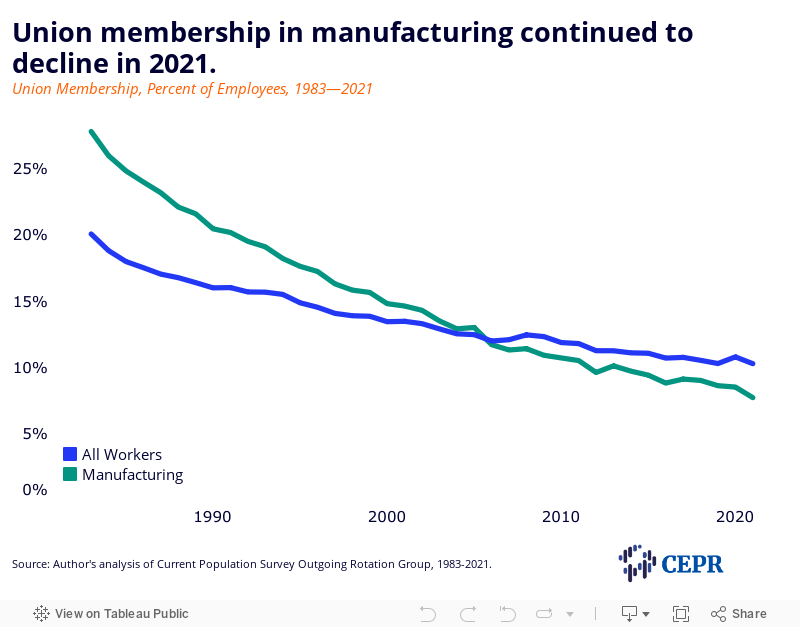
Union density in manufacturing fell by 0.9 percentage points to a historic low of 7.7 percent, in keeping with its downward trend toward the private sector average (Figure 7). Manufacturing also experienced the largest loss in union members of any industry group, shedding over 200,000 union members between 2019 and 2021.
Union drives in retail and hospitality have attracted significant attention in 2022. Since a store in Buffalo, New York became the first Starbucks in the US to unionize in late 2021, organizing efforts have spread to hundreds of Starbucks stores across the country. The success of these initiatives has dominated national headlines. Despite fierce corporate opposition, the union has prevailed in 34 of 36 elections as of this writing.
Workers have also scored high-profile union wins at Amazon and REI, and employees at several Apple stores are now endeavoring to follow in their footsteps. Only 4.4 percent of workers in retail trade and 1.2 percent of workers in food services and drinking places were unionized in 2021, densities well below the private sector average. Even so, high-profile union wins at places like Starbucks and REI suggest that a nascent organizing uptick may be underway in 2022.
The benefits of unionization may be especially consequential in pandemic frontline industries. A recent study found that unionization was associated with lower COVID-19 fatality rates among nursing home residents and staff alike. Therefore, it is concerning that union membership in health care and social assistance industries—which includes nursing home and residential care facilities—fell by 0.2 percentage points to 6.6 percent between 2019 and 2021, representing a loss of 78,000 union members.
| Membership Rate | Number of Members | ||||||||||
|---|---|---|---|---|---|---|---|---|---|---|---|
| (percent of employees) | (thousands of employees) | ||||||||||
| 2019 | 2020 | 2021 | Change (2020-2021) | Change (2019-2021) | 2019 | 2020 | 2021 | Change (2020-2021) | Change (2019-2021) | ||
| Private Sector | 6.2 | 6.3 | 6.1 | -0.2 | -0.1 | 7,508 | 7,080 | 7,030 | -50 | -478 | |
| Agriculture & related industries | 1.7 | 1.7 | 2.9 | 1.2 | 1.2 | 23 | 21 | 37 | 16 | 14 | |
| Nonagricultural industries | 6.3 | 6.4 | 6.1 | -0.3 | -0.2 | 7,485 | 7,059 | 6,993 | -66 | -492 | |
| Mining, quarrying, and oil and gas extraction | 4.0 | 5.6 | 5.7 | 0.1 | 1.7 | 28 | 37 | 32 | -5 | 4 | |
| Construction | 12.6 | 12.7 | 12.6 | -0.1 | 0.0 | 1,055 | 993 | 1,024 | 31 | -31 | |
| Manufacturing | 8.6 | 8.5 | 7.7 | -0.8 | -0.9 | 1,291 | 1,181 | 1,082 | -99 | -209 | |
| Durable goods | 8.8 | 8.7 | 7.4 | -1.3 | -1.4 | 835 | 754 | 668 | -86 | -167 | |
| Nondurable goods | 8.2 | 8.2 | 8.0 | -0.2 | -0.2 | 455 | 427 | 414 | -13 | -41 | |
| Wholesale and retail trade | 4.1 | 4.5 | 4.3 | -0.2 | 0.2 | 741 | 787 | 769 | -18 | 28 | |
| Wholesale trade | 4.5 | 4.3 | 3.7 | -0.6 | -0.8 | 143 | 133 | 116 | -17 | -27 | |
| Retail trade | 4.0 | 4.6 | 4.4 | -0.2 | 0.4 | 598 | 655 | 653 | -2 | 55 | |
| Transportation and utilities | 17.3 | 17.6 | 15.4 | -2.2 | -1.9 | 1,166 | 1,135 | 1,086 | -49 | -80 | |
| Transportation and warehousing | 16.1 | 17.0 | 14.7 | -2.3 | -1.4 | 912 | 916 | 889 | -27 | -23 | |
| Utilities | 23.4 | 20.6 | 19.7 | -0.9 | -3.7 | 254 | 219 | 197 | -22 | -57 | |
| Information* | 10.3 | 9.3 | 10.0 | 0.7 | -0.3 | 242 | 200 | 226 | 26 | -16 | |
| Publishing, except internet | 3.3 | 2.4 | 5.6 | 3.2 | 2.3 | 12 | 8 | 17 | 9 | 5 | |
| Motion pictures and sound recording industries | 13.6 | 14.0 | 17.3 | 3.3 | 3.7 | 53 | 40 | 61 | 21 | 8 | |
| Broadcasting (except internet) | 11.0 | 7.6 | 8.9 | 1.3 | -2.1 | 53 | 30 | 33 | 3 | -20 | |
| Telecommunications | 14.1 | 14.3 | 11.9 | -2.4 | -2.2 | 115 | 111 | 100 | -11 | -15 | |
| Financial activities | 1.9 | 1.9 | 2.3 | 0.4 | 0.4 | 182 | 169 | 206 | 37 | 24 | |
| Finance and insurance | 1.2 | 1.4 | 1.3 | -0.1 | 0.1 | 87 | 96 | 91 | -5 | 4 | |
| Finance | 1.1 | 1.2 | 1.2 | 0.0 | 0.1 | 49 | 53 | 53 | 0 | 4 | |
| Insurance | 1.4 | 1.7 | 1.5 | -0.2 | 0.1 | 37 | 43 | 38 | -5 | 1 | |
| Real estate and rental and leasing | 4.0 | 3.5 | 5.2 | 1.7 | 1.2 | 95 | 74 | 114 | 40 | 19 | |
| Professional and business services | 2.2 | 2.2 | 2.2 | 0.0 | 0.0 | 339 | 323 | 334 | 11 | -5 | |
| Professional and technical services | 1.4 | 1.3 | 1.2 | -0.1 | -0.2 | 143 | 132 | 128 | -4 | -15 | |
| Management, administrative, and waste services | 3.6 | 4.0 | 4.2 | 0.2 | 0.6 | 197 | 191 | 206 | 15 | 9 | |
| Education and health services | 8.0 | 8.4 | 7.9 | -0.5 | -0.1 | 1,885 | 1,876 | 1,807 | -69 | -78 | |
| Educational services | 12.3 | 13.5 | 12.9 | -0.6 | 0.6 | 608 | 607 | 607 | 0 | -1 | |
| Health care and social assistance | 6.8 | 7.1 | 6.6 | -0.5 | -0.2 | 1,278 | 1,269 | 1,200 | -69 | -78 | |
| Leisure and hospitality | 2.9 | 2.2 | 2.2 | 0.0 | -0.7 | 384 | 223 | 252 | 29 | -132 | |
| Arts, entertainment, and recreation | 6.6 | 4.8 | 4.8 | 0.0 | -1.8 | 164 | 86 | 96 | 10 | -68 | |
| Accommodation and food services | 2.1 | 1.6 | 1.7 | 0.1 | -0.4 | 220 | 137 | 156 | 19 | -64 | |
| Accommodation | 6.5 | 5.7 | 5.9 | 0.2 | -0.6 | 93 | 52 | 58 | 6 | -35 | |
| Food services and drinking places | 1.4 | 1.2 | 1.2 | 0.0 | -0.2 | 128 | 85 | 98 | 13 | -30 | |
| Other services* | 2.8 | 2.5 | 3.1 | 0.6 | 0.3 | 172 | 134 | 176 | 42 | 4 | |
| Other services, except private households | 3.1 | 2.8 | 3.2 | 0.4 | 0.1 | 163 | 130 | 158 | 28 | -5 | |
| Public Sector | 33.6 | 34.8 | 33.9 | -0.9 | 0.3 | 7,066 | 7,173 | 6,982 | -191 | -84 | |
| Federal Government | 25.6 | 26.0 | 24.9 | -1.1 | -0.7 | 974 | 1,014 | 951 | -63 | -23 | |
| State Government | 29.4 | 29.9 | 29.6 | -0.3 | 0.2 | 2,043 | 2,085 | 2,033 | -52 | -10 | |
| Local Government | 39.4 | 41.7 | 40.2 | -1.5 | 0.8 | 4,050 | 4,074 | 3,999 | -75 | -51 | |
| *Includes other industries, not shown separately. | |||||||||||
Source: Data from Bureau of Labor Statistics (2021-2022). Some differences in the “Change” columns reflect rounding.
Figure 7
Tables 4 and 5 show union membership by occupation and sector. Construction and extraction occupations remained the most unionized in the private sector at 16 percent, followed by education, training, and library occupations at 14.1 percent. The latter’s union membership rate grew by 2.0 percentage points between 2019 and 2021, the largest increase in the private sector.
The biggest private sector rate decline occurred in transportation and material moving occupations, where union membership fell by 1.4 percentage points between 2019 and 2021. At 11.1 percent, however, this group’s union membership rate remained well above the private sector average. Sales and related occupations added the most union members (up 37,000) in the private sector, while office and administrative support occupations sustained the biggest dip (down 173,000).
The most heavily unionized occupations in the public sector are protective service occupations (48.9 percent) and education, training, and library occupations (48.3 percent). Between 2019 and 2021, union membership grew by 1.1 percentage points among the former, while in the latter, it stayed flat. The most dramatic public sector rate increase occurred in farming, fishing, and forestry occupations (up 14.2 percentage points), for which the union membership more than doubled between 2019 and 2021.
Among those in protective services occupations, the union share was 41 percentage points higher in the public sector than in the private sector. This was the largest percentage point public-private gap in union membership rates in 2021. The smallest public-private gap was in sales and related occupations. This distinction previously belonged to farming, fishing, and forestry occupations, but their explosive public sector union membership growth has tipped the balance significantly since 2019.
Union membership in private sector health care occupations fell between 2019 and 2021, decreasing by 0.1 and 0.5 percentage points in health care practitioner and technical occupations and health care support occupations, respectively. In the public sector, union membership fell by 1.3 percentage points in health care practitioner and technical occupations, but increased by 2.2 percentage points in health care support occupations. Health care support occupations added 22,000 and 97,000 union members in the private and public sectors, respectively. Health care practitioner and technical occupations lost 21,0000 union members in the private sector and gained 4,000 union members in the public sector.
| (percent of employees) | |||||||||||
|---|---|---|---|---|---|---|---|---|---|---|---|
| Private Sector | Public Sector | ||||||||||
| 2019 | 2020 | 2021 | Change (2020-2021) | Change (2019-2021) | 2019 | 2020 | 2021 | Change (2020-2021) | Change (2019-2021) | ||
| Management, business, and financial operations occupations | 2.2 | 2.1 | 2.2 | 0.1 | 0.0 | 19.8 | 19.6 | 20.5 | 0.9 | 0.7 | |
| Professional and related occupations* | 6.7 | 6.7 | 6.6 | -0.2 | -0.2 | 37.8 | 38.9 | 38.2 | -0.8 | 0.3 | |
| Community and social service occupations | 5.3 | 4.8 | 4.1 | -0.7 | -1.2 | 36.3 | 36.0 | 34.7 | -1.3 | -1.6 | |
| Education, training, and library occupations | 12.1 | 14.2 | 14.1 | 0.0 | 2.0 | 45.7 | 48.3 | 46.8 | -1.5 | 1.1 | |
| Health care practitioner and technical occupations | 9.4 | 9.5 | 9.3 | -0.2 | -0.1 | 31.5 | 29.7 | 30.2 | 0.4 | -1.3 | |
| Healthcare support occupations | 6.1 | 6.2 | 5.6 | -0.6 | -0.5 | 25.2 | 23.0 | 27.4 | 4.4 | 2.2 | |
| Protective service occupations | 7.2 | 9.5 | 5.9 | -3.6 | -1.3 | 46.9 | 48.9 | 46.9 | -2.0 | 0.0 | |
| Food preparation and serving related occupations | 2.7 | 2.4 | 2.4 | 0.0 | -0.3 | 20.8 | 22.2 | 17.2 | -5.1 | -3.7 | |
| Building and grounds cleaning and maintenance occupations | 5.5 | 6.2 | 6.3 | 0.2 | 0.8 | 29.3 | 31.5 | 27.9 | -3.6 | -1.4 | |
| Personal care and service occupations | 3.4 | 2.2 | 2.9 | 0.8 | -0.5 | 21.5 | 18.8 | 15.8 | -3.0 | -5.7 | |
| Sales and related occupations | 2.6 | 3.1 | 3.2 | 0.1 | 0.5 | 17.3 | 15.6 | 12.9 | -2.7 | -4.5 | |
| Office and administrative support occupations | 4.5 | 3.9 | 3.8 | 0.0 | -0.7 | 30.6 | 31.8 | 30.2 | -1.7 | -0.4 | |
| Farming, fishing, and forestry occupations | 1.8 | 2.0 | 3.3 | 1.3 | 1.5 | 9.7 | 24.0 | 23.8 | -0.1 | 14.2 | |
| Construction and extraction occupations | 16.2 | 16.4 | 16.0 | -0.5 | -0.2 | 33.7 | 34.5 | 35.0 | 0.4 | 1.3 | |
| Installation, maintenance, and repair occupations | 12.7 | 12.7 | 12.0 | -0.7 | -0.6 | 31.3 | 34.0 | 33.3 | -0.7 | 2.0 | |
| Production occupations | 11.1 | 11.1 | 10.3 | -0.8 | -0.8 | 30.0 | 32.8 | 24.4 | -8.4 | -5.6 | |
| Transportation and material moving occupations | 12.5 | 12.8 | 11.1 | -1.8 | -1.4 | 32.4 | 36.1 | 39.2 | 3.1 | 6.8 | |
| *Includes other occupation categories, not shown separately. | |||||||||||
Source: CEPR analysis of Current Population Survey Outgoing Rotation Group, 2019-2021. Some differences in the “Change” columns reflect rounding.
| (thousands of employees) | |||||||||||
|---|---|---|---|---|---|---|---|---|---|---|---|
| Private Sector | Public Sector | ||||||||||
| 2019 | 2020 | 2021 | Change (2020-2021) | Change (2019-2021) | 2019 | 2020 | 2021 | Change (2020-2021) | Change (2019-2021) | ||
| Management, business, and financial operations occupations | 419 | 404 | 432 | 28 | 12 | 535 | 558 | 587 | 29 | 52 | |
| Professional and related occupations* | 1,672 | 1,629 | 1,614 | -15 | -58 | 3,643 | 3,718 | 3,608 | -110 | -34 | |
| Community and social service occupations | 92 | 82 | 71 | -10 | -21 | 316 | 319 | 312 | -7 | -4 | |
| Education, training, and library occupations | 418 | 444 | 454 | 10 | 36 | 2,637 | 2,658 | 2,552 | -106 | -85 | |
| Healthcare practitioner and technical occupations | 765 | 757 | 744 | -13 | -21 | 310 | 312 | 314 | 2 | 4 | |
| Healthcare support occupations | 207 | 254 | 228 | -26 | 22 | 60 | 121 | 157 | 36 | 97 | |
| Protective service occupations | 73 | 89 | 57 | -32 | -16 | 963 | 1,013 | 913 | -99 | -49 | |
| Food preparation and serving related occupations | 218 | 148 | 164 | 15 | -54 | 77 | 71 | 58 | -12 | -18 | |
| Building and grounds cleaning and maintenance occupations | 235 | 218 | 240 | 22 | 5 | 197 | 177 | 179 | 2 | -18 | |
| Personal care and service occupations | 137 | 46 | 68 | 22 | -69 | 127 | 37 | 29 | -7 | -98 | |
| Sales and related occupations | 350 | 366 | 386 | 20 | 37 | 26 | 23 | 18 | -5 | -8 | |
| Office and administrative support occupations | 656 | 476 | 483 | 7 | -173 | 850 | 868 | 809 | -58 | -41 | |
| Farming, fishing, and forestry occupations | 19 | 18 | 30 | 12 | 11 | 3 | 6 | 7 | 1 | 5 | |
| Construction and extraction occupations | 1,034 | 955 | 976 | 21 | -58 | 158 | 150 | 143 | -7 | -15 | |
| Installation, maintenance, and repair occupations | 524 | 495 | 488 | -7 | -36 | 115 | 124 | 131 | 6 | 15 | |
| Production occupations | 895 | 783 | 761 | -22 | -134 | 79 | 84 | 63 | -21 | -16 | |
| Transportation and material moving occupations | 1,068 | 1,201 | 1,098 | -103 | 30 | 226 | 219 | 274 | 55 | 48 | |
| *Includes other occupation categories, not shown separately. | |||||||||||
Source: CEPR analysis of Current Population Survey Outgoing Rotation Group, 2019-2021. Some differences in the “Change” columns reflect rounding.
Geographic Trends by Sector
Union membership varies significantly by state. Overall membership rates in 2021 ranged from 22.4 percent in Hawaii to 1.7 percent in South Carolina. Hawaii’s union membership rate first supplanted New York’s in 2018, and Hawaii has held onto the top spot ever since (Table 6). Hawaii maintained its overall lead despite sustaining one of the largest losses in public sector union membership between 2019 and 2021.
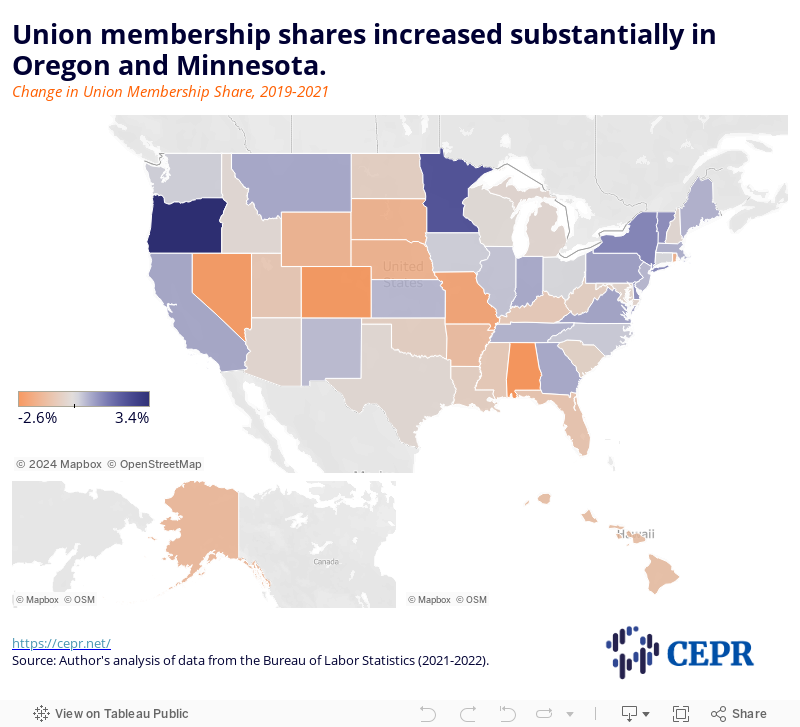
As shown in Figure 8, the largest overall share increases in union membership between 2019 and 2021 took place in Oregon (up 3.4 percentage points), followed by Minnesota (up 2.3 percentage points), New York (up 1.2 percentage points), and Vermont and Delaware (both up 1.1 percentage points). Oregon and Minnesota also added the most union members during this period, with the total number of members in each state increasing by 63,000 and 52,000, respectively (Table 7).
Nevada underwent both the largest public sector rate increase (up 7.2 percentage points) and the largest private sector rate decrease (down 3.3 percentage points). Oregon sustained the largest increase in private sector union density (up 2.1 percentage points), followed by Delaware and Minnesota (both up 1.6 percentage points). The biggest public sector share reductions were in South Dakota (down 9.2 percentage points), followed by Hawaii (down 6.2 percentage points), and Colorado (down 6.0 percentage points). Florida faced the largest overall contraction in union members (down 103,000), followed by Colorado (down 72,000).
| (percent of employees) | |||||||||||||||||
|---|---|---|---|---|---|---|---|---|---|---|---|---|---|---|---|---|---|
| All | Private Sector | Public Sector | |||||||||||||||
| 2019 | 2020 | 2021 | Change (2020-2021) | Change (2019-2021) | 2019 | 2020 | 2021 | Change (2020-2021) | Change (2019-2021) | 2019 | 2020 | 2021 | Change (2020-2021) | Change (2019-2021) | |||
| Alabama | 8.5 | 8.0 | 5.9 | -2.1 | -2.6 | 6.5 | 5.4 | 4.0 | -1.4 | -2.5 | 19.0 | 20.9 | 15.7 | -5.3 | -3.3 | ||
| Alaska | 17.1 | 17.7 | 15.8 | -1.9 | -1.3 | 8.4 | 9.5 | 7.5 | -2.0 | -0.9 | 39.8 | 41.1 | 37.9 | -3.2 | -1.9 | ||
| Arizona | 5.7 | 5.3 | 5.4 | 0.1 | -0.3 | 3.4 | 3.0 | 3.0 | 0.0 | -0.4 | 20.2 | 19.3 | 20.7 | 1.3 | 0.5 | ||
| Arkansas | 5.2 | 4.7 | 3.9 | -0.8 | -1.3 | 4.3 | 3.6 | 3.4 | -0.3 | -1.0 | 9.3 | 10.4 | 7.0 | -3.4 | -2.3 | ||
| California | 15.2 | 16.2 | 15.9 | -0.3 | 0.7 | 8.8 | 9.6 | 9.3 | -0.3 | 0.5 | 52.6 | 51.7 | 54.5 | 2.8 | 1.9 | ||
| Colorado | 9.0 | 7.4 | 6.5 | -0.9 | -2.5 | 6.0 | 5.0 | 4.1 | -0.9 | -1.9 | 24.2 | 19.5 | 18.2 | -1.3 | -6.0 | ||
| Connecticut | 14.5 | 17.1 | 14.6 | -2.5 | 0.1 | 7.1 | 8.6 | 7.3 | -1.4 | 0.2 | 62.7 | 74.1 | 68.3 | -5.8 | 5.6 | ||
| Delaware | 8.7 | 9.7 | 9.7 | 0.0 | 1.0 | 4.4 | 4.5 | 6.0 | 1.5 | 1.6 | 34.8 | 38.2 | 29.6 | -8.6 | -5.2 | ||
| District of Columbia | 9.3 | 8.6 | 8.9 | 0.3 | -0.4 | 5.3 | 4.7 | 5.0 | 0.3 | -0.4 | 20.5 | 18.0 | 19.4 | 1.4 | -1.1 | ||
| Florida | 6.2 | 6.4 | 5.2 | -1.2 | -1.0 | 3.1 | 3.6 | 2.8 | -0.8 | -0.3 | 26.5 | 24.8 | 22.5 | -2.3 | -4.0 | ||
| Georgia | 4.1 | 4.6 | 4.8 | 0.2 | 0.7 | 3.2 | 3.0 | 2.8 | -0.1 | -0.3 | 9.1 | 14.1 | 15.4 | 1.3 | 6.3 | ||
| Hawaii | 23.5 | 23.7 | 22.4 | -1.3 | -1.1 | 14.6 | 13.3 | 14.5 | 1.2 | -0.1 | 52.7 | 53.7 | 46.5 | -7.2 | -6.2 | ||
| Idaho | 4.9 | 5.6 | 4.7 | -0.9 | -0.2 | 3.0 | 3.5 | 3.0 | -0.5 | 0.0 | 17.4 | 17.2 | 14.7 | -2.4 | -2.7 | ||
| Illinois | 13.6 | 14.3 | 13.9 | -0.4 | 0.3 | 8.9 | 8.5 | 8.6 | 0.1 | -0.3 | 45.8 | 55.0 | 48.7 | -6.3 | 2.9 | ||
| Indiana | 8.3 | 8.3 | 9.0 | 0.7 | 0.7 | 6.7 | 5.8 | 6.2 | 0.4 | -0.5 | 21.0 | 26.9 | 27.6 | 0.6 | 6.6 | ||
| Iowa | 6.3 | 6.6 | 6.5 | -0.1 | 0.2 | 4.0 | 3.8 | 4.1 | 0.3 | 0.1 | 18.5 | 20.6 | 20.1 | -0.6 | 1.6 | ||
| Kansas | 8.7 | 8.9 | 9.2 | 0.3 | 0.5 | 5.6 | 6.4 | 6.9 | 0.5 | 1.3 | 22.5 | 20.9 | 20.0 | -0.9 | -2.6 | ||
| Kentucky | 8.0 | 7.5 | 7.2 | -0.3 | -0.8 | 6.7 | 6.5 | 6.3 | -0.2 | -0.3 | 16.6 | 12.2 | 12.2 | 0.0 | -4.4 | ||
| Louisiana | 5.3 | 5.9 | 4.7 | -1.2 | -0.6 | 3.4 | 3.8 | 2.9 | -0.9 | -0.6 | 14.1 | 15.4 | 13.2 | -2.2 | -0.9 | ||
| Maine | 11.8 | 14.7 | 12.4 | -2.3 | 0.6 | 5.6 | 6.4 | 5.9 | -0.5 | 0.3 | 45.7 | 46.6 | 45.3 | -1.3 | -0.4 | ||
| Maryland | 11.3 | 13.1 | 11.0 | -2.1 | -0.3 | 4.6 | 6.3 | 5.5 | -0.8 | 0.9 | 33.5 | 33.5 | 28.4 | -5.1 | -5.1 | ||
| Massachusetts | 12.0 | 12.0 | 12.6 | 0.6 | 0.6 | 6.6 | 6.4 | 7.2 | 0.8 | 0.6 | 51.2 | 53.8 | 51.3 | -2.5 | 0.1 | ||
| Michigan | 13.6 | 15.2 | 13.3 | -1.9 | -0.3 | 9.8 | 11.1 | 9.1 | -2.0 | -0.7 | 45.1 | 44.2 | 45.1 | 0.9 | 0.0 | ||
| Minnesota | 13.7 | 15.8 | 16.0 | 0.1 | 2.3 | 7.4 | 7.5 | 9.0 | 1.5 | 1.6 | 53.7 | 61.5 | 54.7 | -6.8 | 1.0 | ||
| Mississippi | 6.3 | 7.1 | 5.5 | -1.6 | -0.8 | 4.1 | 5.2 | 4.1 | -1.1 | 0.0 | 16.2 | 16.5 | 12.1 | -4.4 | -4.1 | ||
| Missouri | 11.1 | 9.4 | 9.0 | -0.4 | -2.1 | 8.2 | 6.4 | 6.6 | 0.2 | -1.6 | 28.1 | 27.8 | 23.4 | -4.4 | -4.7 | ||
| Montana | 10.5 | 12.0 | 11.2 | -0.8 | 0.7 | 5.3 | 5.6 | 6.3 | 0.7 | 1.0 | 34.5 | 38.2 | 32.3 | -5.9 | -2.1 | ||
| Nebraska | 8.4 | 9.6 | 6.8 | -2.8 | -1.6 | 4.6 | 4.6 | 4.1 | -0.6 | -0.5 | 28.0 | 35.1 | 23.0 | -12.1 | -5.0 | ||
| Nevada | 14.6 | 13.4 | 12.2 | -1.2 | -2.4 | 11.6 | 9.6 | 8.3 | -1.3 | -3.3 | 32.9 | 34.8 | 40.1 | 5.3 | 7.2 | ||
| New Hampshire | 10.3 | 9.8 | 10.1 | 0.3 | -0.2 | 5.2 | 4.3 | 4.3 | 0.0 | -0.9 | 44.7 | 44.1 | 47.0 | 2.9 | 2.3 | ||
| New Jersey | 15.7 | 16.1 | 16.2 | 0.1 | 0.5 | 8.0 | 8.3 | 9.0 | 0.7 | 1.0 | 58.1 | 59.3 | 59.3 | 0.0 | 1.2 | ||
| New Mexico | 7.1 | 7.1 | 7.5 | 0.4 | 0.4 | 3.6 | 3.7 | 4.2 | 0.6 | 0.6 | 17.2 | 16.7 | 17.3 | 0.6 | 0.1 | ||
| New York | 21.0 | 22.0 | 22.2 | 0.2 | 1.2 | 12.7 | 12.6 | 13.1 | 0.5 | 0.4 | 65.5 | 68.3 | 66.7 | -1.7 | 1.2 | ||
| North Carolina | 2.3 | 3.1 | 2.6 | -0.6 | 0.3 | 1.2 | 1.8 | 1.5 | -0.3 | 0.3 | 8.5 | 11.1 | 9.1 | -2.0 | 0.7 | ||
| North Dakota | 6.0 | 6.2 | 5.4 | -0.8 | -0.6 | 3.3 | 3.7 | 3.0 | -0.7 | -0.4 | 19.1 | 18.1 | 16.9 | -1.2 | -2.2 | ||
| Ohio | 11.9 | 13.2 | 12.0 | -1.2 | 0.1 | 6.9 | 7.1 | 6.5 | -0.6 | -0.4 | 42.4 | 45.5 | 45.3 | -0.2 | 2.9 | ||
| Oklahoma | 6.2 | 6.0 | 5.6 | -0.4 | -0.6 | 3.1 | 3.8 | 2.7 | -1.0 | -0.3 | 20.4 | 15.4 | 19.9 | 4.5 | -0.5 | ||
| Oregon | 14.4 | 16.2 | 17.8 | 1.6 | 3.4 | 7.3 | 9.0 | 9.4 | 0.5 | 2.1 | 53.2 | 52.3 | 57.7 | 5.4 | 4.5 | ||
| Pennsylvania | 12.0 | 13.5 | 12.9 | -0.7 | 0.9 | 7.1 | 8.2 | 7.3 | -0.9 | 0.2 | 52.6 | 53.8 | 53.3 | -0.5 | 0.7 | ||
| Rhode Island | 17.4 | 17.8 | 15.7 | -2.1 | -1.7 | 10.0 | 9.9 | 8.7 | -1.2 | -1.2 | 62.3 | 67.2 | 62.4 | -4.7 | 0.2 | ||
| South Carolina | 2.2 | 2.9 | 1.7 | -1.2 | -0.5 | 1.3 | 1.9 | 1.1 | -0.8 | -0.2 | 7.4 | 8.2 | 4.6 | -3.6 | -2.8 | ||
| South Dakota | 5.6 | 4.3 | 4.0 | -0.3 | -1.6 | 2.6 | 2.7 | 2.5 | -0.2 | -0.1 | 21.3 | 13.4 | 12.1 | -1.3 | -9.2 | ||
| Tennessee | 4.6 | 4.4 | 5.2 | 0.8 | 0.6 | 2.9 | 2.8 | 3.0 | 0.2 | 0.1 | 14.7 | 13.5 | 18.1 | 4.6 | 3.4 | ||
| Texas | 4.0 | 4.9 | 3.8 | -1.1 | -0.2 | 2.5 | 2.7 | 2.2 | -0.5 | -0.3 | 14.2 | 17.2 | 13.5 | -3.7 | -0.8 | ||
| Utah | 4.4 | 3.7 | 3.5 | -0.2 | -0.9 | 3.1 | 1.8 | 1.7 | -0.1 | -1.4 | 11.1 | 12.7 | 13.4 | 0.7 | 2.2 | ||
| Vermont | 11.2 | 11.8 | 12.3 | 0.5 | 1.1 | 5.3 | 5.5 | 6.0 | 0.5 | 0.7 | 42.8 | 41.5 | 40.0 | -1.6 | -2.8 | ||
| Virginia | 4.0 | 4.4 | 4.8 | 0.4 | 0.8 | 2.5 | 2.1 | 2.4 | 0.4 | 0.0 | 9.9 | 12.6 | 12.5 | -0.1 | 2.5 | ||
| Washington | 18.8 | 17.4 | 19.0 | 1.6 | 0.2 | 12.0 | 10.3 | 10.9 | 0.7 | -1.1 | 52.3 | 50.6 | 52.7 | 2.1 | 0.4 | ||
| West Virginia | 10.2 | 10.7 | 9.6 | -1.1 | -0.6 | 7.8 | 7.3 | 6.1 | -1.3 | -1.7 | 21.2 | 24.7 | 23.2 | -1.5 | 2.0 | ||
| Wisconsin | 8.1 | 8.7 | 7.9 | -0.8 | -0.2 | 5.1 | 6.5 | 5.7 | -0.8 | 0.6 | 25.7 | 22.1 | 21.5 | -0.6 | -4.2 | ||
| Wyoming | 7.3 | 7.6 | 5.7 | -1.9 | -1.6 | 5.1 | 5.1 | 4.1 | -1.0 | -1.0 | 13.6 | 14.1 | 10.3 | -3.9 | -3.4 | ||
Source: “All” category from Bureau of Labor Statistics (2021-2022); public and private sector data from CEPR analysis of Current Population Survey Outgoing Rotation Group, 2019-2021. Some differences in the “Change” columns reflect rounding.
Figure 8
| (thousands of employees) | |||||||||||||||||
|---|---|---|---|---|---|---|---|---|---|---|---|---|---|---|---|---|---|
| All | Private Sector | Public Sector | |||||||||||||||
| 2019 | 2020 | 2021 | Change (2020-2021) | Change (2019-2021) | 2019 | 2020 | 2021 | Change (2020-2021) | Change (2019-2021) | 2019 | 2020 | 2021 | Change (2020-2021) | Change (2019-2021) | |||
| Alabama | 173 | 151 | 115 | -36 | -58 | 112 | 85 | 65 | -20 | -47 | 62 | 66 | 49 | -16 | -12 | ||
| Alaska | 48 | 49 | 46 | -3 | -2 | 17 | 20 | 16 | -4 | -1 | 31 | 30 | 30 | 0 | -1 | ||
| Arizona | 174 | 155 | 167 | 13 | -7 | 90 | 74 | 81 | 7 | -9 | 84 | 80 | 86 | 6 | 2 | ||
| Arkansas | 62 | 55 | 46 | -9 | -16 | 44 | 35 | 33 | -2 | -11 | 18 | 19 | 12 | -7 | -6 | ||
| California | 2,504 | 2,441 | 2,468 | 27 | -36 | 1,247 | 1,221 | 1,236 | 15 | -11 | 1,253 | 1,218 | 1,233 | 15 | -20 | ||
| Colorado | 237 | 182 | 165 | -17 | -72 | 132 | 104 | 86 | -18 | -46 | 107 | 79 | 79 | 0 | -28 | ||
| Connecticut | 244 | 262 | 223 | -39 | -21 | 103 | 115 | 98 | -17 | -5 | 141 | 146 | 124 | -21 | -16 | ||
| Delaware | 38 | 41 | 42 | 1 | 4 | 16 | 16 | 22 | 6 | 6 | 21 | 26 | 20 | -6 | -1 | ||
| District of Columbia | 34 | 30 | 31 | 1 | -3 | 14 | 11 | 13 | 1 | -2 | 19 | 18 | 19 | 1 | -1 | ||
| Florida | 551 | 524 | 448 | -76 | -103 | 233 | 252 | 211 | -40 | -21 | 319 | 274 | 238 | -36 | -81 | ||
| Georgia | 180 | 194 | 211 | 17 | 31 | 119 | 104 | 105 | 1 | -14 | 60 | 90 | 106 | 16 | 45 | ||
| Hawaii | 135 | 120 | 121 | 1 | -14 | 64 | 50 | 59 | 9 | -5 | 70 | 70 | 62 | -8 | -8 | ||
| Idaho | 37 | 41 | 36 | -5 | -1 | 20 | 22 | 20 | -2 | 0 | 18 | 19 | 16 | -3 | -2 | ||
| Illinois | 771 | 739 | 752 | 13 | -19 | 438 | 386 | 402 | 16 | -36 | 334 | 350 | 350 | 0 | 17 | ||
| Indiana | 249 | 235 | 256 | 21 | 7 | 178 | 145 | 153 | 8 | -25 | 71 | 90 | 103 | 13 | 32 | ||
| Iowa | 97 | 93 | 93 | 0 | -4 | 51 | 44 | 49 | 5 | -2 | 46 | 48 | 43 | -4 | -2 | ||
| Kansas | 112 | 114 | 120 | 6 | 8 | 58 | 68 | 73 | 5 | 15 | 53 | 45 | 46 | 1 | -7 | ||
| Kentucky | 144 | 127 | 126 | -1 | -18 | 102 | 92 | 94 | 2 | -9 | 41 | 34 | 31 | -3 | -9 | ||
| Louisiana | 94 | 99 | 81 | -18 | -13 | 50 | 52 | 40 | -12 | -9 | 44 | 47 | 40 | -7 | -4 | ||
| Maine | 69 | 82 | 70 | -12 | 1 | 28 | 28 | 28 | -1 | 0 | 42 | 53 | 42 | -11 | 0 | ||
| Maryland | 330 | 351 | 295 | -56 | -35 | 103 | 126 | 112 | -15 | 9 | 226 | 226 | 182 | -44 | -44 | ||
| Massachusetts | 406 | 357 | 402 | 45 | -4 | 197 | 170 | 201 | 31 | 3 | 209 | 188 | 201 | 13 | -8 | ||
| Michigan | 589 | 604 | 540 | -64 | -49 | 379 | 387 | 326 | -61 | -54 | 212 | 218 | 213 | -5 | 1 | ||
| Minnesota | 364 | 398 | 416 | 18 | 52 | 171 | 160 | 199 | 39 | 28 | 193 | 238 | 217 | -21 | 25 | ||
| Mississippi | 70 | 74 | 59 | -15 | -11 | 37 | 44 | 36 | -8 | 0 | 33 | 30 | 23 | -7 | -10 | ||
| Missouri | 297 | 238 | 235 | -3 | -62 | 185 | 139 | 147 | 8 | -38 | 111 | 98 | 88 | -10 | -23 | ||
| Montana | 46 | 50 | 49 | -1 | 3 | 19 | 19 | 22 | 3 | 3 | 27 | 31 | 27 | -5 | 0 | ||
| Nebraska | 75 | 85 | 61 | -24 | -14 | 34 | 34 | 31 | -3 | -3 | 40 | 51 | 30 | -21 | -10 | ||
| Nevada | 201 | 161 | 153 | -8 | -48 | 138 | 99 | 91 | -8 | -47 | 63 | 63 | 61 | -1 | -2 | ||
| New Hampshire | 69 | 62 | 65 | 3 | -4 | 31 | 23 | 24 | 1 | -7 | 39 | 38 | 41 | 2 | 2 | ||
| New Jersey | 642 | 600 | 608 | 8 | -34 | 279 | 262 | 292 | 29 | 13 | 363 | 336 | 317 | -19 | -46 | ||
| New Mexico | 58 | 53 | 58 | 5 | 0 | 22 | 20 | 24 | 5 | 2 | 36 | 33 | 33 | 0 | -2 | ||
| New York | 1,732 | 1,661 | 1,729 | 68 | -3 | 883 | 789 | 843 | 54 | -40 | 849 | 874 | 885 | 11 | 36 | ||
| North Carolina | 102 | 129 | 108 | -21 | 6 | 44 | 65 | 55 | -10 | 12 | 59 | 65 | 53 | -12 | -6 | ||
| North Dakota | 21 | 21 | 19 | -2 | -2 | 10 | 10 | 9 | -2 | -1 | 11 | 11 | 10 | -1 | -1 | ||
| Ohio | 610 | 637 | 596 | -41 | -14 | 305 | 288 | 279 | -9 | -27 | 305 | 347 | 317 | -30 | 12 | ||
| Oklahoma | 96 | 90 | 87 | -3 | -9 | 39 | 46 | 35 | -10 | -4 | 58 | 44 | 51 | 7 | -6 | ||
| Oregon | 255 | 275 | 318 | 43 | 63 | 110 | 126 | 139 | 13 | 29 | 145 | 148 | 179 | 31 | 34 | ||
| Pennsylvania | 676 | 717 | 693 | -24 | 17 | 357 | 384 | 344 | -40 | -13 | 319 | 335 | 348 | 14 | 29 | ||
| Rhode Island | 83 | 81 | 75 | -6 | -8 | 40 | 39 | 36 | -3 | -4 | 42 | 42 | 39 | -3 | -3 | ||
| South Carolina | 47 | 59 | 34 | -25 | -13 | 23 | 32 | 19 | -13 | -4 | 24 | 27 | 16 | -12 | -9 | ||
| South Dakota | 22 | 17 | 16 | -1 | -6 | 9 | 9 | 8 | 0 | 0 | 13 | 8 | 7 | 0 | -6 | ||
| Tennessee | 135 | 117 | 145 | 28 | 10 | 72 | 65 | 72 | 7 | -1 | 62 | 52 | 73 | 22 | 11 | ||
| Texas | 497 | 563 | 454 | -109 | -43 | 267 | 268 | 230 | -38 | -37 | 230 | 298 | 223 | -75 | -7 | ||
| Utah | 62 | 51 | 51 | 0 | -11 | 36 | 21 | 21 | 1 | -15 | 25 | 31 | 30 | -1 | 4 | ||
| Vermont | 33 | 31 | 32 | 1 | -1 | 13 | 12 | 13 | 1 | 0 | 20 | 19 | 20 | 0 | 0 | ||
| Virginia | 156 | 164 | 176 | 12 | 20 | 76 | 59 | 69 | 10 | -7 | 80 | 105 | 106 | 1 | 26 | ||
| Washington | 638 | 557 | 629 | 72 | -9 | 339 | 271 | 292 | 21 | -47 | 298 | 286 | 336 | 50 | 37 | ||
| West Virginia | 72 | 71 | 66 | -5 | -6 | 45 | 40 | 34 | -6 | -12 | 26 | 31 | 33 | 2 | 7 | ||
| Wisconsin | 218 | 227 | 215 | -13 | -3 | 119 | 143 | 132 | -11 | 13 | 99 | 84 | 82 | -1 | -17 | ||
| Wyoming | 18 | 18 | 13 | -5 | -5 | 9 | 9 | 7 | -2 | -2 | 8 | 9 | 6 | -3 | -2 | ||
Source: “All” category from Bureau of Labor Statistics (2021-2022); public and private sector data from CEPR analysis of Current Population Survey Outgoing Rotation Group, 2019-2021. Some differences in the “Change” columns reflect rounding.
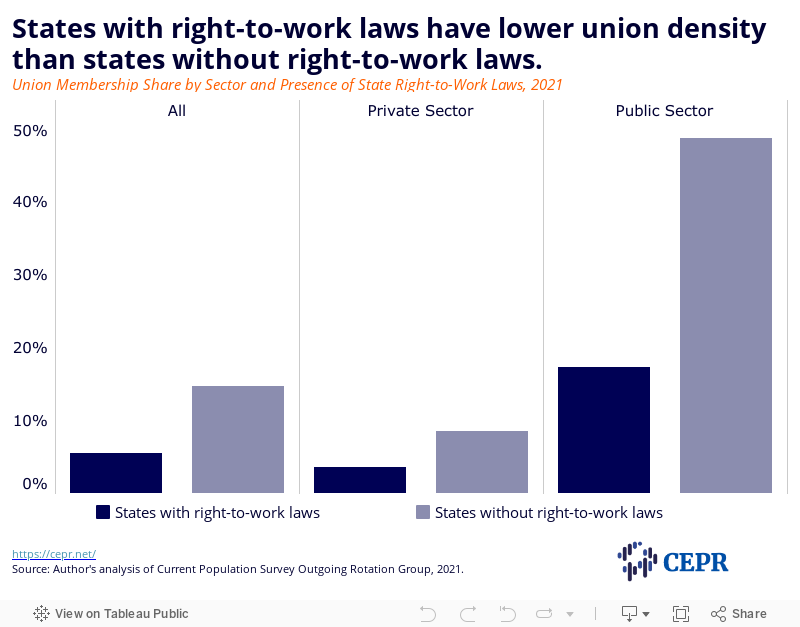
Union membership tends to cluster in states based on their legislative and political environments. Membership is lower in the 27 states with so-called “right-to-work” laws. Union contracts in the US are legally required to cover everyone eligible to join the union, regardless of actual membership status. Those who opt not to join a union but still benefit from a union contract have historically paid fair share fees, recognizing the time and resources required for negotiations and dispute resolution. In states with right-to-work laws, nonmembers who are covered by a union contract do not pay such fees, potentially creating a free rider problem. State right-to-work laws primarily impact the private sector; public sector unions have been prohibited from charging fair share fees since the Supreme Court’s landmark 2018 ruling in Janus v. AFSCME.
The overall unionization rate was 9.2 percentage points lower in states with right-to-work laws in 2021 (Figure 9). Despite Janus v. AFSCME rendering such laws superfluous in the public sector, the union membership gap between states with and without these laws is bigger in the public sector than in the private sector. In 2021, the share of public sector employees who were union members was more than two and half times as high in states without right-to-work laws than in states with right-to-work laws (a difference of 31.3 percentage points). Private sector union density was more than twice as high in states without right-to-work laws in 2021, with a difference of 5 percentage points between states with and without such legislation.
Figure 9
Union membership also correlates with electoral politics. In 2021, the overall union membership share was 7.7 percentage points higher in states that voted for President Joe Biden in the 2020 presidential election than in states that voted for Donald Trump. In the public sector, the union membership share was 24.9 percentage points higher in states that voted for President Biden, a difference of over 130 percent.
Right-to-work laws and Republican-dominated electoral politics tend to intersect, and there is evidence that the former may directly encourage the latter. A study of bordering counties found that the enactment of right-to-work legislation corresponded with a 3.5 percentage point reduction in Democratic vote shares. The study authors also found that right-to-work laws lowered turnout in both federal and state races, and that the effect was especially chilling for working-class voters.
Another study found that right-to-work laws and their accompanying union membership declines negatively affect population health, leading to increased mortality among Black and white workers without college degrees. These studies suggest that anti-union legislation has negative spillover effects affecting both election fairness and public health.
Policy Implications
Widespread organizing has yet to materialize in the data, which continued to show declines in union membership in 2021. However, signs point to a potential union resurgence. While it is exciting to see workers emerging victorious in their union organizing efforts despite the significant barriers that remain, it is important to tackle the policy hurdles that threaten to undermine continued success.
Legislation like the Protecting the Right to Organize (PRO) Act that removes obstacles to organizing is especially important to allow workers to build on the historic momentum generated during the pandemic. Among other things, this legislation would prohibit some of the dubious tactics employers use to interfere with union elections, close loopholes that allow employers to weaponize an employee’s immigration status to prevent them from organizing, and impose harsher penalties for violating workers’ rights. It would also supersede state right-to-work laws, allowing security agreements between unions and employers that would allow unions to collect fair share fees.
Public sector workers must also be guaranteed the right to join a union and to bargain collectively via the Public Service Freedom to Negotiate Act, a version of which was revived in 2021. A handful of states forbid certain government employees from joining unions altogether, while others prohibit them from engaging in collective bargaining. This legislation would establish both of these activities as fundamental rights for all workers, including those in the public sector.
It is also important not to discount the role of the NLRB. Key executive appointments have transformed an agency that essentially functioned as a roadblock to workers’ rights under the previous administration. The Biden administration’s appointment of Jennifer Abruzzo as general counsel has proved especially effective. Her stewardship has been credited as indispensable to some of the union victories that have taken place in recent months.
Even with those improvements, however, there is more to be done. The NLRB must be sufficiently funded to fulfill its mission. While the Biden administration proposed a much needed increase, Congress ultimately opted to keep the NLRB’s budgetary allocation flat. It is remarkable what the agency has been able to accomplish despite its limited resources, but its chronic underfunding puts unnecessary strain on its staff and ultimately undermines their ability to protect America’s workers.
Finally, it is important that those who wish to organize unions in their workplaces continue doing so. Despite the hardships outlined above, undeterred workers at Amazon, Starbucks, and elsewhere have triumphed over increasingly brazen attempts by employers to bust their unions. Their perseverance, and the promise it holds for the labor movement in the US, is certainly cause for celebration this May Day.

