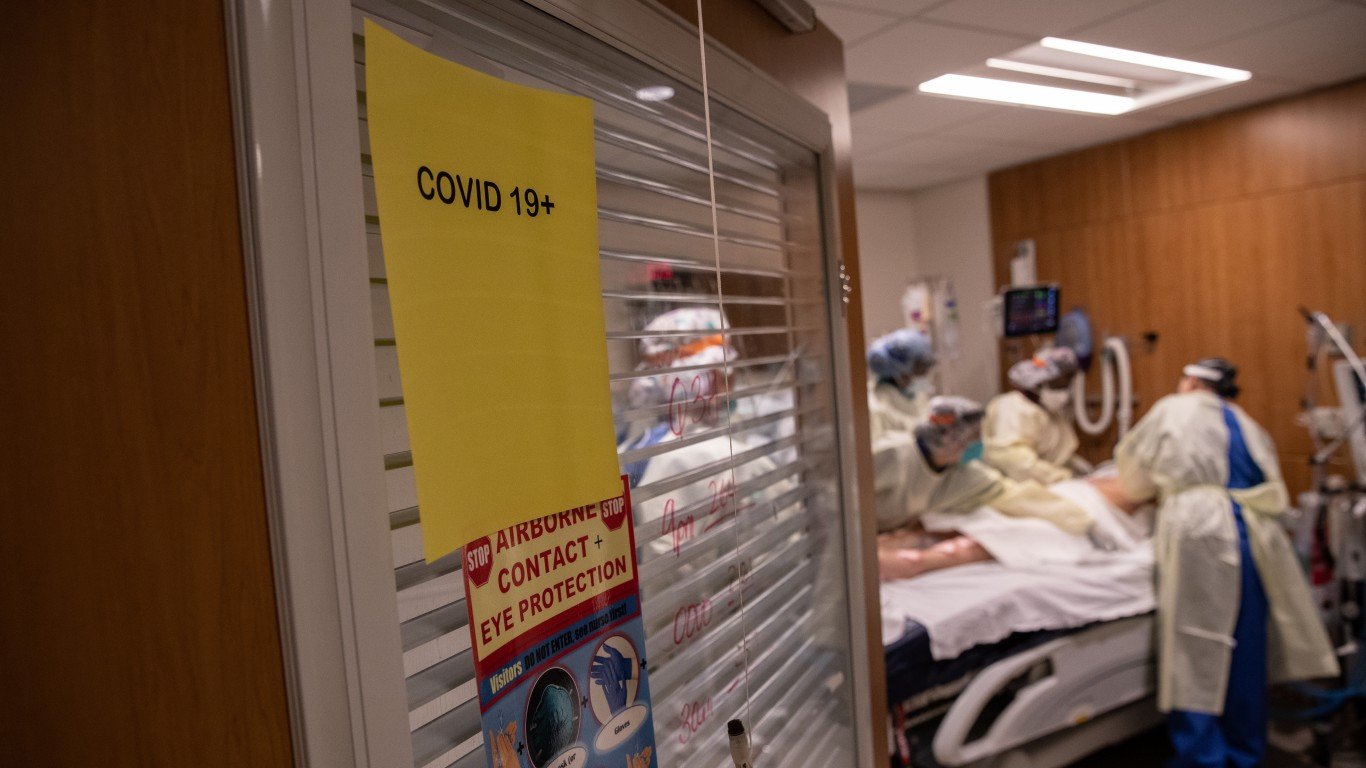
The U.S. has reported more than 36.5 million confirmed COVID-19 cases as of August 17, 2021. More than 610,000 Americans have died of COVID-19 — the highest death toll of any country.
The virus has spread throughout the country in a way that has been difficult to predict, surging in one region, then showing signs of improvement, and then reappearing in other regions. Though local outbreaks may ebb and flow, the current surge in cases has been felt nearly nationwide, leading to new travel restrictions and business closures around the country.
Nationwide, there were an average of 37.9 daily new coronavirus cases per 100,000 Americans in the week ending August 17, 2021. Cumulatively, the U.S. has reported 11,170.9 cases per 100,000 Americans, and 188.5 deaths per 100,000 Americans.
The extent of the spread of the novel coronavirus continues to vary considerably from state to state, and even from county to county. Even as the number of daily new cases is flattening or even declining in some parts of the country, new cases are surging at a growing rate in others.
The coronavirus has spread to different parts of the country in different stages throughout the pandemic. In the spring, the worst hit states were in the Northeast, as New York City became the epicenter of the nation’s crisis. The virus spread to states throughout the Sun Belt in the summer, and hit states in the Midwest and West during the fall. By November 2020, nearly every state was categorized as a COVID-19 hot spot, according to definitions based on new cases per capita from the nonprofit health organization Kaiser Family Foundation.
In Mississippi, there were an average of 98.1 daily new coronavirus cases per 100,000 residents in the week ending August 17, 2021. The Mississippi case growth rate ranks as the 3rd highest of all 50 states.
While the nation’s largest counties were hit hardest in the early months of the pandemic, nearly every county has suffered from the coronavirus. Outbreaks can occur quickly in places where large numbers of people tend to congregate, leaving counties with colleges, correctional facilities, and nursing homes particularly at risk.
In Neshoba County, there were an average of 271.9 new confirmed cases per day per 100,000 residents in the week ending August 17, 2021 — the highest rate of any county in Mississippi. Since the pandemic began, the county has reported 5,263 confirmed cases, or 17,916.0 cases per 100,000.
There have been 182 deaths, or 619.6 deaths per 100,000 residents.
To determine the county in each state with the highest rate of daily cases of the virus, 24/7 Wall St. compiled and reviewed data from state and local health departments. We ranked counties according to the average new number of cases per 100,000 residents per day during the week ending August 17, 2021. Population data used to adjust case and death totals came from the U.S. Census Bureau’s 2018 American Community Survey and are five-year estimates.
| No. | County | Population | New daily cases per 100,000 | Total cases | Total deaths | Cases per 100,000 | Deaths per 100,000 |
|---|---|---|---|---|---|---|---|
| 1 | Neshoba County | 29,376 | 271.9 | 5,263 | 182 | 17,916.0 | 619.6 |
| 2 | Stone County | 18,375 | 174.1 | 2,731 | 38 | 14,862.6 | 206.8 |
| 3 | George County | 23,710 | 170.9 | 3,246 | 54 | 13,690.4 | 227.8 |
| 4 | Wayne County | 20,422 | 170.2 | 3,163 | 47 | 15,488.2 | 230.1 |
| 5 | Forrest County | 75,517 | 159.2 | 10,371 | 169 | 13,733.3 | 223.8 |
| 6 | Covington County | 19,091 | 151.8 | 3,333 | 86 | 17,458.5 | 450.5 |
| 7 | Lamar County | 61,223 | 149.6 | 8,274 | 94 | 13,514.5 | 153.5 |
| 8 | Harrison County | 202,626 | 144.3 | 24,410 | 345 | 12,046.8 | 170.3 |
| 9 | Newton County | 21,524 | 142.4 | 3,017 | 65 | 14,016.9 | 302.0 |
| 10 | Jackson County | 142,014 | 135.8 | 17,861 | 264 | 12,576.9 | 185.9 |
| 11 | Tippah County | 21,990 | 132.4 | 3,484 | 71 | 15,843.6 | 322.9 |
| 12 | Lauderdale County | 77,323 | 129.1 | 9,199 | 249 | 11,896.8 | 322.0 |
| 13 | Attala County | 18,581 | 123.8 | 2,564 | 75 | 13,799.0 | 403.6 |
| 14 | Pearl River County | 55,149 | 120.2 | 6,121 | 160 | 11,099.0 | 290.1 |
| 15 | Webster County | 9,828 | 117.5 | 1,375 | 32 | 13,990.6 | 325.6 |
| 16 | Jasper County | 16,529 | 116.4 | 2,573 | 48 | 15,566.6 | 290.4 |
| 17 | Jones County | 68,454 | 115.7 | 10,165 | 174 | 14,849.4 | 254.2 |
| 18 | Hancock County | 46,653 | 113.7 | 5,018 | 90 | 10,756.0 | 192.9 |
| 19 | Leake County | 22,870 | 112.1 | 3,193 | 77 | 13,961.5 | 336.7 |
| 20 | Lowndes County | 59,437 | 105.3 | 7,907 | 154 | 13,303.2 | 259.1 |
| 21 | Jefferson Davis County | 11,495 | 104.9 | 1,324 | 35 | 11,518.1 | 304.5 |
| 22 | Greene County | 13,714 | 97.6 | 1,586 | 38 | 11,564.8 | 277.1 |
| 23 | Union County | 28,356 | 96.7 | 4,701 | 79 | 16,578.5 | 278.6 |
| 24 | Kemper County | 10,107 | 95.7 | 1,146 | 31 | 11,338.7 | 306.7 |
| 25 | Prentiss County | 25,360 | 95.5 | 3,295 | 64 | 12,992.9 | 252.4 |
| 26 | Lawrence County | 12,630 | 93.4 | 1,587 | 27 | 12,565.3 | 213.8 |
| 27 | Lee County | 84,915 | 92.0 | 11,759 | 184 | 13,848.0 | 216.7 |
| 28 | Clarke County | 15,928 | 91.6 | 2,068 | 81 | 12,983.4 | 508.5 |
| 29 | Clay County | 19,808 | 91.6 | 2,230 | 55 | 11,258.1 | 277.7 |
| 30 | Marion County | 25,202 | 89.7 | 3,171 | 85 | 12,582.3 | 337.3 |
| 31 | Amite County | 12,468 | 86.4 | 1,519 | 44 | 12,183.2 | 352.9 |
| 32 | Scott County | 28,415 | 83.2 | 3,742 | 78 | 13,169.1 | 274.5 |
| 33 | Oktibbeha County | 49,481 | 83.0 | 5,518 | 99 | 11,151.8 | 200.1 |
| 34 | Calhoun County | 14,571 | 82.6 | 1,991 | 33 | 13,664.1 | 226.5 |
| 35 | Monroe County | 35,840 | 81.3 | 4,728 | 138 | 13,192.0 | 385.0 |
| 36 | Itawamba County | 23,480 | 80.5 | 3,396 | 82 | 14,463.4 | 349.2 |
| 37 | Perry County | 12,028 | 77.9 | 1,471 | 39 | 12,229.8 | 324.2 |
| 38 | Pike County | 39,737 | 75.2 | 4,075 | 116 | 10,254.9 | 291.9 |
| 39 | Benton County | 8,253 | 75.2 | 1,156 | 25 | 14,007.0 | 302.9 |
| 40 | Warren County | 47,075 | 74.7 | 5,192 | 128 | 11,029.2 | 271.9 |
| 41 | Walthall County | 14,601 | 74.5 | 1,616 | 51 | 11,067.7 | 349.3 |
| 42 | Yalobusha County | 12,421 | 74.4 | 1,844 | 41 | 14,845.8 | 330.1 |
| 43 | Alcorn County | 37,180 | 73.8 | 3,919 | 75 | 10,540.6 | 201.7 |
| 44 | Smith County | 16,063 | 73.4 | 1,973 | 37 | 12,282.9 | 230.3 |
| 45 | Choctaw County | 8,321 | 73.1 | 912 | 19 | 10,960.2 | 228.3 |
| 46 | Winston County | 18,358 | 72.0 | 2,512 | 85 | 13,683.4 | 463.0 |
| 47 | Rankin County | 151,240 | 71.2 | 17,004 | 301 | 11,243.1 | 199.0 |
| 48 | Bolivar County | 32,592 | 70.7 | 5,241 | 137 | 16,080.6 | 420.3 |
| 49 | Grenada County | 21,278 | 70.6 | 2,890 | 89 | 13,582.1 | 418.3 |
| 50 | Chickasaw County | 17,279 | 69.3 | 2,349 | 60 | 13,594.5 | 347.2 |
| 51 | Montgomery County | 10,198 | 69.2 | 1,419 | 46 | 13,914.5 | 451.1 |
| 52 | Simpson County | 27,073 | 69.0 | 3,488 | 95 | 12,883.7 | 350.9 |
| 53 | Adams County | 31,547 | 68.0 | 3,759 | 90 | 11,915.6 | 285.3 |
| 54 | Carroll County | 10,129 | 67.7 | 1,347 | 31 | 13,298.4 | 306.1 |
| 55 | Lafayette County | 53,459 | 67.0 | 7,012 | 127 | 13,116.6 | 237.6 |
| 56 | Noxubee County | 10,828 | 66.3 | 1,449 | 36 | 13,382.0 | 332.5 |
| 57 | Yazoo County | 27,974 | 66.3 | 3,620 | 79 | 12,940.6 | 282.4 |
| 58 | Hinds County | 241,774 | 64.6 | 26,196 | 473 | 10,834.9 | 195.6 |
| 59 | Pontotoc County | 31,315 | 64.5 | 4,777 | 76 | 15,254.7 | 242.7 |
| 60 | Wilkinson County | 8,990 | 64.2 | 870 | 33 | 9,677.4 | 367.1 |
| 61 | Marshall County | 35,787 | 63.8 | 4,977 | 106 | 13,907.3 | 296.2 |
| 62 | Leflore County | 29,804 | 62.7 | 3,890 | 127 | 13,051.9 | 426.1 |
| 63 | Holmes County | 18,075 | 61.1 | 2,159 | 75 | 11,944.7 | 414.9 |
| 64 | Copiah County | 28,721 | 56.9 | 3,514 | 70 | 12,235.0 | 243.7 |
| 65 | Sunflower County | 26,532 | 56.7 | 3,682 | 95 | 13,877.6 | 358.1 |
| 66 | DeSoto County | 176,132 | 56.6 | 24,662 | 288 | 14,002.0 | 163.5 |
| 67 | Jefferson County | 7,346 | 55.8 | 775 | 29 | 10,550.0 | 394.8 |
| 68 | Madison County | 103,498 | 55.5 | 11,789 | 235 | 11,390.6 | 227.1 |
| 69 | Franklin County | 7,757 | 55.2 | 934 | 24 | 12,040.7 | 309.4 |
| 70 | Tishomingo County | 19,478 | 53.1 | 2,515 | 70 | 12,912.0 | 359.4 |
| 71 | Coahoma County | 23,802 | 52.3 | 3,297 | 86 | 13,851.8 | 361.3 |
| 72 | Sharkey County | 4,511 | 52.0 | 547 | 19 | 12,125.9 | 421.2 |
| 73 | Quitman County | 7,372 | 51.8 | 904 | 20 | 12,262.6 | 271.3 |
| 74 | Claiborne County | 9,120 | 47.4 | 1,115 | 31 | 12,225.9 | 339.9 |
| 75 | Issaquena County | 1,328 | 46.1 | 179 | 6 | 13,478.9 | 451.8 |
| 76 | Tunica County | 10,170 | 43.5 | 1,229 | 27 | 12,084.6 | 265.5 |
| 77 | Panola County | 34,243 | 43.3 | 5,010 | 112 | 14,630.7 | 327.1 |
| 78 | Humphreys County | 8,539 | 42.5 | 1,063 | 33 | 12,448.8 | 386.5 |
| 79 | Lincoln County | 34,432 | 40.2 | 4,400 | 118 | 12,778.8 | 342.7 |
| 80 | Washington County | 47,086 | 37.8 | 5,846 | 141 | 12,415.6 | 299.5 |
| 81 | Tallahatchie County | 14,361 | 34.8 | 1,910 | 45 | 13,299.9 | 313.3 |
| 82 | Tate County | 28,493 | 28.0 | 3,630 | 88 | 12,740.0 | 308.8 |
Essential Tips for Investing: Sponsored
A financial advisor can help you understand the advantages and disadvantages of investment properties. Finding a qualified financial advisor doesn’t have to be hard. SmartAsset’s free tool matches you with up to three financial advisors who serve your area, and you can interview your advisor matches at no cost to decide which one is right for you. If you’re ready to find an advisor who can help you achieve your financial goals, get started now.
Investing in real estate can diversify your portfolio. But expanding your horizons may add additional costs. If you’re an investor looking to minimize expenses, consider checking out online brokerages. They often offer low investment fees, helping you maximize your profit.
Thank you for reading! Have some feedback for us?
Contact the 24/7 Wall St. editorial team.
Editors' Picks


