
Preliminary Report on Computed Tomography Radiomics Features as Biomarkers to Immunotherapy Selection in Lung Adenocarcinoma Patients

 , , and
Abstract
:Simple Summary
Abstract
1. Introduction
2. Materials and Methods
2.1. Patient Selection
2.2. CT Protocol
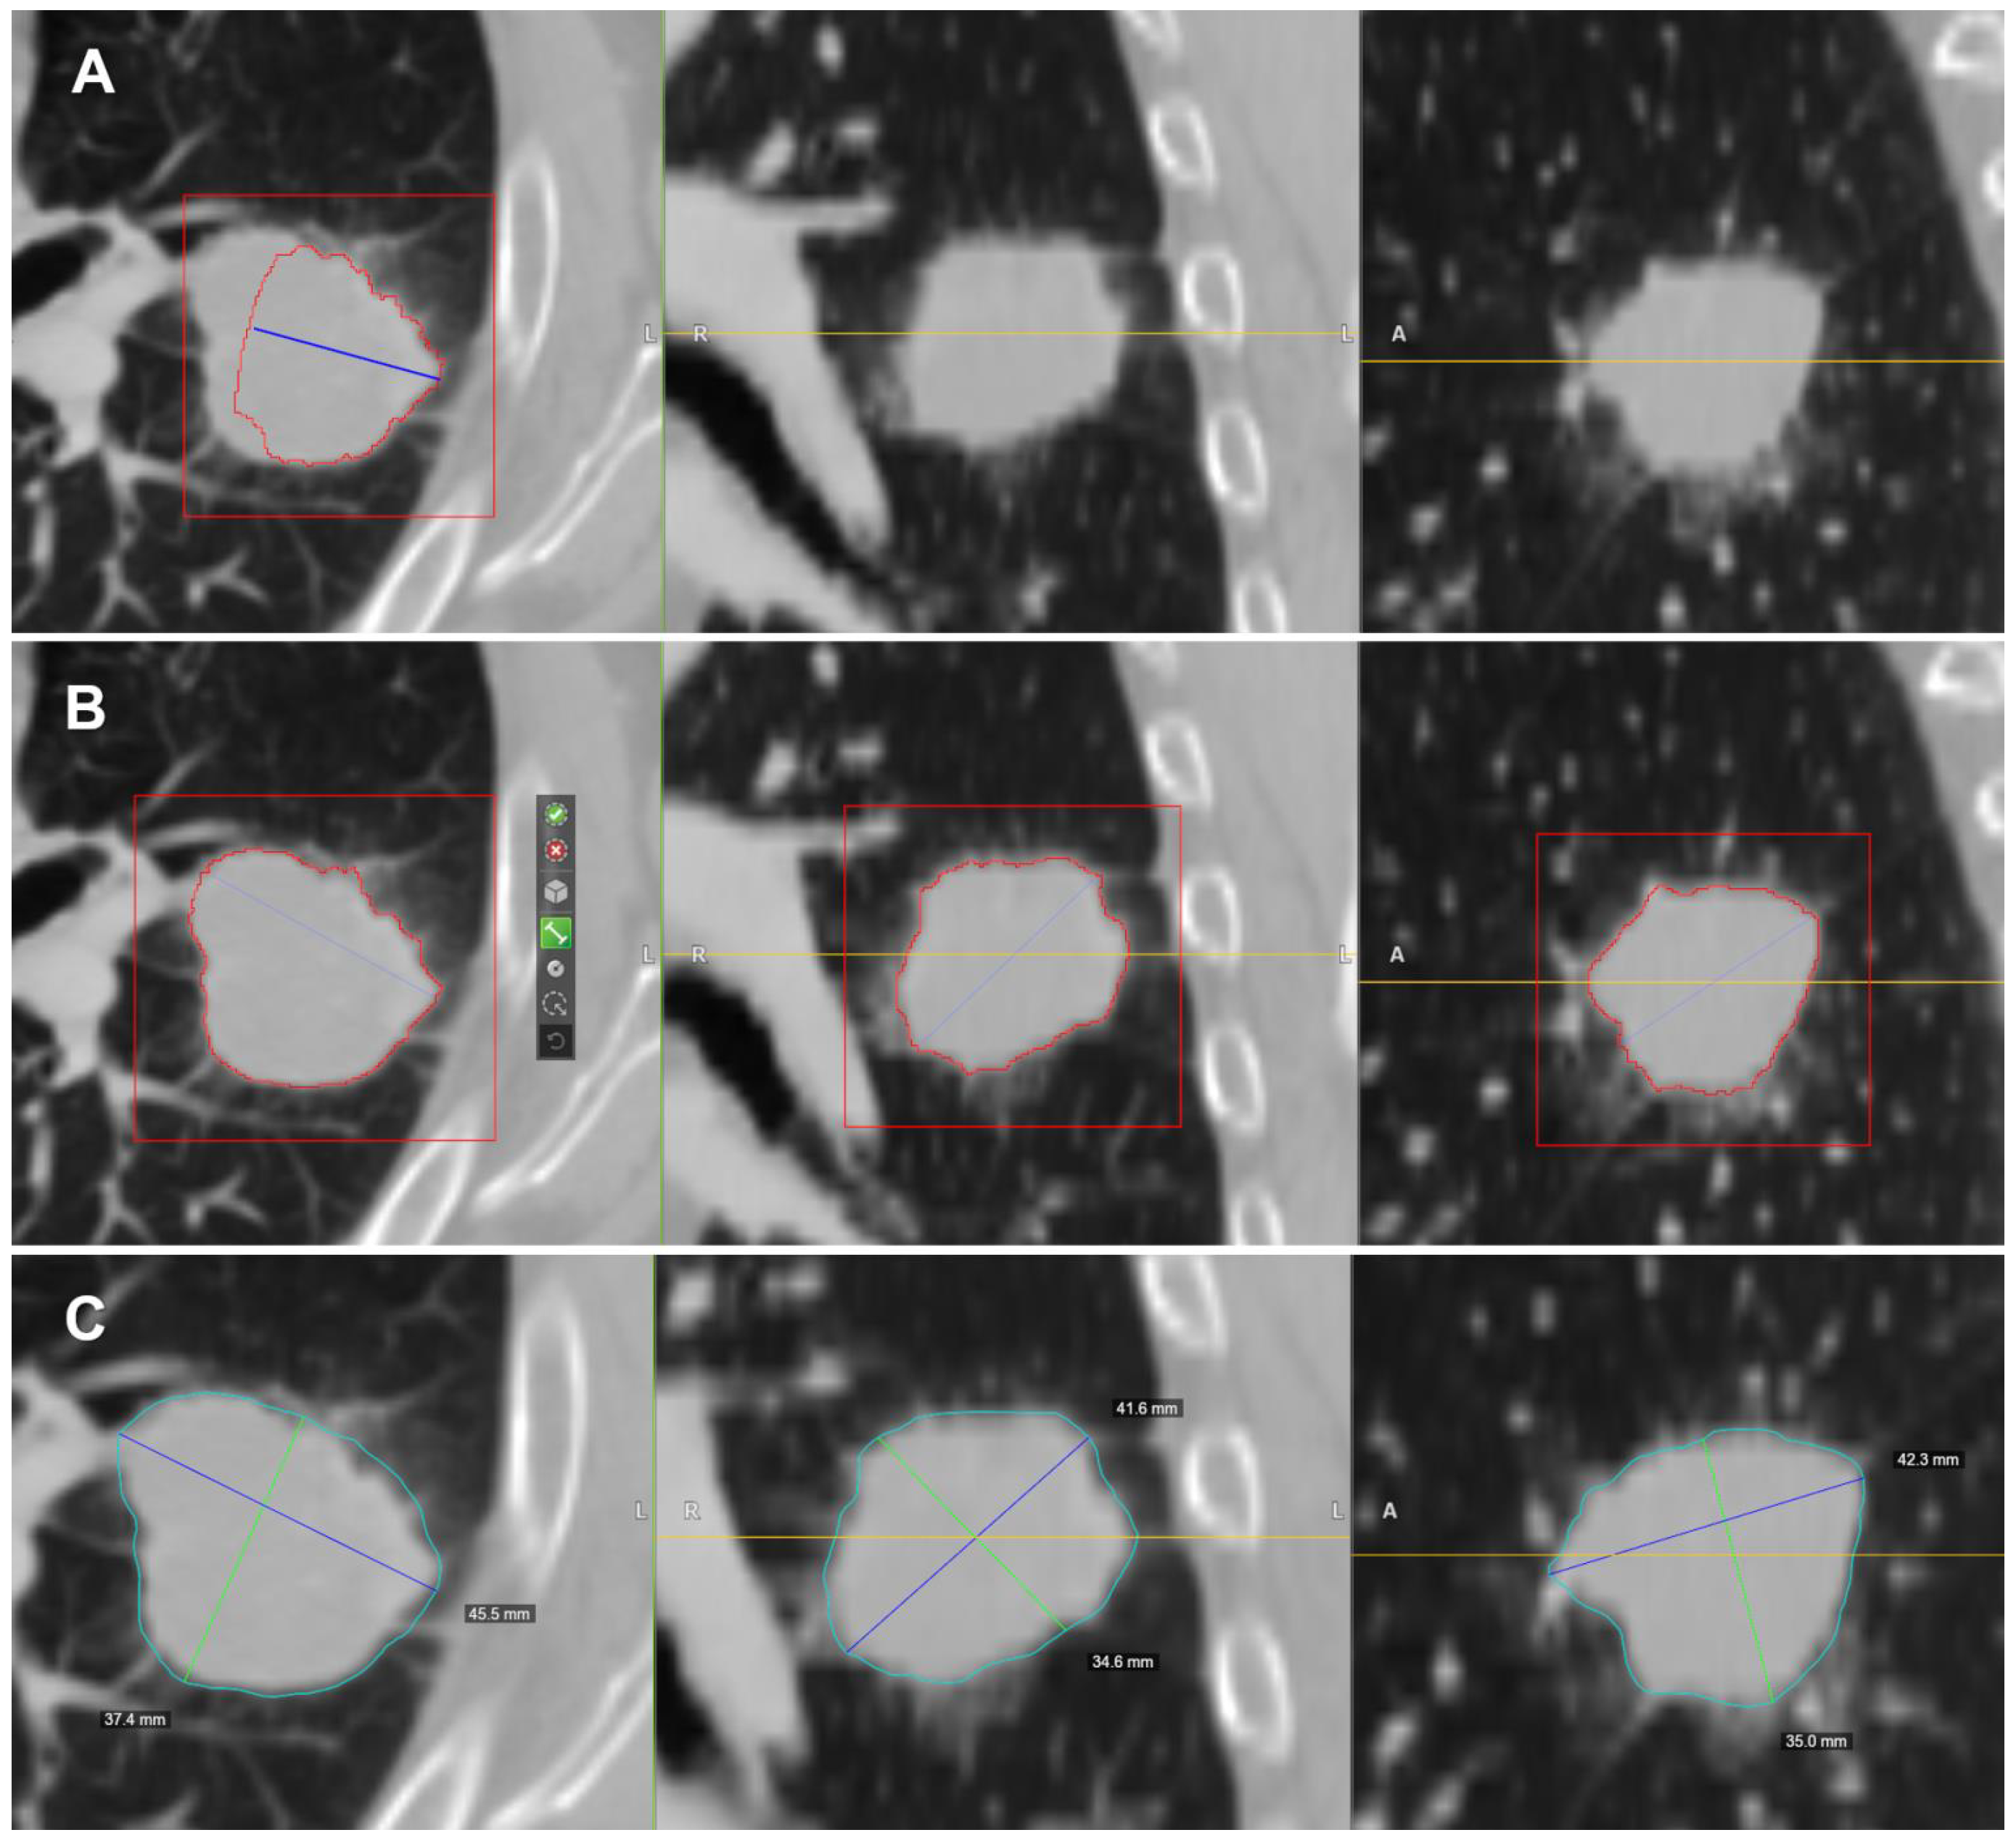
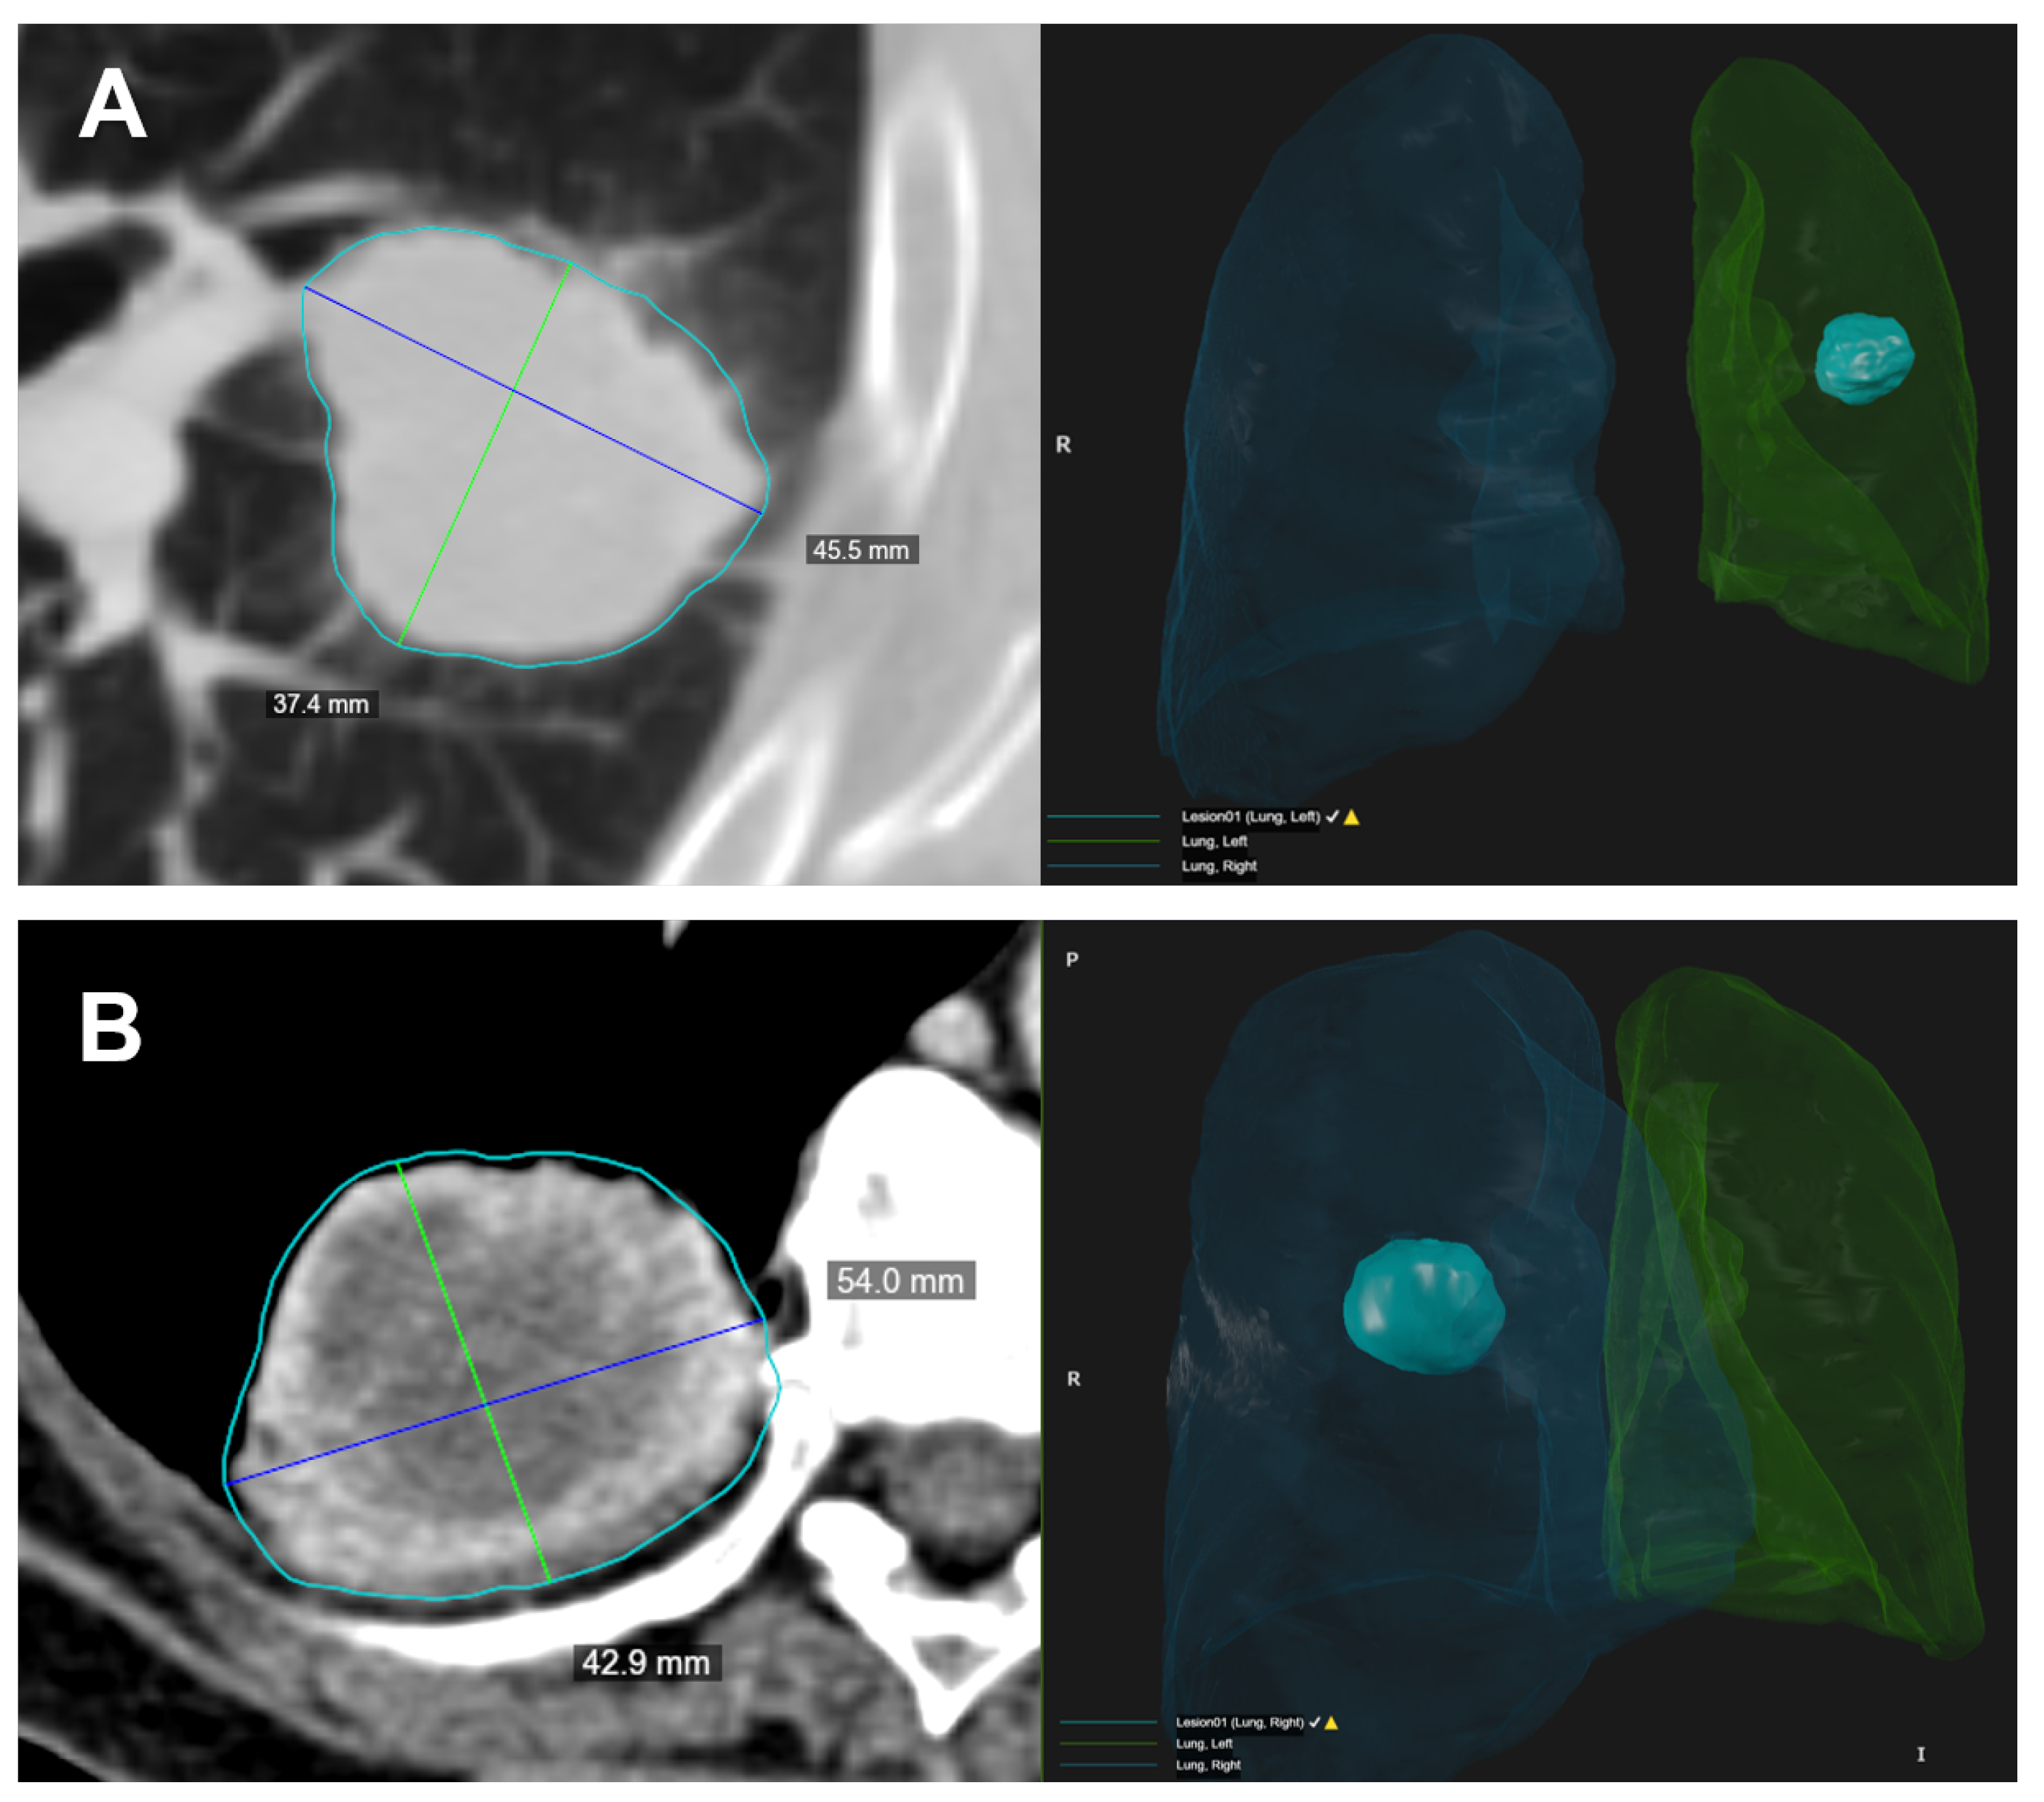
2.3. Radiological Assessment
2.4. CT Post-Processing with Radiomic Precision Metrics (RPM™) Tool
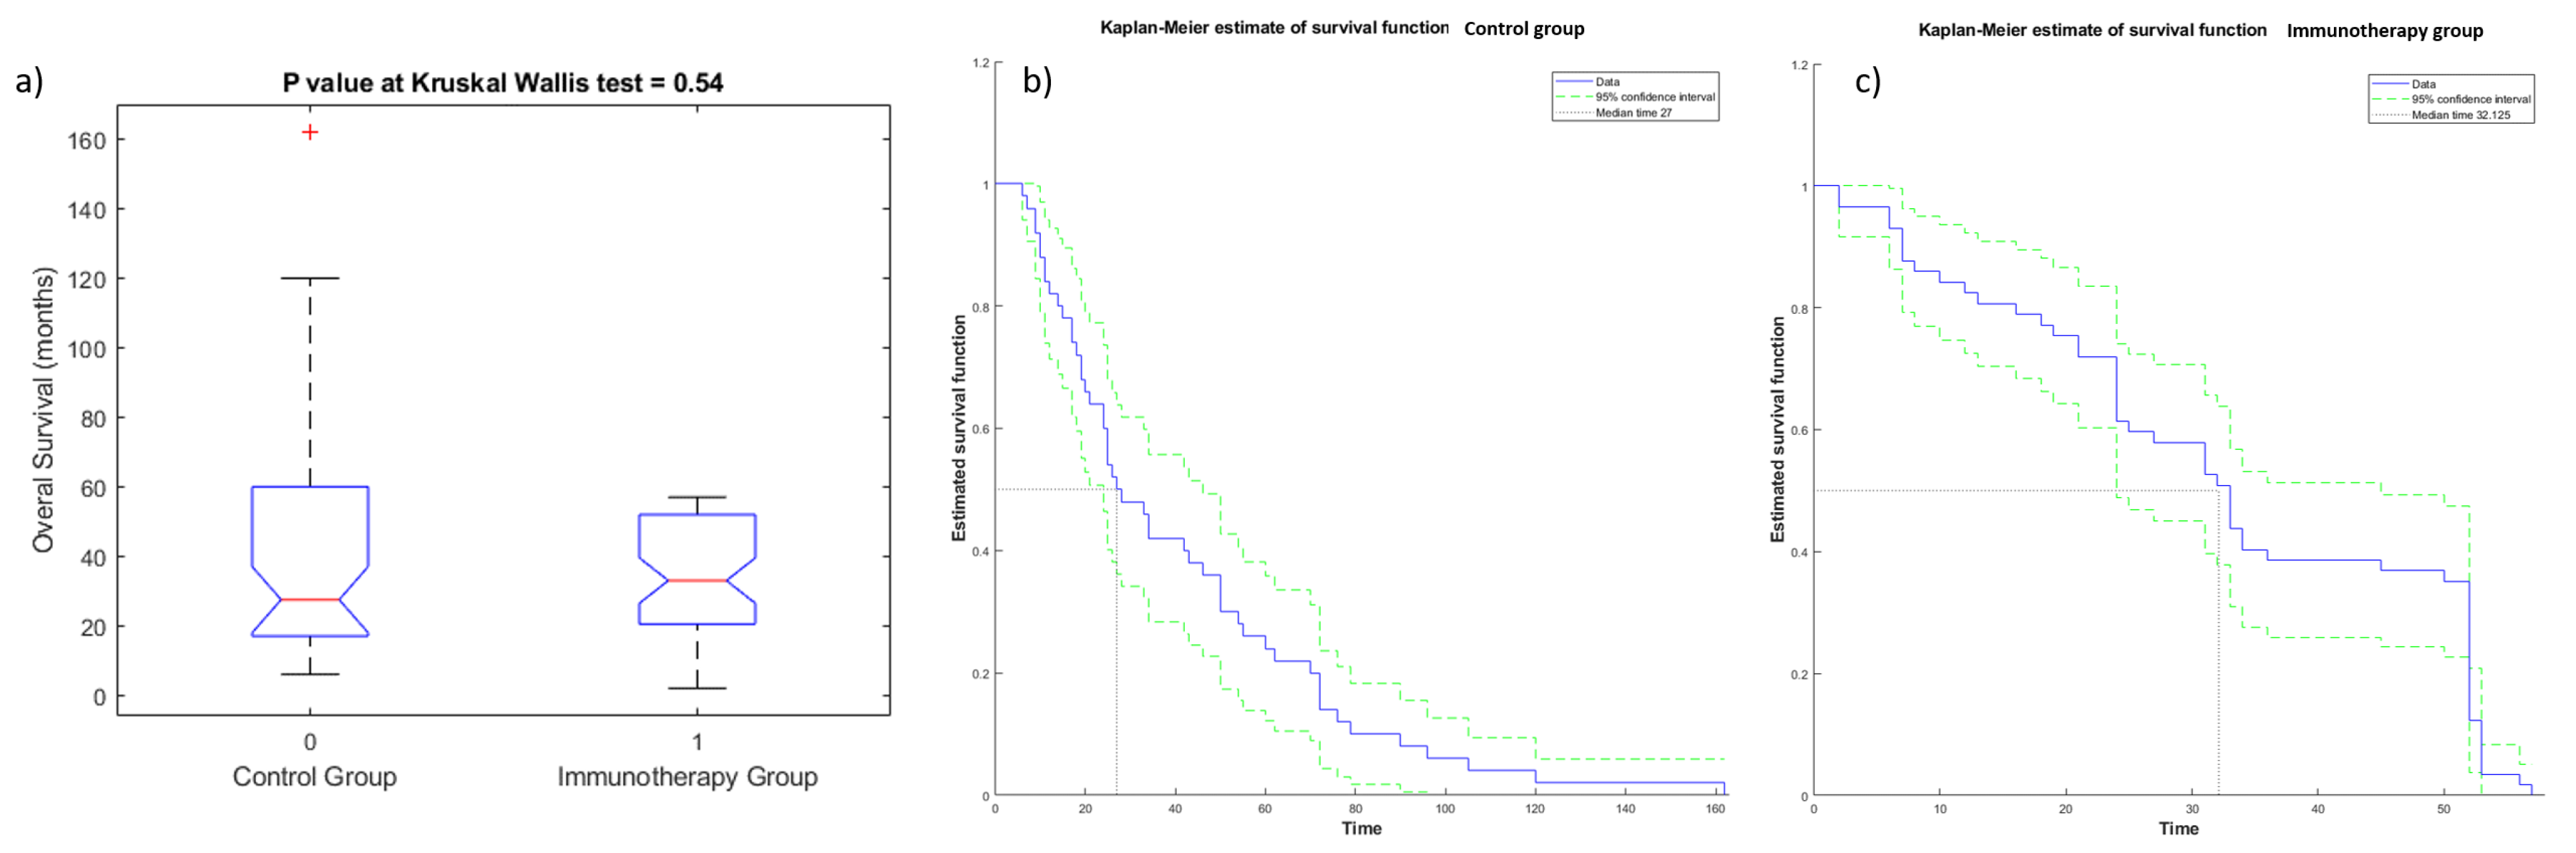
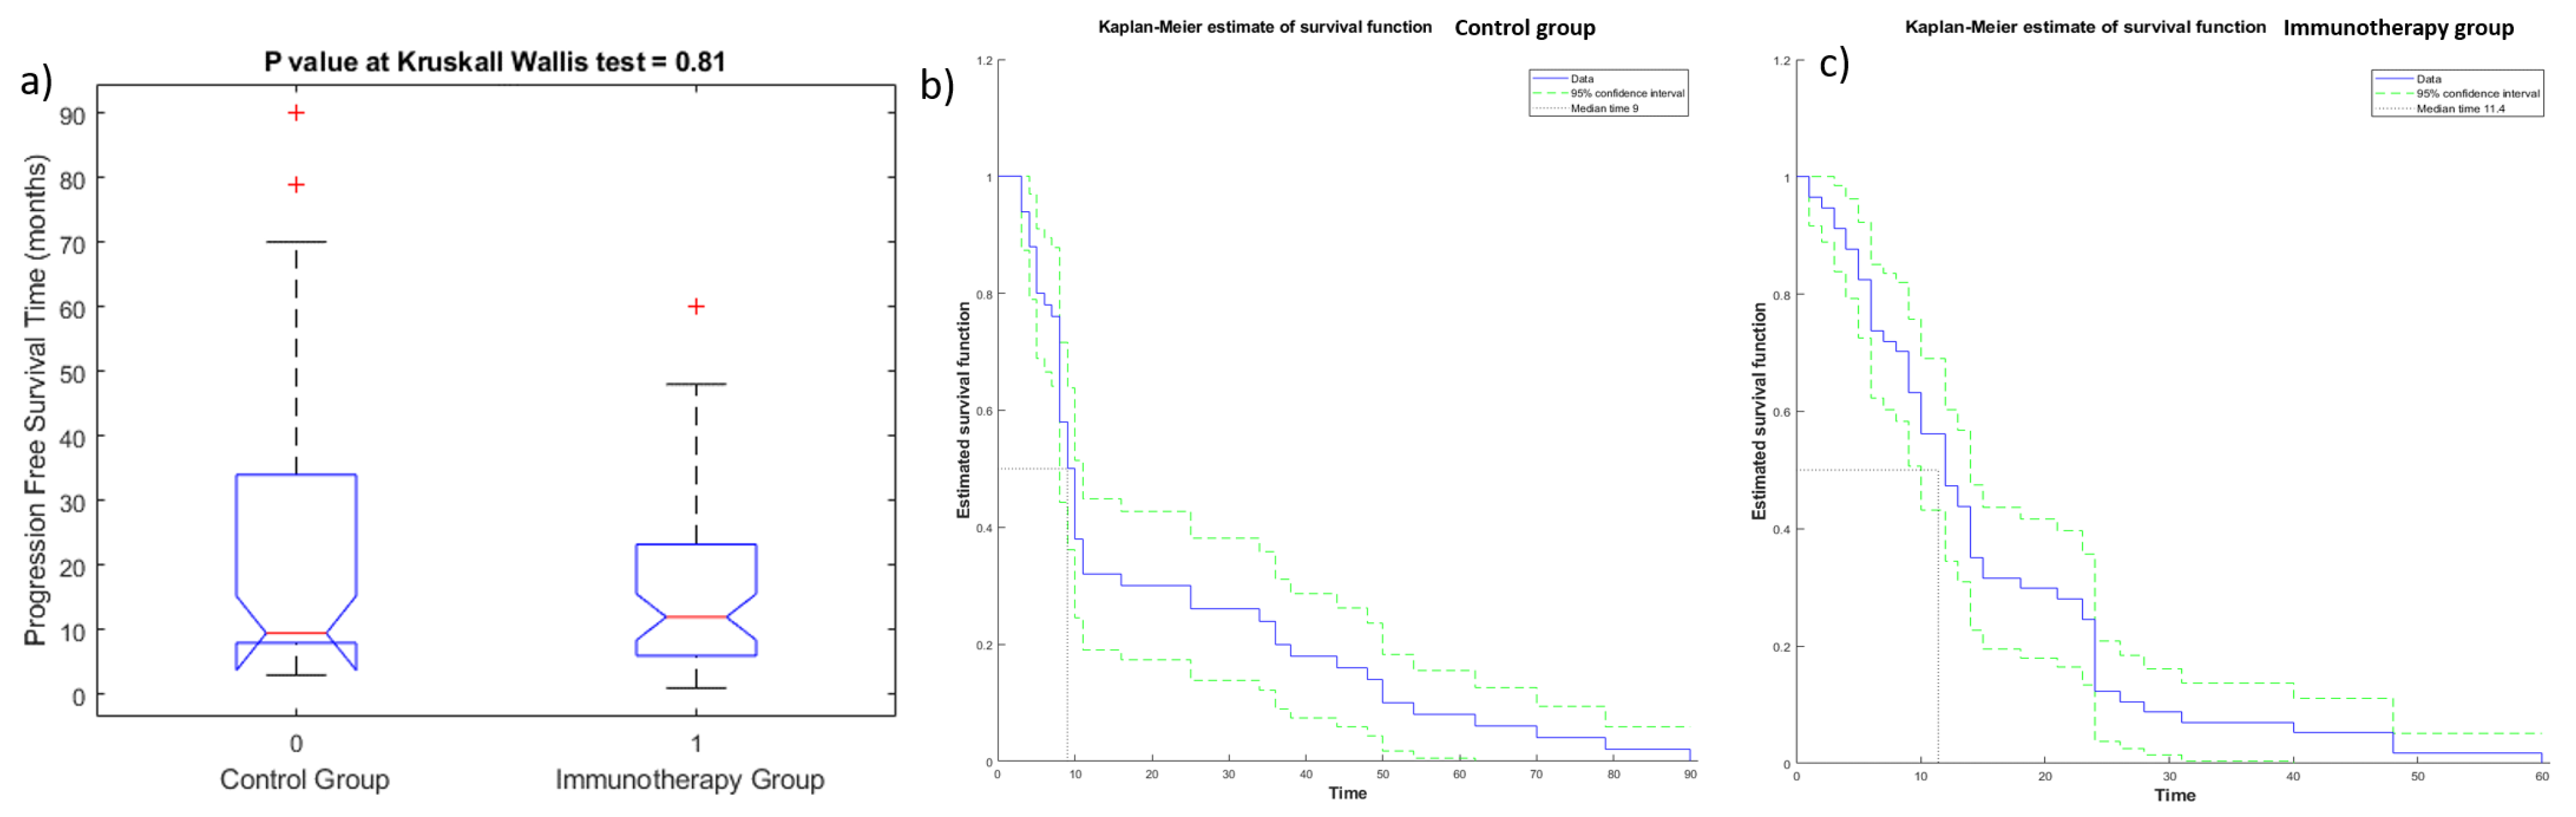
2.5. Statistical Analysis
2.5.1. Univariate Analysis
2.5.2. Multivariate Analysis
3. Results
3.1. Univariate Analysis Results
3.2. Multivariate Analysis Results
4. Discussion
5. Conclusions
Author Contributions
Funding
Institutional Review Board Statement
Informed Consent Statement
Data Availability Statement
Acknowledgments
Conflicts of Interest
Abbreviations
| ACC | accuracy |
| ANN | artificial neural network |
| AUC | area under ROC curve |
| CT | computed tomography |
| CDSS | clinical decision support systems |
| DT | decision tree |
| KNN | k-nearest neighbor |
| GLCM | grey-level co-occurrence matrix |
| GLDZM | grey-level distance zone matrix |
| GLRLM | grey-level run length matrix |
| GLSZM | grey-level size zone matrix |
| LASSO | least absolute shrinkage and selection operator |
| LDA | linear discrimination analysis |
| LOG | Laplacian of Gaussian |
| NSCLC | non-small cell lung cancer |
| NGLDM | neighboring grey-level dependence matrix |
| NGTDM | neighboring grey-tone difference matrix |
| NPV | negative predictive value |
| OS | overall survival |
| PFS | progression-free survival |
| PPV | positive predictive value |
| QIDS | quantitative imaging decision support |
| SENS | sensitivity |
| SPEC | specificity |
| SVM | support vector machine |
| ROC | receiver operating characteristic |
| RPM | rapid precise metrics |
| WHO | World Health Organization |
Appendix A
| Metric Code | Name | Feature Type | Units | IBSI Compliance | Description |
| SOLID_VOLUME_ML | Solid Density Volume | lung CT features | mL | Volume of the solid density of the specified ROI in milliliters. | |
| SOLID_VOLUME_MM3 | Solid Density Volume | mm^3 | Volume of the solid density of the specified ROI in cubic millimeters. | ||
| SOLID_VOLUME_VOXELS | Solid Density Volume | voxels | Volume of the solid density of the specified ROI in voxels. | ||
| PART_SOLID_DIAMETER_MM | Part-Solid Diameter | mm | The average diameter of the solid portions of a part-solid lesion. | ||
| PERCENT_AIR | Percent Air | The estimated percent of volume that is air in this ROI. | |||
| ANTPOST_LENGTH_MM | Anterior-Posterior Length | morphological features | mm | A measure of the anterior-posterior distance. | |
| APPROXIMATE_VOLUME_ML | Approximate Volume | mL | Approximate volume of the specified ROI of the image in milliliters. For studies with gantry tilt, PARALLELEPIPED_VOLUME_MM3 is recommended. | ||
| APPROXIMATE_VOLUME_MM3 | Approximate Volume | mm^3 | Approximate volume of the specified ROI of the image in cubic millimeters assuming water equivalent. For studies with gantry tilt, PARALLELEPIPED_VOLUME_MM3 is recommended. | ||
| AVG_AXIAL_DIAMETER_MM | Average Axial Diameter | mm | The average of largest axial planar and orthogonal diameters, in millimeters | ||
| AVG_CORONAL_DIAMETER_MM | Average Coronal Diameter | mm | The average of largest coronal planar and orthogonal diameters, in millimeters | ||
| AVG_SAGITTAL_DIAMETER_MM | Average Sagittal Diameter | mm | The average of largest sagittal planar and orthogonal diameters, in millimeters | ||
| COMPACTNESS1_MM | Mesh Compactness 1 | mm^5/3 | 1 | IBSI-consistent dimensionful measure of compactness of ROI, independent of scale and orientation (first of three implementations), using standard unit shape-derived information. | |
| CORONAL_LONG_AXIS_MM | Coronal Long Axis | mm | A measure of the longest straight line that can fit entirely inside an XZ-planar slice of the 3D structure (from edge to edge, without ever leaving structure), in millimeters. | ||
| CRANIALCAUDAL_LENGTH_MM | Cranial-Caudal Length | mm | A measure of the cranial-caudal distance. | ||
| VOLUME_DENSITY_AEE | Volume Density-Approximate Enclosing Ellipsoid | 1 | IBSI-consistent volume fraction of the approximate enclosing ellipsoid occupied by the ROI | ||
| VOLUME_ML | Volume | mL | IBSI-consistent volume of the specified ROI of the image in milliliters. | ||
| VOLUME_MM3 | Volume | mm^3 | IBSI-consistent volume of the specified ROI of the image in cubic millimeters. | ||
| VOLUME_VOXELS | Volume | voxels | IBSI-consistent approximate volume derived from voxel count inside ROI | ||
| VOLUMETRIC_LENGTH_MM | Volumetric Length | mm | A measure of the longest straight line that can fit entirely inside the 3D structure (from edge to edge, without ever leaving structure). | ||
| GREATEST_PLANAR_AXIS | Greatest Planar Axis Length | mm | |||
| GREATEST_PLANAR_LENGTH | Greatest Planar Long Axis Length | mm | Greatest length among the sagittal longest axis, axial longest axis, and coronal longest axis lengths. | ||
| L1_DISTANCE_MM | Long (L1) Full Axis Length | mm | IBSI-consistent length of the long (L1) full principal axis, in millimeters, from edge to edge of the ROI. | ||
| L2_DISTANCE_MM | Short (L2) Full Axis Length | mm | IBSI-consistent length of the short (L2) full principal axis, in millimeters, from edge to edge of the ROI. | ||
| L3_DISTANCE_MM | Normal (L3) Full Axis Length | mm | IBSI-consistent length of the normal (L3) full principal axis, in millimeters, from edge to edge of the ROI. | ||
| LARGEST_PLANAR_DIAMETER_MM | Axial Long Axis | mm | A measure of the longest straight line that can fit entirely inside an XY-planar slice of the 3D structure (from edge to edge, without ever leaving structure), in millimeters. | ||
| LARGEST_PLANAR_ORTHO_DIAMETER_MM | Axial Short Axis | mm | A measure of the longest orthogonal line to the longest planar line, that can fit entirely inside an XY-planar slice of the 3D structure (from edge to edge, without ever leaving structure), in millimeters | ||
| SAGITTAL_LONG_AXIS_MM | Sagittal Long Axis | mm | A measure of the longest straight line that can fit entirely inside an YZ-planar slice of the 3D structure (from edge to edge, without ever leaving structure), in millimeters. | ||
| SAGITTAL_SHORT_AXIS_MM | Sagittal Short Axis | mm | A measure of the longest orthogonal line to the longest planar line, that can fit entirely inside an YZ-planar slice of the 3D structure (from edge to edge, without ever leaving structure), in millimeters | ||
| SHIFT_CENTER_OF_MASS_MM | Center of Mass Shift | mm | 1 | IBSI-consistent shift in the center of mass due to image intensity. | |
| SURFACE_AREA_MM2 | Surface Area | mm^2 | 1 | IBSI-consistent surface area of the specified ROI of the image in square millimeters. | |
| TRANSVERSE_LENGTH_MM | Transverse Length | mm | A measure of the transverse distance. | ||
| INTENSITY_HISTOGRAM_ENERGY_HU | Intensity Histogram Energy | Intensity-based feature | 1 | IBSI-consistent intensity histogram energy of all voxels in ROI binned for PET. | |
| GLCM_ASM | GLCM Avg Angular Second Moment | textural features | Average angular second moments of GLCM in all 26 directions. Raw HU used, unbinned and with background padding 1 voxel around the ROI. | ||
| GLCM_CORRELATION | GLCM Avg Correlation | Average correlations of GLCM in all 26 directions. Raw HU used, unbinned and with background padding 1 voxel around the ROI. | |||
| GLCM_CORRELATION_GL | GLCM Avg Correlation for Grey Leveled Image | Average correlations of GLCM in all 26 directions for grey leveled CT or PET image with background padding 1 voxel around the ROI. | |||
| GLCM_ENERGY | GLCM Avg Energy | Average energies of GLCM in all 26 directions. Raw HU used, unbinned and with background padding 1 voxel around the ROI. | |||
| GLCM_ENTROPY | GLCM Avg Entropy | Average entropies of GLCM in all 26 directions. Raw HU used, unbinned and with background padding 1 voxel around the ROI. | |||
| GLCM_IBSI_CLUSTERPROMINENCE_2DF_HU | GLCM Cluster Prominence for Grey Leveled Image from IBSI by Slice without Merging | 1 | IBSI-consistent cluster prominence of GLCM of unpadded ROI binned for CT with aggregation by slice without merging. | ||
| GLCM_IBSI_CLUSTERPROMINENCE_2DS_HU | GLCM Cluster Prominence for Grey Leveled Image from IBSI by Slice with Merging by Slice | 1 | IBSI-consistent cluster prominence of GLCM of unpadded ROI binned for CT with aggregation by slice with merging by slice. | ||
| GLCM_IBSI_CLUSTERPROMINENCE_2DV_HU | GLCM Cluster Prominence for Grey Leveled Image from IBSI by Slice with Merging | 1 | IBSI-consistent cluster prominence of GLCM of unpadded ROI binned for CT with aggregation by slice with merging. | ||
| GLCM_IBSI_CLUSTERPROMINENCE_3DF_HU | GLCM Cluster Prominence for Grey Leveled Image from IBSI by Volume without Merging | 1 | IBSI-consistent cluster prominence of GLCM of unpadded ROI binned for CT with aggregation by volume without merging. binning | ||
| GLCM_IBSI_CLUSTERPROMINENCE_3DV_HU | GLCM Cluster Prominence for Grey Leveled Image from IBSI by Volume with Full Merging | 1 | IBSI-consistent cluster prominence of GLCM of unpadded ROI binned for CT with aggregation by volume with full merging. binning | ||
| GLCM_IBSI_CORRELLATION_2DF_HU | GLCM Correlation for the Grey Leveled Image from the IBSI by Slice without Merging | 1 | IBSI-consistent correlation of GLCM ROI binned for CT with aggregation by slice without merging. | ||
| GLCM_IBSI_CORRELLATION_2DS_HU | GLCM Correlation for the Grey Leveled Image from the IBSI by Slice with Merging by Slice | 1 | IBSI-consistent correlation of GLCM ROI binned for CT with aggregation by slice with merging by slice. | ||
| GLCM_IBSI_CORRELLATION_2DV_HU | GLCM Correlation for the Grey Leveled Image from the IBSI by Slice with Merging | 1 | IBSI-consistent correlation of GLCM ROI binned for CT with aggregation by slice with merging. | ||
| GLCM_IBSI_CORRELLATION_3DF_HU | GLCM Correlation for the Grey Leveled Image from the IBSI by Volume without Merging | 1 | IBSI-consistent correlation of GLCM ROI binned for CT with aggregation by volume without merging. | ||
| GLCM_IBSI_CORRELLATION_3DV_HU | GLCM Correlation for the Grey Leveled Image from the IBSI by Volume with Full Merging | 1 | IBSI-consistent correlation of GLCM ROI binned for CT with aggregation by volume with full merging. | ||
| GLCM_IBSI_FMIC_3DV_HU | GLCM First Measure of InformationCorrelation for Grey Leveled Image from IBSI by Volume with Full Merging | 1 | IBSI-consistent first measure of information correlation of GLCM of unpadded ROI binned for CT with aggregation by volume with full merging. | ||
| GLCM_IBSI_SMIC_3DV_HU | GLCM Second Measure of Information Correlation for Grey Leveled Image from IBSI by Slice with Full Merging | 1 | IBSI-consistent second measure of inform of unpadded ROI binned for CT with aggregation by slice with full merging. | ||
| GLDZM_IBSI_GL_NONUNIFORMITY_2DV_HU | GLDZM Grey Level Nonuniformity with Merging by Slice from CT | 1 | IBSI-consistent grey level nonuniformity of GLDZM of unpadded ROI binned for CT from 8 directions in 2 dimensions with merging. | ||
| GLDZM_IBSI_GL_NONUNIFORMITY_3D_HU | GLDZM Grey Level Nonuniformity from CT | 1 | IBSI-consistent grey level nonuniformity of GLDZM of unpadded ROI binned for CT from 26 directions in 3 dimensions. | ||
| GLDZM_IBSI_GL_VARIANCE_2DS_HU | GLDZM Grey Level Variance from CT without Merging | 1 | IBSI-consistent grey level variance of GLDZM of unpadded ROI binned for CT from 8 directions in 2 dimensions. | ||
| GLDZM_IBSI_GL_VARIANCE_2DV_HU | GLDZM Grey Level Variance with Merging by Slice from CT | 1 | IBSI-consistent grey level variance of GLDZM of unpadded ROI binned for CT from 8 directions in 2 dimensions with merging. | ||
| GLDZM_IBSI_GL_VARIANCE_3D_HU | GLDZM Grey Level Variance from CT | 1 | IBSI-consistent grey level variance of GLDZM of unpadded ROI binned for CT from 26 directions in 3 dimensions. | ||
| GLDZM_IBSI_LARGE_DIST_EMPH_3D_HU | GLDZM Large Distance Emphasis with Full Merging from CT | 1 | IBSI-consistent large distance emphasis of GLDZM of unpadded ROI binned for CT from 26 directions in 3 dimensions. | ||
| GLDZM_IBSI_SMALL_DIST_EMPH_2DS_HU | GLDZM Small Distance Emphasis without Merging from CT | 1 | IBSI-consistent small distance emphasis of GLDZM of unpadded ROI binned for CT from 8 directions in 2 dimensions. | ||
| GLDZM_IBSI_SMALL_DIST_EMPH_2DV_HU | GLDZM Small Distance Emphasis with Merging by Slice from CT | 1 | IBSI-consistent small distance emphasis of GLDZM of unpadded ROI binned for CT from 8 directions in 2 dimensions with merging. | ||
| GLDZM_IBSI_SMALL_DIST_EMPH_3D_HU | GLDZM Small Distance Emphasis with Full Merging from CT | 1 | IBSI-consistent small distance emphasis of GLDZM of unpadded ROI binned for CT from 26 directions in 3 dimensions. | ||
| GLDZM_IBSI_SMALL_DIST_LOW_GL_EMPH_3D_HU | GLDZM Small Distance Low Grey Level Emphasis with Full Merging from CT | 1 | IBSI-consistent small distance low grey level emphasis of GLDZM of unpadded ROI binned for CT from 26 directions in 3 dimensions. | ||
| GLDZM_IBSI_ZONE_DISTANCE_ENTROPY_2DS_HU | GLDZM Zone Distance Entropy without Merging from CT | 1 | IBSI-consistent grey level nonuniformity of GLDZM of unpadded ROI binned for CT from 8 directions in 2 dimensions. | ||
| GLDZM_IBSI_ZONE_DISTANCE_ENTROPY_2DV_HU | GLDZM Zone Distance Entropy with Mergning by Slice from CT | 1 | IBSI-consistent grey level nonuniformity of GLDZM of unpadded ROI binned for CT from 8 directions in 2 dimensions with merging. | ||
| GLDZM_IBSI_ZONE_DISTANCE_ENTROPY_3D_HU | GLDZM Zone Distance Entropy from CT | 1 | IBSI-consistent grey level nonuniformity of GLDZM of unpadded ROI binned for CT from 26 directions in 3 dimensions. | ||
| GLDZM_IBSI_ZONE_DISTANCE_NONUNIFORMITY_2DS_HU | GLDZM Zone Distance Nonuniformity without Merging from CT | 1 | IBSI-consistent grey level nonuniformity of GLDZM of unpadded ROI binned for CT from 8 directions in 2 dimensions. | ||
| GLDZM_IBSI_ZONE_DISTANCE_NONUNIFORMITY_2DV_HU | GLDZM Zone Distance Nonuniformity with Merging by Slice from CT | 1 | IBSI-consistent grey level nonuniformity of GLDZM of unpadded ROI binned for CT from 8 directions in 2 dimensions with merging. | ||
| GLDZM_IBSI_ZONE_DISTANCE_NONUNIFORMITY_3D_HU | GLDZM Zone Distance Nonuniformity from CT | 1 | IBSI-consistent grey level nonuniformity of GLDZM of unpadded ROI binned for CT from 26 directions in 3 dimensions. | ||
| GLDZM_IBSI_ZONE_DISTANCE_NONUNIFORMITY_NORMALIZED_2DS_HU | GLDZM Zone Distance Nonuniformity Normalised without Merging from CT | 1 | IBSI-consistent grey level normalized nonuniformity of GLDZM of unpadded ROI binned for CT from 8 directions in 2 dimensions. | ||
| GLDZM_IBSI_ZONE_DISTANCE_NONUNIFORMITY_NORMALIZED_2DV_HU | GLDZM Zone Distance Nonuniformity Normalised with Mergning by Slice from CT | 1 | IBSI-consistent grey level normalized nonuniformity of GLDZM of unpadded ROI binned for CT from 8 directions in 2 with merging dimensions. | ||
| GLDZM_IBSI_ZONE_DISTANCE_NONUNIFORMITY_NORMALIZED_3D_HU | GLDZM Zone Distance Nonuniformity Normalised from CT | 1 | IBSI-consistent grey level normalized nonuniformity of GLDZM of unpadded ROI binned for CT from 26 directions in 3 dimensions. | ||
| GLDZM_IBSI_ZONE_DISTANCE_VARIANCE_2DS_HU | GLDZM Zone Distance Variance without Merging from CT | 1 | IBSI-consistent grey level variance of GLDZM of unpadded ROI binned for CT from 8 directions in 2 dimensions. | ||
| GLDZM_IBSI_ZONE_DISTANCE_VARIANCE_3D_HU | GLDZM Zone Distance Variance from CT | 1 | IBSI-consistent grey level variance of GLDZM of unpadded ROI binned for CT from 26 directions in 3 dimensions. | ||
| GLRLM_IBSI_GLNONUNIFORMITY_2DV_HU | GLRLM Grey Level Nonuniformity by Slice with Full Merging from CT | 1 | IBSI-consistent grey levelnonuniformity from GLRLM of unpadded ROI binned for CT from merging in 8 directions for each slice. | ||
| GLRLM_IBSI_GLNONUNIFORMITY_3DF_HU | GLRLM Grey Level Nonuniformityas Volume, without Merging from CT | 1 | IBSI-consistent grey levelnonuniformity from GLRLM of unpadded ROI binned for CT from averaging 26 directions in 3 dimensions. | ||
| GLRLM_IBSI_GLNONUNIFORMITY_3DV_HU | GLRLM Grey Level Nonuniformity as Volume, with Full Merging from CT | 1 | IBSI-consistent grey levelnonuniformity from GLRLM of unpadded ROI binned for CT from merging 26 directions in 3 dimensions. | ||
| GLRLM_IBSI_RUNLENGTHNONUNIFORMITY_2DF_HU | GLRLM Run Length Nonuniformity by Slice without Merging from CT | 1 | IBSI-consistent run length nonuniformity from GLRLM of unpadded ROI binned for CT from averaging in 8 directions for each slice. | ||
| GLRLM_IBSI_RUNLENGTHNONUNIFORMITY_2DS_HU | GLRLM Run Length Nonuniformity by Slice with Merging by Slice from CT | 1 | IBSI-consistent run length nonuniformity from GLRLM of unpadded ROI binned for CT from merging matrices from each slice and averaging the result. | ||
| GLRLM_IBSI_RUNLENGTHNONUNIFORMITY_2DV_HU | GLRLM Run Length Nonuniformity by Slice with Full Merging from CT | 1 | IBSI-consistent run length nonuniformity from GLRLM of unpadded ROI binned for CT from merging in 8 directions for each slice. | ||
| GLRLM_IBSI_RUNLENGTHNONUNIFORMITY_3DF_HU | GLRLM Run Length Nonuniformity as Volume, without Merging from CT | 1 | IBSI-consistent run length nonuniformity from GLRLM of unpadded ROI binned for CT from averaging 26 directions in 3 dimensions. | ||
| GLRLM_IBSI_RUNLENGTHNONUNIFORMITY_3DV_HU | GLRLM Run Length Nonuniformity as Volume, with Full Merging from CT | 1 | IBSI-consistent run length nonuniformity from GLRLM of unpadded ROI binned for CT from merging 26 directions in 3 dimensions. | ||
| GLSZM_IBSI_GL_NONUNIF_2DV_HU | GLSZM Grey Level Nonuniformity by Slice, with Full Merging | 1 | IBSI-consistent grey level nonuniformity of GLSZM of unpadded ROI binned for CT with aggregation by 2D volume. | ||
| GLSZM_IBSI_GL_NONUNIF_3D_HU | GLSZM Grey Level Nonuniformity as Volume, with Full Merging | 1 | IBSI-consistent grey level nonuniformity of GLSZM of unpadded ROI binned for CT with aggregation by 3D volume. | ||
| GLSZM_IBSI_GL_VARIANCE_2DS_HU | GLSZM Grey Level Variance by Slice, with Merging by Slice | 1 | IBSI-consistent grey level variance of GLSZM of unpadded ROI binned for CT with aggregation by slice. | ||
| GLSZM_IBSI_GL_VARIANCE_2DV_HU | GLSZM Grey Level Variance by Slice, with Full Merging | 1 | IBSI-consistent grey level variance of GLSZM of unpadded ROI binned for CT with aggregation by 2D volume. | ||
| GLSZM_IBSI_GL_VARIANCE_3D_HU | GLSZM Grey Level Variance as Volume, with Full Merging | 1 | IBSI-consistent grey level variance of GLSZM of unpadded ROI binned for CT with aggregation by 3D volume. | ||
| GLSZM_IBSI_SMALL_ZONE_EMPH_3D_HU | GLSZM Small Zone Emphasis as Volume, with Full Merging | 1 | IBSI-consistent small zone emphasis of GLSZM of unpadded ROI binned for CT with aggregation by 3D volume. | ||
| GLSZM_IBSI_SMALL_ZONE_LOW_GL_EMPH_3D_HU | GLSZM Small Zone Low Grey Level Emphasis as Volume, with Full Merging | 1 | IBSI-consistent small zone low grey level emphasis of GLSZM of unpadded ROI binned for CT with aggregation by 3D volume. | ||
| GLSZM_IBSI_ZS_ENTROPY_2DS_HU | GLSZM Zone Size Entropy by Slice, with Merging by Slice | 1 | IBSI-consistent zone size entropy from GLSZM of unpadded ROI binned for CT with aggregation by slice. | ||
| GLSZM_IBSI_ZS_ENTROPY_2DV_HU | GLSZM Zone Size Entropy by Slice, with Full Merging | 1 | IBSI-consistent zone size entropy from GLSZM of unpadded ROI binned for CT with aggregation by 2D volume. | ||
| GLSZM_IBSI_ZS_ENTROPY_3D_HU | GLSZM Zone Size Entropy as Volume, with Full Merging | 1 | IBSI-consistent zone size entropy from GLSZM of unpadded ROI binned for CT with aggregation by 3D volume. | ||
| GLSZM_IBSI_ZS_NONUNIF_2DS_HU | GLSZM Zone Size Nonuniformity by Slice, with Merging by Slice | 1 | IBSI-consistent zone size uniformity from GLSZM of unpadded ROI binned for CT with aggregation by slice. | ||
| GLSZM_IBSI_ZS_NONUNIF_2DV_HU | GLSZM Zone Size Nonuniformity by Slice, with Full Merging | 1 | IBSI-consistent zone size uniformity from GLSZM of unpadded ROI binned for CT with aggregation by 2D volume. | ||
| GLSZM_IBSI_ZS_NONUNIF_3D_HU | GLSZM Zone Size Nonuniformity as Volume, with Full Merging | 1 | IBSI-consistent zone size uniformity from GLSZM of unpadded ROI binned for CT with aggregation by 3D volume. | ||
| GLSZM_IBSI_ZS_NONUNIF_NORMALISED_3D_HU | GLSZM Normalised Zone Size Nonuniformity as Volume, with Full Merging | 1 | IBSI-consistent normalizedzone size nonuniformity of GLSZM of unpadded ROI binned for CT with aggregation by 3D volume. | ||
| NGLDM_IBSI_DEP_ENTROPY_2DF_HU | NGLDM Dependence Entropy by Slice, without Merging | 1 | IBSI-consistent dependence entropy of NGLDM of unpadded ROI binned for CT with aggregation by slice without merging. | ||
| NGLDM_IBSI_DEP_ENTROPY_3D_HU | NGLDM Dependence Entropy as Volume, with Full Merging | 1 | IBSI-consistent dependence entropy of NGLDM of unpadded ROI binned for CT with aggregation by volume with full merging. | ||
| NGLDM_IBSI_DEP_NONUNIF_2DF_HU | NGLDM Dependence Nonuniformity by Slice, without Merging | 1 | IBSI-consistent dependence nonuniformity of NGLDM of unpadded ROI binned for CT with aggregation by slice without merging. | ||
| NGLDM_IBSI_DEP_NONUNIF_2DV_HU | NGLDM Dependence Nonuniformity by Slice, with Merging by Slice | 1 | IBSI-consistent dependence nonuniformity of NGLDM of unpadded ROI binned for CT with aggregation by slice with merging. | ||
| NGLDM_IBSI_DEP_NONUNIF_3D_HU | NGLDM Dependence Nonuniformity as Volume, with Full Merging | 1 | IBSI-consistent dependence nonuniformity of NGLDM of unpadded ROI binned for CT with aggregation by volume with full merging. | ||
| NGLDM_IBSI_DEP_VARIANCE_2DF_HU | NGLDM Dependence Variance by Slice, without Merging | 1 | IBSI-consistent dependence entropy of NGLDM of unpadded ROI binned for CT with aggregation by slice without merging. | ||
| NGLDM_IBSI_GLNONUNIF_2DV_HU | NGLDM GL Nonuniformity by Slice, with Merging by Slice | 1 | IBSI-consistent grey level nonuniformity of NGLDM of unpadded ROI binned for CT with aggregation by slice with merging. | ||
| NGLDM_IBSI_GLNONUNIF_3D_HU | NGLDM GL Nonuniformity as Volume, with Full Merging | 1 | IBSI-consistent grey level nonuniformity of NGLDM of unpadded ROI binned for CT with aggregation by volume with full merging. | ||
| NGLDM_IBSI_HIGH_DEP_LOW_GL_EMPH_3D_HU | NGLDM High Dependence Low GL Emphasis as Volume, with Full Merging | 1 | IBSI-consistent high dependence low grey level of NGLDM of unpadded ROI binned for CT with aggregation by volume with full merging. | ||
| NGTDM_BUSYNESS_2DV_HU | NGTDM Busyness by Slice with Full Merging | 1 | IBSI-consistent busyness of NGTDM of unpadded ROI with aggregation by merging 8 matrices for each slice | ||
| NGTDM_BUSYNESS_3D_HU | NGTDM Busyness as Volume, with Full Merging | 1 | IBSI-consistent busyness of NGTDM of unpadded ROI with aggregation by merging matrices from all 26 directions | ||
| NGTDM_COARSENESS_2DV_HU | NGTDM Coarseness, by Slice with Full Merging | 1 | IBSI-consistent coarseness of NGTDM of unpadded ROI with aggregation by merging 8 matrices for each slice | ||
| NGTDM_COARSENESS_3D_HU | NGTDM Coarseness, as Volume, with Full Merging | 1 | IBSI-consistent coarseness of NGTDM of unpadded ROI with aggregation by merging matrices from all 26 directions | ||
| NGTDM_COMPLEXITY_2DF_HU | NGTDM Complexity by Slice without Merging | 1 | IBSI-consistent complexity of NGTDM of unpadded ROI with aggregation by averaging metrics from all matrices | ||
| NGTDM_STRENGTH_2DV_HU | NGTDM Strength by Slice with Full Merging | 1 | IBSI-consistent strength of NGTDM of unpadded ROI with aggregation by merging 8 matrices for each slice | ||
| NGTDM_STRENGTH_3D_HU | NGTDM Strength as Volume, with Full Merging | 1 | IBSI-consistent strength of NGTDM of unpadded ROI with aggregation by merging matrices from all 26 directions | ||
| LOG_2D_COV_2_5MM_HU | Coefficient of Variation of LoG (2.5 mm) Filtered Slice by Slice | higher order statistics features | Coefficient of variation of 2D LoG transformed voxels at 2.5 mm smoothing | ||
| LOG_2D_ENERGY_0_0MM_HU | Energy of LoG (0.0 mm) Filtered Slice by Slice | HU^2 | Energy of 2D LoG transformed voxels at 0 mm smoothing | ||
| LOG_2D_ENERGY_2_5MM_HU | Energy of LoG (2.5 mm) Filtered Slice by Slice | HU^2 | Energy of 2D LoG transformed voxels at 2.5 mm smoothing | ||
| LOG_2D_ENTROPY_2_5MM_HU | Entropy of LoG (2.5 mm) Filtered Slice by Slice | Entropy of 2D LoG transformed voxels at 2.5 mm smoothing | |||
| LOG_2D_MEAN_2_5MM_HU | Mean of LoG (2.5 mm) Filtered Slice by Slice | HU | Mean of 2D LoG transformed voxels at 2.5 mm smoothing | ||
| WAVELET_HHL_ENERGY_HU | Wavelet HHL Energy | HU^2 | Energy of voxels under wavelet transforms with filters HHL. | ||
| WAVELET_HHL_ENTROPY_HU | Wavelet HHL Entropy | Entropy of voxels under wavelet transforms with filters HHL. | |||
| WAVELET_HHL_KURTOSIS_HU | Wavelet HHL Excess Kurtosis | Excess kurtosis voxels under wavelet transforms with filters HHL. | |||
| WAVELET_HHL_MEDIAN_HU | Wavelet HHL Median | HU | Median of voxels under wavelet transforms with filters HHL. | ||
| WAVELET_HHL_MIN_HU | Wavelet HHL MInimum | HU | Minimum of voxels under wavelet transforms with filters HHL. | ||
| WAVELET_HHL_PERCENTILE10_HU | Wavelet HHL 10th Percentile | HU | The 10th percentile of voxels under wavelet transforms with filters HHL. | ||
| WAVELET_HHL_PERCENTILE90_HU | Wavelet HHL 90th Percentile | HU | The 90th percentile voxels under wavelet transforms with filters HHL. | ||
| WAVELET_HHL_ROBUST_MEAN_DEVIATION_HU | Wavelet HHL Robust Mean Deviation | HU | Robust absolute deviation from the mean of voxels under wavelet transforms with filters HHL. |
References
- Sung, H.; Ferlay, J.; Siegel, R.L.; Laversanne, M.; Soerjomataram, I.; Jemal, A.; Bray, F. Global cancer statistics 2020: GLOBOCAN estimates of incidence and mortality worldwide for 36 cancers in 185 countries. CA Cancer J. Clin. 2021, 71, 209–249. [Google Scholar] [CrossRef] [PubMed]
- World Health Organization (WHO). Global Health Estimates 2020: Deaths by Cause, Age, Sex, by Country and by Region, 2000–2019; WHO: Geneva, Switzerland, 2020. [Google Scholar]
- Chang, C.; Sun, X.; Zhao, W.; Wang, R.; Qian, X.; Lei, B.; Wang, L.; Liu, L.; Ruan, M.; Xie, W.; et al. Minor components of micropapillary and solid subtypes in lung invasive adenocarcinoma (≤3 cm): PET/CT findings and correlations with lymph node metastasis. Radiol. Med. 2019, 125, 257–264. [Google Scholar] [CrossRef] [PubMed]
- Bodor, J.N.; Boumber, Y.; Borghaei, H. Biomarkers for immune checkpoint inhibition in non-small cell lung cancer (NSCLC). Cancer 2019, 126, 260–270. [Google Scholar] [CrossRef]
- Russo, A.; McCusker, M.; Scilla, K.A.; Arensmeyer, K.E.; Mehra, R.; Adamo, V.; Rolfo, C. Immunotherapy in Lung Cancer: From a Minor God to the Olympus. Adv. Exp. Med. Biol. 2020, 1244, 69–92. [Google Scholar] [CrossRef]
- Sanmamed, M.F.; Eguren-Santamaria, I.; Schalper, K.A. Overview of Lung Cancer Immunotherapy. Cancer J. 2020, 26, 473–484. [Google Scholar] [CrossRef] [PubMed]
- Benedetti, G.; Mori, M.; Panzeri, M.M.; Barbera, M.; Palumbo, D.; Sini, C.; Muffatti, F.; Andreasi, V.; Steidler, S.; Doglioni, C.; et al. CT-derived radiomic features to discriminate histologic characteristics of pancreatic neuroendocrine tumors. Radiol. Med. 2021, 126, 745–760. [Google Scholar] [CrossRef]
- Agazzi, G.M.; Ravanelli, M.; Roca, E.; Medicina, D.; Balzarini, P.; Pessina, C.; Vermi, W.; Berruti, A.; Maroldi, R.; Farina, D. CT texture analysis for prediction of EGFR mutational status and ALK rearrangement in patients with non-small cell lung cancer. Radiol. Med. 2021, 126, 786–794. [Google Scholar] [CrossRef]
- Zhang, G.; Yang, Z.; Gong, L.; Jiang, S.; Wang, L.; Zhang, H. Classification of lung nodules based on CT images using squeeze-and-excitation network and aggregated residual transformations. Radiol. Med. 2020, 125, 374–383. [Google Scholar] [CrossRef] [PubMed]
- Cusumano, D.; Meijer, G.; Lenkowicz, J.; Chiloiro, G.; Boldrini, L.; Masciocchi, C.; Dinapoli, N.; Gatta, R.; Casà, C.; Damiani, A.; et al. A field strength independent MR radiomics model to predict pathological complete response in locally advanced rectal cancer. Radiol. Med. 2021, 126, 421–429. [Google Scholar] [CrossRef]
- Kirienko, M.; Ninatti, G.; Cozzi, L.; Voulaz, E.; Gennaro, N.; Barajon, I.; Ricci, F.; Carlo-Stella, C.; Zucali, P.; Sollini, M.; et al. Computed tomography (CT)-derived radiomic features differentiate prevascular mediastinum masses as thymic neoplasms versus lymphomas. Radiol. Med. 2020, 125, 951–960. [Google Scholar] [CrossRef]
- Abdollahi, H.; Mofid, B.; Shiri, I.; Razzaghdoust, A.; Saadipoor, A.; Mahdavi, A.; Galandooz, H.M.; Mahdavi, S.R. Machine learning-based radiomic models to predict intensity-modulated radiation therapy response, Gleason score and stage in prostate cancer. Radiol. Med. 2019, 124, 555–567. [Google Scholar] [CrossRef] [PubMed]
- Zhang, Y.; Zhu, Y.; Zhang, K.; Liu, Y.; Cui, J.; Tao, J.; Wang, Y.; Wang, S. Invasive ductal breast cancer: Preoperative predict Ki-67 index based on radiomics of ADC maps. Radiol. Med. 2020, 125, 109–116. [Google Scholar] [CrossRef] [PubMed]
- Zhang, L.; Kang, L.; Li, G.; Zhang, X.; Ren, J.; Shi, Z.; Li, J.; Yu, S. Computed tomography-based radiomics model for discriminating the risk stratification of gastrointestinal stromal tumors. Radiol. Med. 2020, 125, 465–473. [Google Scholar] [CrossRef]
- Granata, V.; Fusco, R.; Avallone, A.; De Stefano, A.; Ottaiano, A.; Sbordone, C.; Brunese, L.; Izzo, F.; Petrillo, A. Radiomics-Derived Data by Contrast Enhanced Magnetic Resonance in RAS Mutations Detection in Colorectal Liver Metastases. Cancers 2021, 13, 453. [Google Scholar] [CrossRef]
- Fusco, R.; Granata, V.; Petrillo, A. Introduction to Special Issue of Radiology and Imaging of Cancer. Cancers 2020, 12, 2665. [Google Scholar] [CrossRef]
- Granata, V.; Fusco, R.; Risi, C.; Ottaiano, A.; Avallone, A.; De Stefano, A.; Grimm, R.; Grassi, R.; Brunese, L.; Izzo, F.; et al. Diffusion-Weighted MRI and Diffusion Kurtosis Imaging to Detect RAS Mutation in Colorectal Liver Metastasis. Cancers 2020, 12, 2420. [Google Scholar] [CrossRef]
- Jia, T.-Y.; Xiong, J.-F.; Li, X.-Y.; Yu, W.; Xu, Z.-Y.; Cai, X.-W.; Ma, J.-C.; Ren, Y.-C.; Larsson, R.; Zhang, J.; et al. Identifying EGFR mutations in lung adenocarcinoma by noninvasive imaging using radiomics features and random forest modeling. Eur. Radiol. 2019, 29, 4742–4750. [Google Scholar] [CrossRef]
- Hu, H.-T.; Shan, Q.-Y.; Chen, S.-L.; Li, B.; Feng, S.-T.; Xu, E.-J.; Li, X.; Long, J.-Y.; Xie, X.-Y.; Lu, M.-D.; et al. CT-based radiomics for preoperative prediction of early recurrent hepatocellular carcinoma: Technical reproducibility of acquisition and scanners. Radiol. Med. 2020, 125, 697–705. [Google Scholar] [CrossRef]
- Farchione, A.; Larici, A.R.; Masciocchi, C.; Cicchetti, G.; Congedo, M.T.; Franchi, P.; Gatta, R.; Cicero, S.L.; Valentini, V.; Bonomo, L.; et al. Exploring technical issues in personalized medicine: NSCLC survival prediction by quantitative image analysis—Usefulness of density correction of volumetric CT data. Radiol. Med. 2020, 125, 625–635. [Google Scholar] [CrossRef]
- Nazari, M.; Shiri, I.; Hajianfar, G.; Oveisi, N.; Abdollahi, H.; Deevband, M.R.; Oveisi, M.; Zaidi, H. Noninvasive Fuhrman grading of clear cell renal cell carcinoma using computed tomography radiomic features and machine learning. Radiol. Med. 2020, 125, 754–762. [Google Scholar] [CrossRef] [PubMed] [Green Version]
- Fusco, R.; Granata, V.; Mazzei, M.A.; Meglio, N.D.; Roscio, D.D.; Moroni, C.; Monti, R.; Cappabianca, C.; Picone, C.; Neri, E.; et al. Quantitative imaging decision support (QIDS™) tool consistency evaluation and radiomic analysis by means of 594 metrics in lung carcinoma on chest CT scan. Cancer Control 2021, 28, 1073274820985786. [Google Scholar] [CrossRef] [PubMed]
- Gering, D.; Sun, K.; Avery, A.; Chylla, R.; Vivekanandan, A.; Kohli, L.; Knapp, H.; Paschke, B.; Young-Moxon, B.; King, N.; et al. Semi-automatic brain tumor segmentation by drawing long axes on multi-plane reformat. In Proceedings of the International MICCAI Brainlesion Workshop, Granada, Spain, 16 September 2018; pp. 441–455. [Google Scholar]
- Gering, D.; Kotrotsou, A.; Young-Moxon, B.; Miller, N.; Avery, A.; Kohli, L.; Knapp, H.; Hoffman, J.; Chylla, R.; Peitzman, L.; et al. Measuring Efficiency of Semi-automated Brain Tumor Segmentation by Simulating User Interaction. Front. Comput. Neurosci. 2020, 14, 32. [Google Scholar] [CrossRef] [Green Version]
- Zwanenburg, A.; Leger, S.; Vallières, M.; Löck, S. Image biomarker standardisation initiative. arXiv 2019, arXiv:1612.07003. [Google Scholar]
- Fusco, R.; Sansone, M.; Filice, S.; Carone, G.; Amato, D.M.; Sansone, C.; Petrillo, A. Pattern Recognition Approaches for Breast Cancer DCE-MRI Classification: A Systematic Review. J. Med. Biol. Eng. 2016, 36, 449–459. [Google Scholar] [CrossRef] [Green Version]
- Tibshirani, R. The lasso Method for Variable Selection in the Cox Model. Stat. Med. 1997, 28, 385–395. [Google Scholar] [CrossRef] [Green Version]
- Tibshirani, R. Regression Shrinkage and Selection Via the Lasso. J. R. Stat. Soc. Ser. B 1996, 58, 267–288. [Google Scholar] [CrossRef]
- James, G.; Witten, D.; Hastie, T.; Tibshirani, R. An Introduction to Statistical Learning with Applications in R; Springer Publishing Company, Inc.: Berlin/Heidenberg, Germany, 2014. [Google Scholar]
- Bruce, P.; Bruce, A. Practical Statistics for Data Scientists; O’Reilly Media, Inc.: Sebastopol, CA, USA, 2017. [Google Scholar]
- Nishino, M.; Ramaiya, N.H.; Hatabu, H.; Hodi, F.S. Monitoring immune-checkpoint blockade: Response evaluation and biomarker development. Nat. Rev. Clin. Oncol. 2017, 14, 655–668. [Google Scholar] [CrossRef] [PubMed]
- Nishino, M.; Hatabu, H.; Hodi, F.S. Imaging of Cancer Immunotherapy: Current Approaches and Future Directions. Radiology 2019, 290, 9–22. [Google Scholar] [CrossRef]
- Breathnach, O.S.; Freidlin, B.; Conley, B.; Green, M.R.; Johnson, D.H.; Gandara, D.R.; O’Connell, M.; Shepherd, F.A.; Johnson, B.E. Twenty-Two Years of Phase III Trials for Patients with Advanced Non–Small-Cell Lung Cancer: Sobering Results. J. Clin. Oncol. 2001, 19, 1734–1742. [Google Scholar] [CrossRef]
- Rizvi, A.N.A.; Mazières, J.; Planchard, D.; Stinchcombe, E.T.E.; Dy, G.K.; Antonia, S.J.; Horn, L.; Lena, H.; Minenza, E.; Mennecier, B.; et al. Activity and safety of nivolumab, an anti-PD-1 immune checkpoint inhibitor, for patients with advanced, refractory squamous non-small-cell lung cancer (CheckMate 063): A phase 2, single-arm trial. Lancet Oncol. 2015, 16, 257–265. [Google Scholar] [CrossRef] [Green Version]
- Garon, E.B.; Rizvi, N.A.; Hui, R.; Leighl, N.; Balmanoukian, A.S.; Eder, J.P.; Patnaik, A.; Aggarwal, C.; Gubens, M.; Horn, L.; et al. Pembrolizumab for the treatment of non-small-cell lung cancer. N. Engl. J. Med. 2015, 372, 2018–2028. [Google Scholar] [CrossRef] [PubMed]
- Reginelli, A.; Capasso, R.; Petrillo, M.; Rossi, C.; Faella, P.; Grassi, R.; Belfiore, M.P.; Rossi, G.; Muto, M.; Muto, P.; et al. Looking for Lepidic Component inside Invasive Adenocarcinomas Appearing as CT Solid Solitary Pulmonary Nodules (SPNs): CT Morpho-Densitometric Features and 18-FDG PET Findings. BioMed Res. Int. 2019, 2019, 1–9. [Google Scholar] [CrossRef] [PubMed] [Green Version]
- Fusco, R.; Granata, V.; Maio, F.; Sansone, M.; Petrillo, A. Textural radiomic features and time-intensity curve data analysis by dynamic contrast-enhanced MRI for early prediction of breast cancer therapy response: Preliminary data. Eur. Radiol. Exp. 2020, 4, 1–7. [Google Scholar] [CrossRef] [PubMed]
- Sun, R.; Limkin, E.J.; Vakalopoulou, M.; Dercle, L.; Champiat, S.; Han, S.R.; Verlingue, L.; Brandao, D.; Lancia, A.; Ammari, S.; et al. A radiomics approach to assess tumour-infiltrating CD8 cells and response to an-ti-PD-1 or anti-PD-L1 immunotherapy: An imaging biomarker, retrospective multicohort study. Lancet Oncol. 2018, 19, 1180–1191. [Google Scholar] [CrossRef]
- Yang, Y.; Yang, J.; Shen, L.; Chen, J.; Xia, L.; Ni, B.; Ge, L.; Wang, Y.; Lu, S. A multi-omics-based serial deep learning approach to predict clinical outcomes of single-agent anti-PD-1/PD-L1 immunotherapy in advanced stage non-small-cell lung cancer. Am. J. Transl. Res. 2021, 13, 743–756. [Google Scholar]
- Tian, P.; He, B.; Mu, W.; Liu, K.; Liu, L.; Zeng, H.; Liu, Y.; Jiang, L.; Zhou, P.; Huang, Z.; et al. Assessing PD-L1 expression in non-small cell lung cancer and predicting responses to immune checkpoint inhibitors using deep learning on computed tomography images. Theranostics 2021, 11, 2098–2107. [Google Scholar] [CrossRef]


| Inclusion Criteria | Exclusion Criteria |
|---|---|
| Lung adenocarcinoma histologically confirmed | Baseline CT study is not accessible |
| Lung nodule size > 10 mm | Tumor histology other than adenocarcinoma |
| Immunotherapy ((PD-1)/programmed death-ligand 1 (PD-L1) inhibitors) as first- or second-line therapy | |
| CT examination within 1 month of immunotherapy | |
| CT protocol included venous phase (70–90 s post-contrast agent injection) |
| Group | Feature | Feature Type | Risk Ratio | p Value |
|---|---|---|---|---|
| Immunotherapy group | GLSZM_IBSI_GL_NONUNIF_3D_HU | texture features | 21.09 | 0.02 |
| GLDZM_IBSI_ZONE_DISTANCE_NONUNIFORMITY_3D_HU | 0.00 | 0.01 | ||
| NGLDM_IBSI_GLNONUNIF_2DV_HU | −0.02 | 0.01 | ||
| NGLDM_IBSI_GLNONUNIF_3D_HU | −0.02 | 0.01 | ||
| NGLDM_IBSI_DEP_NONUNIF_2DV_HU | −0.02 | 0.01 | ||
| NGLDM_IBSI_DEP_NONUNIF_3D_HU | −0.06 | 0.01 | ||
| LOG_2D_ENERGY_0_0MM_HU | higher-order statistical features | 0.00 | 0.00 |
| Group | Feature | Feature Type | Risk Ratio | p Value |
|---|---|---|---|---|
| Immunotherapy group | GLCM_IBSI_CORRELLATION_2DF_HU | texture features | −3.86 | 0.01 |
| GLCM_IBSI_CORRELLATION_2DS_HU | −4.03 | 0.01 | ||
| GLCM_IBSI_CORRELLATION_2DV_HU | −4.06 | 0.04 | ||
| GLCM_IBSI_CORRELLATION_3DF_HU | −4.07 | 0.00 | ||
| GLCM_IBSI_CORRELLATION_3DV_HU | −4.63 | 0.00 | ||
| GLCM_IBSI_FMIC_3DF_HU | −4.88 | 0.02 | ||
| GLCM_IBSI_SMIC_3DV_HU | −4.69 | 0.02 | ||
| GLCM_ASM | 349.75 | 0.00 | ||
| GLCM_CORRELATION | −4.65 | 0.01 | ||
| GLCM_CORRELATION_GL | −4.50 | 0.01 | ||
| GLCM_ENERGY | 39.37 | 0.00 | ||
| GLCM_ENTROPY | −0.37 | 0.00 | ||
| GLDZM_IBSI_SMALL_DIST_EMPH_2DS_HU | 4.00 | 0.02 | ||
| GLDZM_IBSI_ZONE_DISTANCE_ENTROPY_2DS_HU | −0.55 | 0.01 | ||
| GLDZM_IBSI_SMALL_DIST_EMPH_2DV_HU | 3.45 | 0.03 | ||
| GLDZM_IBSI_ZONE_DISTANCE_ENTROPY_2DV_HU | −0.47 | 0.02 | ||
| GLDZM_IBSI_ZONE_DISTANCE_NONUNIFORMITY_2DV_HU | 4.80 | 0.03 | ||
| GLDZM_IBSI_SMALL_DIST_EMPH_3D_HU | 2.84 | 0.02 | ||
| GLDZM_IBSI_SMALL_DIST_LOW_GL_EMPH_3D_HU | 119.27 | 0.00 | ||
| GLDZM_IBSI_ZONE_DISTANCE_ENTROPY_3D_HU | −0.45 | 0.01 | ||
| GLSZM_IBSI_ZS_ENTROPY_2DS_HU | −1.09 | 0.01 | ||
| GLSZM_IBSI_ZS_ENTROPY_2DV_HU | −0.98 | 0.03 | ||
| GLSZM_IBSI_ZS_ENTROPY_3D_HU | −0.79 | 0.04 | ||
| NGLDM_IBSI_DEP_ENTROPY_2DF_HU | −0.86 | 0.02 | ||
| NGLDM_IBSI_DEP_ENTROPY_3D_HU | −0.94 | 0.01 | ||
| NGTDM_COARSENESS_2DV_HU | 47.72 | 0.00 | ||
| NGTDM_COARSENESS_3D_HU | 88.65 | 0.00 | ||
| NGTDM_STRENGTH_2DV_HU | 0.13 | 0.00 | ||
| NGTDM_STRENGTH_3D_HU | 0.18 | 0.00 | ||
| LOG_2D_ENTROPY_2_5MM_HU | higher-order statistical features | −0.17 | 0.03 | |
| WAVELET_HHL_PERCENTILE90_HU | −0.01 | 0.02 | ||
| WAVELET_HHL_ENTROPY_HU | −0.17 | 0.03 | ||
| Control group | NGLDM_IBSI_GLNONUNIF_2DV_HU | texture features | −2.93 | 0.01 |
| NGLDM_IBSI_GLNONUNIF_3D_HU | −0.02 | 0.00 | ||
| NGLDM_IBSI_DEP_NONUNIF_2DV_HU | −0.02 | 0.00 | ||
| NGLDM_IBSI_DEP_NONUNIF_3D_HU | −0.06 | 0.00 | ||
| NGTDM_COMPLEXITY_2DF_HU | 0.00 | 0.04 |
| Group | Feature | Feature Type | p Value at Kruskal—Wallis Test | Median Value | Minimum Value | Maximum Value |
|---|---|---|---|---|---|---|
| Immunotherapy group | SHIFT_CENTER_OF_MASS_MM | morphological features | 0.04 | 3.75 | 0.20 | 63.03 |
| VOLUME_DENSITY_AEE | 0.05 | 1.17 | 0.85 | 1.33 | ||
| GLCM_IBSI_CLUSTERPROMINENCE_2DF_HU | texture features | 0.03 | 225,339.31 | 844.00 | 2,812,662.20 | |
| GLCM_IBSI_CLUSTERPROMINENCE_2DS_HU | 0.03 | 225,858.72 | 847.54 | 2,817,987.50 | ||
| GLCM_IBSI_CLUSTERPROMINENCE_2DV_HU | 0.03 | 292,282.78 | 1011.46 | 2,989,657.50 | ||
| GLCM_IBSI_CLUSTERPROMINENCE_3DF_HU | 0.03 | 214,326.87 | 778.73 | 2,815,961.20 | ||
| GLCM_IBSI_CLUSTERPROMINENCE_3DV_HU | 0.03 | 220,935.36 | 783.67 | 2,819,584.20 | ||
| GLDZM_IBSI_GL_VARIANCE_2DS_HU | 0.05 | 82.02 | 8.15 | 205.34 | ||
| GLDZM_IBSI_GL_VARIANCE_2DV_HU | 0.04 | 99.27 | 10.18 | 212.22 | ||
| GLDZM_IBSI_GL_VARIANCE_3D_HU | 0.03 | 116.19 | 19.56 | 239.15 | ||
| GLSZM_IBSI_GL_VARIANCE_2DS_HU | 0.05 | 82.02 | 8.15 | 205.34 | ||
| GLSZM_IBSI_GL_VARIANCE_2DV_HU | 0.04 | 99.27 | 10.18 | 212.22 | ||
| GLSZM_IBSI_GL_VARIANCE_3D_HU | 0.03 | 116.19 | 19.56 | 239.15 | ||
| NGTDM_COMPLEXITY_2DF_HU | 0.04 | 1176.02 | 79.07 | 6533.22 | ||
| LOG_2D_MEAN_2_5MM_HU | higher-order statistical features | 0.04 | −0.18 | −1.27 | 2.42 | |
| WAVELET_HHL_ENERGY_HU | 0.04 | 1,998,296.25 | 43886.58 | 63,200,000.00 | ||
| WAVELET_HHL_MEDIAN_HU | 0.05 | 0.02 | −0.39 | 2.19 | ||
| WAVELET_HHL_MIN_HU | 0.01 | −149.82 | −299.53 | −68.56 | ||
| Control group | GREATEST_PLANAR_AXIS | morphological features | 0.00 | 1.00 | 0.00 | 2.00 |
| LOG_2D_MEAN_2_5MM_HU | higher-order statistical features | 0.03 | −0.18 | −1.27 | 2.42 |
| Group | Feature | Feature Type | p Value at Kruskal—Wallis Test | Median Value | Minimum Value | Maximum Value |
|---|---|---|---|---|---|---|
| Immunotherapy group | ANTPOST_LENGTH_MM | morphological features | 0.02 | 41.52 | 5.94 | 111.37 |
| APPROXIMATE_VOLUME_ML | 0.03 | 26.33 | 0.23 | 718.78 | ||
| APPROXIMATE_VOLUME_MM3 | 0.03 | 26,329.14 | 231.27 | 718,778.30 | ||
| AVG_AXIAL_DIAMETER_MM | 0.01 | 38.40 | 6.37 | 114.50 | ||
| AVG_CORONAL_DIAMETER_MM | 0.02 | 36.60 | 7.46 | 125.46 | ||
| AVG_SAGITTAL_DIAMETER_MM | 0.02 | 41.02 | 7.42 | 121.31 | ||
| LARGEST_PLANAR_DIAMETER_MM | 0.01 | 47.87 | 6.78 | 121.53 | ||
| LARGEST_PLANAR_ORTHO_DIAMETER_MM | 0.01 | 29.75 | 5.97 | 109.43 | ||
| SHIFT_CENTER_OF_MASS_MM | 0.03 | 3.75 | 0.20 | 63.03 | ||
| COMPACTNESS1_MM | 0.04 | 45.68 | 3.49 | 324.34 | ||
| CORONAL_LONG_AXIS_MM | 0.02 | 42.04 | 8.38 | 139.23 | ||
| CRANIALCAUDAL_LENGTH_MM | 0.04 | 37.28 | 5.67 | 131.15 | ||
| GREATEST_PLANAR_LENGTH | 0.02 | 50.87 | 8.72 | 145.10 | ||
| SAGITTAL_LONG_AXIS_MM | 0.02 | 50.25 | 8.72 | 145.10 | ||
| SAGITTAL_SHORT_AXIS_MM | 0.04 | 30.55 | 3.33 | 102.60 | ||
| SURFACE_AREA_MM2 | 0.02 | 5048.57 | 164.85 | 44,177.98 | ||
| TRANSVERSE_LENGTH_MM | 0.02 | 38.62 | 6.76 | 117.99 | ||
| VOLUME_ML | 0.03 | 24.48 | 0.19 | 718.42 | ||
| VOLUME_MM3 | 0.03 | 24,480.15 | 185.97 | 718,415.94 | ||
| VOLUME_VOXELS | 0.01 | 16,348.50 | 97.00 | 534,080.00 | ||
| VOLUMETRIC_LENGTH_MM | 0.01 | 52.86 | 8.90 | 145.30 | ||
| L1_DISTANCE_MM | 0.02 | 48.33 | 7.82 | 121.30 | ||
| L2_DISTANCE_MM | 0.03 | 34.81 | 6.56 | 100.44 | ||
| L3_DISTANCE_MM | 0.03 | 25.00 | 4.36 | 89.54 | ||
| SOLID_VOLUME_MM3 | lung CT features | 0.04 | 25,469.57 | 128.75 | 717,505.20 | |
| SOLID_VOLUME_ML | 0.04 | 25.47 | 0.13 | 717.51 | ||
| SOLID_VOLUME_VOXELS | 0.01 | 15,791.50 | 54.00 | 533,134.00 | ||
| PART_SOLID_DIAMETER_MM | 0.01 | 37.89 | 5.24 | 114.44 | ||
| INTENSITY_HISTOGRAM_ENERGY_HU | features based on intensity value | 0.02 | 37,350,000.00 | 39,863.00 | 1,450,000,000.00 | |
| GLCM_IBSI_CORRELLATION_2DF_HU | texture features | 0.00 | 0.72 | 0.33 | 0.89 | |
| GLCM_IBSI_CORRELLATION_2DS_HU | 0.00 | 0.72 | 0.34 | 0.89 | ||
| GLCM_IBSI_CORRELLATION_2DV_HU | 0.03 | 0.80 | 0.42 | 0.94 | ||
| GLCM_IBSI_CORRELLATION_3DF_HU | 0.01 | 0.58 | 0.08 | 0.89 | ||
| GLCM_IBSI_CORRELLATION_3DV_HU | 0.01 | 0.59 | 0.22 | 0.89 | ||
| GLCM_IBSI_FMIC_3DV_HU | 0.00 | −0.11 | −0.25 | −0.03 | ||
| GLCM_IBSI_SMIC_3DV_HU | 0.01 | 0.74 | 0.46 | 0.92 | ||
| GLCM_ASM | 0.01 | 0.00 | 0.00 | 0.01 | ||
| GLCM_CORRELATION | 0.01 | 0.64 | 0.39 | 0.91 | ||
| GLCM_CORRELATION_GL | 0.01 | 0.64 | 0.00 | 0.90 | ||
| GLCM_ENERGY | 0.01 | 0.01 | 0.01 | 0.10 | ||
| GLCM_ENTROPY | 0.00 | 12.89 | 6.60 | 14.86 | ||
| GLDZM_IBSI_SMALL_DIST_EMPH_2DS_HU | 0.02 | 0.41 | 0.18 | 0.67 | ||
| GLDZM_IBSI_ZONE_DISTANCE_ENTROPY_2DS_HU | 0.00 | 6.43 | 4.28 | 8.09 | ||
| GLDZM_IBSI_ZONE_DISTANCE_NONUNIFORMITY_2DS_HU | 0.00 | 45.38 | 11.58 | 90.68 | ||
| GLDZM_IBSI_ZONE_DISTANCE_NONUNIFORMITY_NORMALIZED_2DS_HU | 0.03 | 0.22 | 0.07 | 0.45 | ||
| GLDZM_IBSI_ZONE_DISTANCE_VARIANCE_2DS_HU | 0.05 | 8.07 | 0.52 | 149.19 | ||
| GLDZM_IBSI_GL_NONUNIFORMITY_2DV_HU | 0.02 | 255.74 | 3.26 | 9626.30 | ||
| GLDZM_IBSI_SMALL_DIST_EMPH_2DV_HU | 0.02 | 0.35 | 0.13 | 0.63 | ||
| GLDZM_IBSI_ZONE_DISTANCE_ENTROPY_2DV_HU | 0.01 | 7.68 | 5.26 | 9.16 | ||
| GLDZM_IBSI_ZONE_DISTANCE_NONUNIFORMITY_2DV_HU | 0.00 | 777.59 | 33.98 | 7437.29 | ||
| GLDZM_IBSI_ZONE_DISTANCE_NONUNIFORMITY_NORMALIZED_2DV_HU | 0.03 | 0.16 | 0.04 | 0.40 | ||
| GLDZM_IBSI_GL_NONUNIFORMITY_3D_HU | 0.00 | 109.21 | 2.64 | 1697.68 | ||
| GLDZM_IBSI_LARGE_DIST_EMPH_3D_HU | 0.01 | 5.64 | 1.00 | 93.17 | ||
| GLDZM_IBSI_SMALL_DIST_EMPH_3D_HU | 0.01 | 0.68 | 0.35 | 1.00 | ||
| GLDZM_IBSI_SMALL_DIST_LOW_GL_EMPH_3D_HU | 0.02 | 0.00 | 0.00 | 0.03 | ||
| GLDZM_IBSI_ZONE_DISTANCE_ENTROPY_3D_HU | 0.03 | 6.67 | 4.40 | 8.57 | ||
| GLDZM_IBSI_ZONE_DISTANCE_NONUNIFORMITY_3D_HU | 0.00 | 1097.70 | 52.00 | 6943.99 | ||
| GLDZM_IBSI_ZONE_DISTANCE_NONUNIFORMITY_NORMALIZED_3D_HU | 0.01 | 0.43 | 0.13 | 1.00 | ||
| GLDZM_IBSI_ZONE_DISTANCE_VARIANCE_3D_HU | 0.01 | 1.76 | 0.00 | 53.91 | ||
| GLRLM_IBSI_GLNONUNIFORMITY_2DV_HU | 0.04 | 4350.77 | 14.15 | 254,334.25 | ||
| GLRLM_IBSI_GLNONUNIFORMITY_3DF_HU | 0.03 | 1171.83 | 3.58 | 69,500.89 | ||
| GLRLM_IBSI_GLNONUNIFORMITY_3DV_HU | 0.03 | 15,231.78 | 46.31 | 903,435.10 | ||
| GLRLM_IBSI_RUNLENGTHNONUNIFORMITY_2DF_HU | 0.01 | 374.04 | 29.69 | 2766.90 | ||
| GLRLM_IBSI_RUNLENGTHNONUNIFORMITY_2DS_HU | 0.01 | 1491.65 | 118.62 | 11,004.87 | ||
| GLRLM_IBSI_RUNLENGTHNONUNIFORMITY_2DV_HU | 0.01 | 29,137.73 | 355.64 | 612,642.30 | ||
| GLRLM_IBSI_RUNLENGTHNONUNIFORMITY_3DF_HU | 0.01 | 9072.57 | 91.34 | 177,585.50 | ||
| GLRLM_IBSI_RUNLENGTHNONUNIFORMITY_3DV_HU | 0.01 | 117,863.44 | 1187.01 | 2,296,799.20 | ||
| GLSZM_IBSI_GL_NONUNIF_2DV_HU | 0.02 | 255.74 | 3.26 | 9626.30 | ||
| GLSZM_IBSI_GL_NONUNIF_3D_HU | 0.00 | 109.21 | 2.64 | 1697.68 | ||
| GLSZM_IBSI_SMALL_ZONE_EMPH_3D_HU | 0.03 | 0.74 | 0.60 | 0.83 | ||
| GLSZM_IBSI_SMALL_ZONE_LOW_GL_EMPH_3D_HU | 0.04 | 0.00 | 0.00 | 0.03 | ||
| GLSZM_IBSI_ZS_ENTROPY_2DS_HU | 0.00 | 5.70 | 4.24 | 6.37 | ||
| GLSZM_IBSI_ZS_ENTROPY_2DV_HU | 0.03 | 6.52 | 5.16 | 7.07 | ||
| GLSZM_IBSI_ZS_ENTROPY_3D_HU | 0.03 | 6.62 | 5.32 | 7.44 | ||
| GLSZM_IBSI_ZS_NONUNIF_NORMALISED_3D_HU | 0.03 | 0.51 | 0.33 | 0.65 | ||
| GLSZM_IBSI_ZS_NONUNIF_2DS_HU | 0.00 | 130.66 | 23.54 | 725.63 | ||
| GLSZM_IBSI_ZS_NONUNIF_2DV_HU | 0.00 | 2406.05 | 69.56 | 34,717.15 | ||
| GLSZM_IBSI_ZS_NONUNIF_3D_HU | 0.00 | 1367.97 | 44.19 | 13,020.40 | ||
| NGLDM_IBSI_GLNONUNIF_2DV_HU | 0.04 | 2108.79 | 3.66 | 118,346.81 | ||
| NGLDM_IBSI_GLNONUNIF_3D_HU | 0.04 | 2108.79 | 3.66 | 118,346.81 | ||
| NGLDM_IBSI_DEP_ENTROPY_2DF_HU | 0.01 | 5.55 | 4.28 | 6.48 | ||
| NGLDM_IBSI_DEP_ENTROPY_3D_HU | 0.01 | 7.00 | 5.52 | 7.89 | ||
| NGLDM_IBSI_DEP_NONUNIF_2DF_HU | 0.01 | 185.29 | 22.44 | 1201.75 | ||
| NGLDM_IBSI_DEP_NONUNIF_2DV_HU | 0.01 | 3029.10 | 64.51 | 82,117.83 | ||
| NGLDM_IBSI_DEP_NONUNIF_3D_HU | 0.00 | 1532.28 | 43.76 | 32,843.65 | ||
| NGLDM_IBSI_HIGH_DEP_LOW_GL_EMPH_3D_HU | 0.04 | 0.03 | 0.01 | 0.21 | ||
| NGTDM_BUSYNESS_2DV_HU | 0.02 | 0.43 | 0.03 | 9.34 | ||
| NGTDM_BUSYNESS_3D_HU | 0.01 | 0.58 | 0.06 | 11.04 | ||
| NGTDM_COARSENESS_2DV_HU | 0.03 | 0.00 | 0.00 | 0.05 | ||
| NGTDM_COARSENESS_3D_HU | 0.01 | 0.00 | 0.00 | 0.04 | ||
| NGTDM_STRENGTH_2DV_HU | 0.00 | 3.35 | 0.24 | 33.97 | ||
| NGTDM_STRENGTH_3D_HU | 0.00 | 2.01 | 0.19 | 23.53 | ||
| LOG_2D_ENERGY_0_0MM_HU | higher-order statistical features | 0.00 | 628,000,000.00 | 0.00 | 15,700,000,000.00 | |
| LOG_2D_ENERGY_2_5MM_HU | 0.00 | 462,665.47 | 5610.69 | 10,400,000.00 | ||
| LOG_2D_ENTROPY_2_5MM_HU | 0.01 | 14.00 | 6.60 | 19.03 | ||
| LOG_2D_MEAN_2_5MM_HU | 0.01 | −0.18 | −1.27 | 2.42 | ||
| WAVELET_HHL_ENERGY_HU | 0.01 | 1,998,296.25 | 43,886.58 | 63,200,000.00 | ||
| WAVELET_HHL_ENTROPY_HU | 0.01 | 14.00 | 6.60 | 19.03 | ||
| WAVELET_HHL_KURTOSIS_HU | 0.04 | 29.91 | 2.04 | 324.52 | ||
| WAVELET_HHL_PERCENTILE10_HU | 0.03 | −7.04 | −35.16 | −2.24 | ||
| WAVELET_HHL_PERCENTILE90_HU | 0.04 | 7.53 | 2.31 | 33.86 | ||
| WAVELET_HHL_ROBUST_MEAN_DEVIATION_HU | 0.05 | 2.53 | 0.93 | 13.78 | ||
| Control group | SHIFT_CENTER_OF_MASS_MM | morphological features | 0.03 | 3.75 | 0.20 | 63.03 |
| PERCENT_AIR | lung CT features | 0.02 | 0.00 | 0.00 | 1.05 | |
| NGLDM_IBSI_DEP_VARIANCE_2DF_HU | texture features | 0.03 | 2.57 | 0.19 | 5.69 | |
| LOG_2D_COV_2_5MM_HU | higher-order statistical features | 0.01 | −9.83 | −1429.77 | 308.28 |
Publisher’s Note: MDPI stays neutral with regard to jurisdictional claims in published maps and institutional affiliations. |
© 2021 by the authors. Licensee MDPI, Basel, Switzerland. This article is an open access article distributed under the terms and conditions of the Creative Commons Attribution (CC BY) license (https://creativecommons.org/licenses/by/4.0/).
Share and Cite
Granata, V.; Fusco, R.; Costa, M.; Picone, C.; Cozzi, D.; Moroni, C.; La Casella, G.V.; Montanino, A.; Monti, R.; Mazzoni, F.; et al. Preliminary Report on Computed Tomography Radiomics Features as Biomarkers to Immunotherapy Selection in Lung Adenocarcinoma Patients. Cancers 2021, 13, 3992. https://doi.org/10.3390/cancers13163992
Granata V, Fusco R, Costa M, Picone C, Cozzi D, Moroni C, La Casella GV, Montanino A, Monti R, Mazzoni F, et al. Preliminary Report on Computed Tomography Radiomics Features as Biomarkers to Immunotherapy Selection in Lung Adenocarcinoma Patients. Cancers. 2021; 13(16):3992. https://doi.org/10.3390/cancers13163992
Chicago/Turabian StyleGranata, Vincenza, Roberta Fusco, Matilde Costa, Carmine Picone, Diletta Cozzi, Chiara Moroni, Giorgia Viola La Casella, Agnese Montanino, Riccardo Monti, Francesca Mazzoni, and et al. 2021. "Preliminary Report on Computed Tomography Radiomics Features as Biomarkers to Immunotherapy Selection in Lung Adenocarcinoma Patients" Cancers 13, no. 16: 3992. https://doi.org/10.3390/cancers13163992